Scales of recruitment variability in warming waters: Comparing native and introduced oysters in Hood Canal, Washington, USA
Abstract
The effect of climate change on natural oyster recruitment has the potential to disrupt many of the ecosystem services oysters provide. Due to the temperature-sensitivity of reproduction, oyster recruitment may shift as water temperatures rise. A biological imprint of climate change was revealed in a multi-decadal time series of recruitment of non-native Pacific oysters (Crassostrea gigas) in the main stem of Hood Canal, Washington, USA, extracted from historic fishery documents. Water in July and August warmed significantly from 1945 to 1995 (0.028 ± 0.004°C per year [±SE]) and accounted for an increase in Pacific oyster recruitment (7% per year, 0.028 ± 0.006 spat per year on log scale [±SE]); recruitment also strongly tracked inter-annual variability in summer water temperature. Methods used to collect historical data were repeated in 2013–2015 when recruitment of both Pacific oysters and native Olympia oysters (Ostrea lurida) were recorded in main stem and lower Hood Canal. Both historic and modern data show large variation within and between years for temperature as well as recruitment. The modern data add information regarding spatial variation, in that recruitment patterns in the two regions of Hood Canal were decoupled. As temperatures continue to increase, non-native Pacific oysters are likely to be favored over Olympia oysters, which recruit earlier at lower temperatures and presently contribute less than half of total oyster recruits. Future recruitment, however, may be limited by environmental factors other than temperature, a point indicated particularly in Hood Canal where many subtidal species already respond strongly to gradients in dissolved oxygen.
1 INTRODUCTION
Coastal marine systems respond to climate change through a variety of pathways operating on different life-history stages and through both physiological changes and community-level species interactions (Harley et al., 2006). This link to climate change represents a natural extension of high recruitment variability in marine species, for which reproduction has been shown to be thermally responsive in both laboratory experiments (Ben Kheder, Moal, & Robert, 2010; Chávez-Villalba et al., 2002; Rico-Villa, Pouvreau, & Robert, 2009) and field studies (Philippart et al., 2003; Shephard, Beukers-Stewart, Hiddink, Brand, & Kaiser, 2010; Valdizan, Beninger, Decottignies, Chantrel, & Cognie, 2011). Indeed, many observed changes in phenology, distribution and performance of marine organisms show a biological imprint of climate change (Poloczanska et al., 2013). Some uncertainty still remains regarding whether non-native species will be disproportionately favored by climate change relative to native species (Lenz et al., 2011; Sorte et al., 2013; Stachowicz, Terwin, Whitlach, & Osman, 2002). In addition, testing time series for potential links to temperature alone can ignore other important drivers (Brown et al., 2011), as, for instance, salinity is a dominant predictor of inter-annual variation in juvenile eastern oyster densities in Chesapeake Bay (Kimmel, Tarnowski, & Newell, 2014). A further caveat arises in regards to the generality of species responses, as some studies demonstrate broad spatial coherence in recruitment (Philippart et al., 2012; Reum, Essington, Greene, Rice, & Fresh, 2011; Taylor, Miller, Pietrafesa, Dickey, & Ross, 2010), but local environmental conditions could decouple recruitment processes. Here, we report on spatial and temporal variability in recruitment of a native and non-native oyster in Hood Canal, Washington, USA. By “recruitment,” we refer to the appearance of microscopic oysters within a few weeks of their transition from pelagic to benthic environment.
Oysters have strong potential for temperature-sensitivity in their recruitment and such variability matters greatly to food security and conservation. In Washington state, oysters that reproduce in the wild include one native and one non-native species. The native Olympia oyster (Ostrea lurida) occurs at low abundance compared to pre-exploitation levels, and stock rebuilding relies on creating shell habitat (if not recruitment limited) or outplanting oysters (if recruitment limited) (Blake & Bradbury, 2012; Cook, Shaffer, Dumbauld, & Kauffman, 2000). The non-native Pacific oyster (Crassostrea gigas) contributes to Washington leading the USA in shellfish production (Goldburg, Elliott, & Naylor, 2001), as well as providing for recreational and Tribal harvests, these last in particular dependent on natural recruitment.
Pacific oysters are among the most widely introduced marine species (Elton, 1958 2000; Molnar, Gamboa, Revenga, & Spalding, 2008). Several reports show range extensions and population increases related to climate warming (Diederich, Nehls, van Beusekom, & Reise, 2005; Dutertre, Beninger, Barille, Papin, & Haure, 2010; Wrange et al., 2010). Models of Pacific oyster dynamics predict reproductive periods and pole-ward expansion of introduced populations (Jones, Dye, Pinnegar, Warren, & Cheung, 2013; Philippart, van Bleijswijk, Kromkamp, Zuur, & Herman, 2014). Several stages of the Pacific oyster life cycle are temperature-sensitive, including gametogenesis (Chávez-Villalba et al., 2002), spawning (Lannan, 1980) and larval development (Ben Kheder et al., 2010; Rico-Villa et al., 2009). In contrast, reproduction occurs at lower temperatures in native Olympia than introduced Pacific oysters (Baker, 1995). Indeed, water temperatures are generally too cool in Washington state and regionally for regular recruitment of Pacific oysters, as larvae require temperatures above 17°C for 3 weeks (Ben Kheder et al., 2010; Rico-Villa et al., 2009). However, in three bays within the region, Pacific oysters have naturalized and provide a source of wild-set oysters for aquaculture and fisheries: Hood Canal (47°30’N, 123°W; Packer, 1980), Willapa Bay (outer coast of Washington, 46°N, 124°W; Trimble, Ruesink, & Dumbauld, 2009; Dumbauld, Kauffman, Trimble, & Ruesink, 2011) and Pendrell Sound (British Columbia, 50°12’N, 124°42’W; Quayle, 1969; Munroe et al., 2011).
We combined historic and recent data on oyster recruitment in Hood Canal to: first, examine predictability and variability of Pacific oyster recruitment in a historic record spanning 1942–1992; and second, evaluate Olympia and Pacific oyster recruitment among regions of Hood Canal in 2013–2015. Our overall goals were to guide outplants versus habitat restoration as options for rebuilding populations of Olympia oysters or supporting harvests of Pacific oysters throughout Hood Canal, and to test for long-term climate trends and oyster responses.
2 MATERIAL AND METHODS
2.1 Study sites
Hood Canal is a sub-estuary of Puget Sound in Washington state, USA (Figure 1). It extends south for more than 80 km, averaging 2.4 km in width and 50–170 m in depth (main stem Hood Canal), and then turns abruptly to the east for another 20 km at depths shallower than 50 m (lower Hood Canal; profile in Khangaonkar & Wang, 2013). Water residence time increases with distance into Hood Canal, estimated at 8 and 16 days in Northern and Southern Hood Canal, respectively (Babson, Kawase, & MacCready, 2006). Some estimates are much longer, with water age reaching 200 days by the end of summer in Southern Hood Canal (Banas et al., 2014). Dissolved oxygen (DO) declines into Hood Canal and these low DO concentrations negatively affect some zooplankton (Keister & Tuttle, 2013). In summer, the thermocline is well above the oxycline with temperatures in the top 10 m being 10°C higher than below (Keister & Tuttle, 2013).
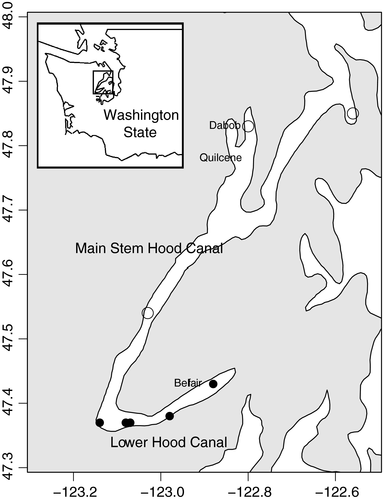
Historical oyster recruitment was measured in Quilcene and Dabob Bays in the main stem of Hood Canal. Up to 14 places around these bays were sampled for recruitment each year from 1942 to 1992 with a 2-years lapse from 1943 to 1944 and a 10-years lapse from 1956 to 1965; temperature data were available until 1995. Results were reported throughout summer on a weekly basis as Oyster Bulletins, documents released by Washington Department of Fisheries (renamed Fish and Wildlife in 1994) that summarized oyster activity and temperatures in the Hood Canal.
The recent study from 2013 to 2015 took place in both main stem and lower Hood Canal. Main stem Hood Canal included three widely spaced sites, only one of which was sampled in all 3 years: Hamma Hamma River (Figure 1, 47° 32’ 26.376’’ N, 123° 1’ 51.132’’ W). We added two sites in main stem Hood Canal in 2014 and 2015: Broadspit in Dabob Bay (47° 49’ 11.424’’ N, 122° 49’ 31.98’’ W), and Point Julia in Port Gamble Bay (Figure 1, 47° 51’ 9.504’’ N, 122° 34’ 21.36’’ W). Lower Hood Canal sites were on the south side of the shore from the Great Bend to the head of the fjord near the town of Belfair (Figure 1, 47° 25’ 26.616’’ N, 122° 52’ 30.252’’ W). Lower Hood Canal had four sites in 2013, five sites in 2014 and four sites in 2015. All Hood Canal sites except Belfair consist of pebble beaches that fringe deep water, whereas Belfair has a shallower slope, water depth of only a few meters, and soft sediments occupied by eelgrass (Zostera marina). Pacific oysters recruit naturally in all these locations, based on the presence of reefs above mean lower low water (MLLW). Scattered populations of adult Olympia oysters have been observed throughout main stem and lower Hood Canal, except recently at Belfair (Valdez, Peabody, Allen, Blake, & Ruesink, 2016).
2.2 Pacific oyster recruitment 1942–1992
Historic records were compiled for water temperatures in Quilcene and Dabob Bays (main stem Hood Canal) from Oyster Bulletins. Water temperatures were recorded at 1 m depth while plankton were also sampled, providing real-time guidance to shellfish farmers on the timing of activities to collect naturally set Pacific oysters. In the early years of the sampling effort, single point samples of temperature were collected fewer than 10 times through the summer from one site in Dabob Bay. Thereafter, particularly 1948–1950 in Quilcene Bay and 1951–1955 in Dabob Bay, the Oyster Bulletins reported the daily average temperature from a thermograph. A point sample was also reported in conjunction with larval sampling every 3–5 days, but these point samples did not materially shift estimates of water temperature, which were primarily a function of thermograph values. From 1966 to 1995, water temperature was measured at several stations during larval sampling cruises that occurred at 3–5 day intervals. Daily water temperatures are calculated as the average of all samples reported for a particular day (mean 2.1 sites, range: 1–18).
Pacific oyster recruitment was measured in Quilcene and Dabob Bays from 1942 to 1992, with no data collected from 1943 to 1944 and 1956 to 1965. Recruitment monitoring historically occurred at two sites in Quilcene Bay and four sites in Dabob Bay. Pacific oyster shells were used as a consistent substratum for recruitment monitoring. Scientists examined shells in mesh bags, shells strung on wires hanging from floats at the water surface and shells stacked on the substratum in low inter-tidal zones. Shells were not placed for recruitment monitoring until larval sampling showed well-developed larvae of Pacific oysters that were ready to metamorphose into spat. Consequently, the timing and duration of recruitment monitoring differed by year but always spanned the full period of Pacific oyster recruitment. Three standardization methods were required to evaluate each year's recruitment in a common currency, which was the total number of Pacific oysters recruiting to the smooth inner, side of one shell (shellface). First, collections in which spat were counted on both sides of the shell (23 years) were reduced to 0.3752 of that count. We were able to make this standardization because shellfaces have a consistent relationship to total recruitment (spat on shellface = 0.3752 [total spat count], R2 = .94, N = 628 from 1946, 1966–1975, 1977–1992, Figure S1). Second, we needed to standardize for search effort, as spat were counted under microscopes on between one and 25 shells at each collection. This standardization involved calculating the average number of spat per shellface. Finally, shells were collected and replaced with clean shells several times in a summer. To determine each year's recruitment, spat per shellface in each sequential time period was summed together (“seasonal”). We note that we were unable to standardize for differences in shell area because shells come in different shapes and sizes. However, this variability in area may be a factor of two and reduced when multiple shells were examined each year; recruitment variability far exceeded this natural variability in shell area. Olympia oysters were not quantified (or even mentioned) as either larvae or recruits in the historic Oyster Bulletins. However, Olympia oysters were present in great numbers in Hood Canal in the late 19th century, at a time when state reserves were established to aid commercial use (Kincaid, 1920).
2.3 Oyster recruitment 2013–2015
Oyster recruitment was measured on the shellfaces of flat valves of Pacific oyster shells (each ~50 cm2). These were drilled and stacked in groups of 10 with downward-facing shellfaces on a wooden dowel (shellstick). The dowel was inserted into the sediment near MLLW so that the oysters rested on the bottom. Shellsticks were initially placed each summer before June and replaced every 2 weeks during extreme low tides until September, a total duration expected to include both Olympia and Pacific oyster recruitment. Seven exchanges were made in 2013 and 2014, and six in 2015. Our operational definition of recruitment is the appearance of newly metamorphosed oysters on a consistent settlement substratum within 2 weeks. Upon collection, shellfaces were examined under a dissecting microscope (10×) for oyster spat. Each spat was identified as C. gigas, O. lurida or other bivalves by morphological characteristics, especially the twisted umbo of C. gigas in comparison to the symmetric umbo of O. lurida (Trimble et al., 2009).
Temperatures were recorded at 1-hr intervals at Belfair in all 3 years (iButton temperature loggers, Dallas Semiconductor) and at Dabob in 2014 and 2015. Each iButton sensor was coated in waterproof epoxy and anchored near MLLW on the tideflat. Air temperatures were censored by eliminating records from the 4-hr window around each extreme low tide, and the remaining temperatures were averaged on a daily basis for a record of daily inter-tidal water temperature. The methods for measuring water temperature in 2013–2015 differ from historic point samples and thermograph data, so no effort is made to link temperature-recruitment relationships in the two periods of this study. However, these logging sensors are suitable to examine within-year and between-region variability in temperature.
2.4 Data analysis
Historic water temperatures were examined for warming in July/August, when Pacific oyster larvae would be present, and also over the longer season of June to September when water temperatures were recorded during sampling. A regression approach was taken to examine water temperature as a function of year, using all daily data from July/August and annual mean temperature during these 2 months. Effectively, using daily temperature weights each year by sample size, whereas annual means do not. In addition to testing for long-term warming trends, we calculated metrics of inter- and intra-annual variation in temperature. Daily temperatures collected in July and August were used to determine an annual mean (used in regression above) and standard deviation. Inter-annual variability was then based on the variability in these annual means, whereas intra-annual variability was based on the mean of the standard deviations.
Water temperature data from 1 June to 30 September covered an extended summer period that spanned most of the available records, improved our capacity to test for warming beyond July/August and incorporated seasonality relevant to gametogenesis and spawning cues. In a linear model approach, predictors were day of year as both first- and second-order functions to account for potential seasonal variation in water temperature, and year to evaluate inter-annual trends.
Historic recruitment of Pacific oysters was examined for temporal trends in seasonal recruitment. Recruitment (log-transformed) was the response variable and year the predictor variable, with sites included separately as samples. Recruitment was further examined with respect to inter-annual variability in temperature, first calculating the average recruitment across sites in each year, then relating recruitment (log-transformed) to the average July/August water temperature as a predictor.
For modern data from Hood Canal, we separately evaluated the timing and magnitude of oyster recruitment. Timing of each oyster species was scored by site for first recruitment, which was the day of year when the shellstick was collected with more than one recruit per shellface, and peak recruitment, which was the day of year when a shellstick was collected with maximum recruitment per shellface. These two response variables were tested by linear mixed-effects analyses with species, region and their interaction as fixed effects, and year (2014, 2015) as a random effect. Only 2014–2015 had data suitable for this analysis when main stem Hood Canal had multiple sampling sites and lower Hood Canal showed recruitment sufficient to evaluate timing.
For analysis of the magnitude of recruitment, seasonal recruitment was determined for each site from the sum of the settlement in each 2-week increment throughout each summer, standardized as spat per shellface [log(x + 0.1)-transformed]. A linear model was developed in which recruitment magnitude was related to main effects of species, regions and years (2013, 2014, 2015), as well as two-factor interactions addressing whether the oyster species shared spatial (species × region) or temporal (species × year) recruitment variability, and whether recruitment was regionally consistent (year × region). To determine the importance of these variables, we took a model selection approach, including a null model with no predictors, three-two-factor interactions (as above) and all possible subsets, with interactions among factors included only when main effects were also in the model. This suite of 18 possible linear models was compared by Akaike's Information Criterion, adjusted for small sample size, which penalizes more complex models (Burnham & Anderson, 2002). Results are presented in terms of the importance of each predictor, which uses Akaike weights to construct a 95% confidence set of models, dropping the least likely models from the full set. Parameter importance is the sum of model weights across all models in the 95% confidence set in which the parameter appears (Burnham & Anderson, 2002). Statistical analyses were carried out with nlme (Pinheiro, Bates, DebRoy, & Sarkar, 2016) and Multimodel Inference packages (MuMIn; Barton, 2015) in R (R Core Team, 2015).
3 RESULTS
3.1 Historic recruitment of Pacific oysters in main stem Hood Canal
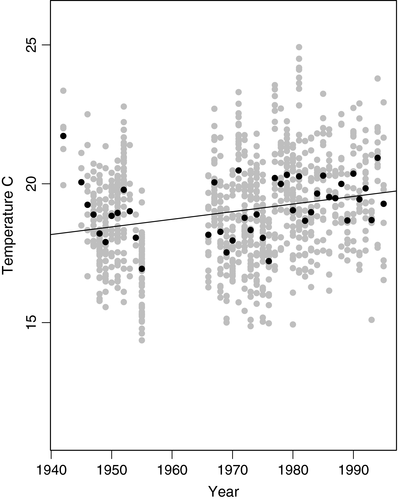
Surface water temperatures in Dabob and Quilcene Bays warmed from 1942 to 1995, although the estimated rate of warming was somewhat sensitive to which data were evaluated. Based on July and August daily temperatures, water warmed 0.0278°C per year (SE: 0.0037, t = 7.5, p < .0001, N = 993, Figure 2). Averaging across these daily temperatures by year, water warmed similarly from 1945 to 1995 (0.023°C per year, SE: 0.009, t = 2.44, p = .019, N = 41), but without significant warming if the earliest 1942 record was included (0.0135°C per year, SE: 0.0099, t = 1.36, p = .18, N = 42, Figure 2), Water temperatures were substantially more variable within than across years, even for the warmest months of July and August: the within-year standard deviation was 1.436°C, compared to among-year standard deviation of 1.041°C. Including temperatures measured in June through September, the intra-annual pattern had a second-order component due to the warmest days occurring in late July to early August, and the warming trend was 0.026°C per year (Figure 3, Table S1).
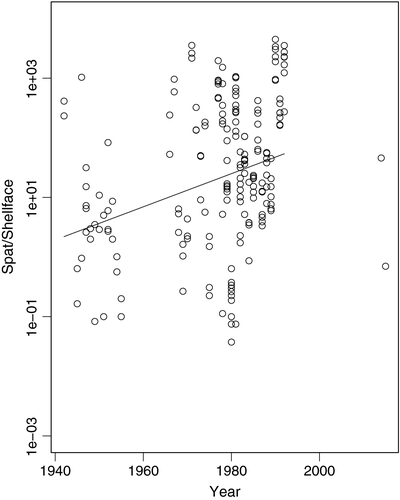
Crassostrea gigas recruitment increased from 1942 to 1992 in main stem Hood Canal (0.0275 ± 0.006 log-spat per year [±SE], t = 4.36, p < .0001, N = 195, Figure 4), at an annual increase of 7% per year. This trend persisted but without statistical significance when sites were averaged within year (0.0188 ± 0.0102 SE, t = 1.83, p = .075, N = 38). Recruitment of C. gigas correlates strongly with July/August average temperature (Figure 5, t = 5.076, p < .0001, N = 38), increasing by 0.7774 log-spat (SE 0.153) with each °C, or a factor of 6 increase per °C.

3.2 Recent recruitment of Olympia and Pacific oysters in main stem and lower Hood Canal
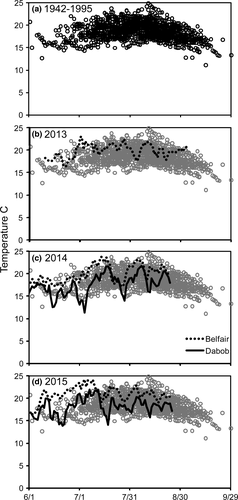
In the modern temperature record, main stem and lower Hood Canal shared short-term variability in temperature, given high regional correlation of daily temperatures (r = .68 in 2014, 0.54 in 2015). Despite shared temporal variability, the main stem inter-tidal site was covered by water that was consistently ~2.6°C cooler than lower Hood Canal (Figure 3). Temperatures for Dabob from 2013 to 2015 fit within the observed historic temperatures (Figure 3), but for Belfair were often warmer. The high short-term variability resulted in modern daily temperatures reaching both the lower and upper edges of the historic records during the monitoring period (Figure 3). Inter-tidal water temperatures were recorded to vary by as much as 6°C over just a few days.
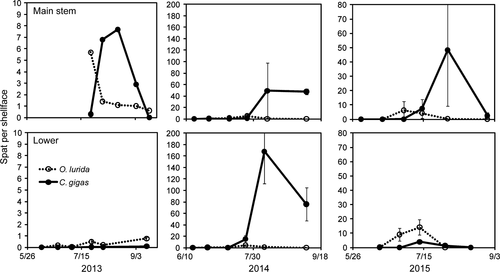
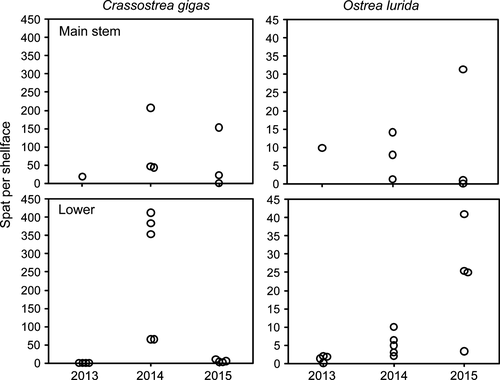
Native Olympia oysters recruited earlier than introduced Pacific oysters, but only when considering the date of peak recruitment (2 weeks earlier); first recruitment showed a similar trend but without statistical significance (Figure 6, Table S2). Regarding the magnitude of recruitment, oyster species, year and their interaction appeared in all top models, which reflects that overall O. lurida were as low as 3% of spat in 2014, but near 40% in the other 2 years (Figure 7, Table S3). The region × year interaction had a parameter weight of 0.69: combined recruitment of the two species in lower Hood Canal was more than twice that of main stem in 2014, a pattern that was reversed in other years (Figure 7, Table S3).
4 DISCUSSION
Although warming temperatures have been suggested to foster invasion of C. gigas (Diederich et al., 2005; Dutertre et al., 2010; Jones et al., 2013; Philippart et al., 2014; Wrange et al., 2010), to our knowledge this is the first quantitative demonstration in the field of recruitment dynamics linked to warming. Crassostrea gigas provides a clear signal of a biological imprint of climate change. Not only does settlement vary consistently with summer water temperature, but it has also followed an increasing trend as average water temperature increased by 0.28°C per decade in Hood Canal.
For comparative purposes of thermal trends, water temperature at the Race Rocks lighthouse (Vancouver Island, British Columbia, Canada) about 100 km northwest of Hood Canal increased 0.9°C over four decades (~1970 to ~2010, or 0.23°C per decade; Elahi, Birkeland, Sebens, Turner, & Dwyer, 2013). Both data sets are consistent with warming ocean water globally (Burrows et al., 2011). However, warming contributed a small portion of the total temperature variability in our observations. Within-year variation was substantial (Figures 2 and 3), which is a feature expected from physical aspects of Hood Canal. Water stratifies in summer, related to the relatively small surface area to volume, but this stratification can be disrupted by weather patterns and winds. When mixing occurs, deep, cold, low-oxygen water comes to the surface. Low temperatures, as well as chemical properties of the water, could be stressful to oyster larvae. We were not able to examine larval mortality or settlement in relation to these short-term (within-summer) events, but they are likely to cause environmental correlations to depart from a simple relationship between recruitment and average temperature.
Despite water temperature varying at daily to inter-annual temporal scales, we found consistently warmer inter-tidal water temperatures at Belfair than Dabob Bay. This distinction in temperature between the two regions mirrors other water properties that also differ. In summer, dissolved oxygen is higher in main stem (5.5–7.5 mg/L) than lower Hood Canal (2.5–4.5 mg/L; Warner, Kawase, & Newton, 2001). Salinity is also higher in main stem (28–30 PSU) than lower Hood Canal (24–28 PSU), in addition to increasing at depth (Kawase & Bang, 2013; Moore, Mantua, Kellogg, & Newton, 2008). Long residence time and naturally occurring low-oxygen contribute to Hood Canal having a high overall eutrophication risk (Bricker et al., 2007). However, eutrophication itself has been difficult to resolve because of high loading from marine nitrogen and estimates of anthropogenic contributions that seem small (0.5%, Steinberg et al., 2011). Oyster production in Hood Canal has been predicted to increase with nitrogen loading and to be rather insensitive to warming temperatures, but this analysis was based on an assumption that all oysters were planted and did not address recruitment variability (Toft et al., 2014). Our results indicate that through much of the 20th century, inputs to wild populations of Pacific oysters in Hood Canal used by recreational and Tribal harvesters were on the rise, coincident with warming (Figures 2 and 4).
Much of the ecological attention paid to Hood Canal stems from dissolved oxygen shaping the behavior and distribution of species and therefore structure of communities. Sensitive zooplankton move out of hypoxic bottom water, which is chronic in lower Hood Canal (Keister & Tuttle, 2013). The higher-oxygen site for Keister and Tuttle (2013) was studied in comparison to still more normoxic sites outside Hood Canal by Essington and Paulsen (2010), who found depauperate fish communities at 30–100 m depth in Hood Canal. Mobile benthic species differed among sites and among depths from 10 to 30 m, comparing “south” and “north” within the southern region of main stem Hood Canal (Froehlich, Hennessey, Essington, Beaudreau, & Levin, 2015). Geoduck clams surveyed at 21 m and shallower at 87 sites throughout Hood Canal decreased in density into Hood Canal where dissolved oxygen could be stressful (McDonald et al., 2015). In aggregate, these recent studies have a shared result in which hypoxia-sensitive species drop out of communities with depth and distance into Hood Canal. The oysters that we studied contrast in some regards because inter-tidal adults are unlikely to experience hypoxia, yet larval exposure could depend on mixing events during short time windows.
Among estuaries regionally, warmer temperatures appear to promote successful Pacific oyster recruitment, judging by the frequency of commercially viable sets exceeding three spat per shell (Kincaid, 1968). Most estuaries are too cool for any but sporadic recruitment of Pacific oysters, whereas in Willapa Bay, with water temperatures generally below 18°C, the percentage of years with commercial sets was 59% (35 of 59 records from 1942 to 2000, Dumbauld et al., 2011). At the warm end, with water temperatures generally above 21°C, 95% of years (N = 20) between 1942 and 1965 had commercial sets in Pendrell Sound (Valdez, Gross, & Ruesink, 2014). Hood Canal water temperatures are in between Willapa Bay and Pendrell Sound in summer, and the likelihood of commercial spatfall was also intermediate. Of 38 years with measured recruitment, 32 exceeded 1.5 spat per shellface (84%) or 28 exceeded 3 spat per shellface (74%; Figure 4). Yet, within Hood Canal in 2013–2015, the consistently warmer water of lower Hood Canal did not always result in better recruitment of either oyster species (Figure 7). In fact, substantial variation in the relative magnitude of recruitment among regions and oyster species, differing in each year (Table S3), remains to be explained.
In many cases in which recruitment has been studied simultaneously across bays, a coherent signal emerges, which is generally attributed to a regional-scale climatic driver (Philippart et al., 2012; Kimmel et al., 2014 for bivalves; Taylor et al., 2010; Reum et al., 2011 for fish). Shared recruitment patterns may also reflect larval delivery, as in mussels and barnacles along coastlines where upwelling strength governs the onshore or offshore transport of larvae (Broitman et al., 2008; Pfaff, Branch, Wieters, Branch, & Broitman, 2011). Trends in recruitment along estuarine gradients emerge for some species in some places (Ruesink et al., 2014; Taylor et al., 2010) but were not a feature of the spatial variation of oyster recruitment in Hood Canal. Because neither region was consistently better in terms of recruitment, the two regions appear decoupled in terms of shifting their relative suitability for demographic processes underlying recruitment (Table S3). This decoupling in oyster recruitment between main stem and lower Hood Canal has important implications for management, given that such situations promote a portfolio of recruitment sites that even out high variability at any particular site (Schindler et al., 2010). Whereas recruitment magnitude showed little consistent pattern among regions or species, the relative timing between the two species is consistent with thermal biology as O. lurida undergoes gametogenesis at lower temperatures than C. gigas (Baker, 1995; Ben Kheder et al., 2010). Spatial variation in the timing of recruitment would also be expected, given warmer temperatures in lower than main stem Hood Canal (Figure 3). A trend towards earlier recruitment in lower than main stem Hood Canal appeared for both species but was not statistically significant in 2014–2015 (Table S2).
Olympia oysters represented about 10% of all oyster spat recorded in 2013–2015, and the absence of reports of this species in historic Oyster Bulletins does not seem sufficient evidence to characterize any biological trend over the recent past. Undoubtedly Olympia oysters remain at a lower abundance in Hood Canal than prior to Euro-American exploitation in the mid-1800s. At the same time, appearance of new recruits of Olympia oysters at all sites suggests the importance of restoring habitat, which generally requires hard substratum for recruitment in moist or submerged areas where water protects the oysters from temperature extremes, rather than needing to enhance broodstock by outplanting oysters. Predators may also restrict Olympia oyster recovery (Valdez et al., 2016; Wasson et al., 2015). In the comparison of native and non-native oysters, from the relative positions of their thermal performance curves, we expect warming temperatures to favor the non-native, whose optimal temperature appears still higher than currently occurs in summer in Hood Canal. Particularly because of water quality issues of dissolved oxygen and pH, it seems prudent to keep in mind that drivers of oyster recruitment in the past (temperature) may not be as important as other issues in the future, a feature that frequently plagues interpretation of ecological time series (Myers, 1998).
ACKNOWLEDGEMENTS
Funding for this project was provided in part by National Oceanic and Atmospheric Administration Restoration Center through a partnership with The Nature Conservancy (Project number GMP-PSRF-052413) to Puget Sound Restoration Fund. Recruitment monitoring was carried out through collaborations with the Skokomish and Port Gamble S'klallam Tribes, Hama Hama Oyster Company, Taylor Shellfish Company and citizen scientists (D. Hansen, J. Sundsten, R. Price and the Loves). We appreciate access to Belfair and Twanoh State Parks (permit number 140602) and Mason County tideflats. The historic analyses would have been impossible without the meticulous and dedicated work of many state biologists over many years.


