Ecological aspects of fin whale and humpback whale distribution during summer in the Norwegian Sea
Abstract
The Norwegian Sea is a migration and feeding ground for fin whales (Balaenoptera physalus) and humpback whales (Megaptera novaeangliae) in summer. During the last decade, significant structural changes in the prey community, including northerly expansion and movement in the distribution of pelagic fish species, have been reported from this ecosystem. However, little information on whale feeding ecology exists in the Norwegian Sea and surrounding waters. A total of 59 fin whales and 48 humpback whales were sighted during 864 h of observation over an observation distance of about 8200 nmi (15,200 km) in the Norwegian Sea from 15 July to 6 August 2006 and 2007. The fin whale group size, as mean (±SD), varied between one and five individuals (2.1 ± 1.2 ind.) and humpback whale group size varied between one and six individuals (2.5 ± 1.7 ind.). Fin- and humpback whales were observed mainly in the northern part of the study area, and were only found correlated with the presence of macro-zooplankton in cold Arctic water. Humpback whales were not correlated with the occurrence of adult Norwegian spring-spawning herring (Clupea harengus) except for the northernmost areas. Despite changes in the whale prey communities in the Norwegian Sea, no apparent changes in fin- or humpback whale distribution pattern could be found in our study compared to their observed summer distribution 10–15 years ago.
Introduction
The fin whale (Balaenoptera physalus) and humpback whale (Megaptera novaeangliae) abundances in the Norwegian Sea appear to have been stable over the last 15 years, with some indications of increases (Pike et al. 2005; Øien 2006). The Norwegian Sea is an important feeding ground and migration corridor for baleen whales during summer (Nøttestad & Olsen 2004), including approximately 5000–6000 fin whales and, by including the Barents Sea, about 1000 humpback whales (Christensen et al. 1992; Øien 1995, 2003, 2007).
Krill (Meganyctiphanes norvegica) and amphipods have dominated the fin whale diet in the Norwegian Sea (Jonsgård 1966). Elements of pelagic, schooling fish such as Norwegian spring-spawning (NSS) herring (Clupea harengus), blue whiting (Micromersitius poutassou) and capelin (Mallotus villosus) have also been common in the diet of fin whales within this region (Jonsgård 1966; Nøttestad et al. 2002b; Nøttestad & Olsen 2004). Sightings of humpback whales in the Norwegian Sea are often associated with high concentrations of NSS herring and capelin (Ingebrigten 1929; Christensen et al. 1992; Øien 2007). The humpback whale is generally regarded as being more opportunistic in its prey choice than are fin whales (Aguilar 2002, 2009; Clapham 2009).
During the last decade, the highly productive Norwegian Sea has experienced increased anthropogenic activity (fishing activity, seismic surveys, oil and gas extraction) (Gjøsæter et al. 2010), increased water temperature (ICES 2010a,b), a shift in timing of the phytoplankton bloom (Rey 2004), declining silicate concentrations (Rey 2011) and a decrease in the general zooplankton biomass with elements of more thermophilic species (Huse et al. 2012). Changes in some of the most important commercial pelagic fish species’ stock density, biomass distribution, and shifts in cohort strengths have also been recorded, including Northeast Atlantic mackerel (ICES 2011; Utne et al. 2012), Norwegian spring-spawning herring (Skjoldal 2004; ICES 2011), blue whiting (ICES 2010b) and capelin in the Iceland East Greenland Jan Mayen waters (Vilhjálmsson 2002).
Very few studies in the Northeast Atlantic have compared the distribution of large baleen whales with prevailing physical and biological factors. The shifts in prey species’ composition and the distribution of fin- and humpback whales may consequently have changed the prey composition and distribution of these whales. The main objective of this study was to correlate statistically the sightings of fin- and humpback whales in the Norwegian Sea, and relate them to temperature, water masses and the potential prey distribution of pelagic fish and zooplankton.
Material and Methods
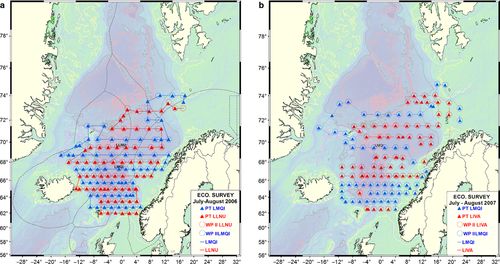
Two coordinated cruises were undertaken in the Norwegian Sea from 15 July to 6 August in 2006 and 2007, along predefined and preselected survey lines (Fig. 1a,b). The well equipped vessels M/V Libas (2006 and 2007), M/V Endre Dyrøy (2006), and M/V Eros (2007) were chartered for the scientific surveys.
Marine mammal sightings were made by two whale observers on each vessel along the survey tracks during daylight hours (about 10–12 h per day), and a total of around 864 h (8200 nmi) were spent observing. Sightings were made mostly from a platform at the wheelhouse rooftop (11–15 m height depending on vessel) whenever weather permitted (Beaufort <4 and no or moderate rain). The sightings were otherwise made from the bridge at 10 knots along transects and during transit between transects; however, no recordings were made while trawling. Observations were made using the TNASS observation regime (Palka & Hammond 2001; Lawson & Gosselin 2009). A sighting was noted on the basis of direct observation with the naked eye and binoculars, and was documented with digital video-recordings and photographs. Both passing and closing mode were applied during sightings of large baleen whales. In a passing mode, the ship moves continuously along a transect line, whereas in a closing mode, the ship stops normal searching procedures once a group of cetaceans is sighted (goes ‘off-effort’), leaves the transect line and approaches the sighted group to identify the species and stock composition of the group and to make reliable estimates of group size (Schwartz et al. 2010). Whenever sighting distance was closer than approximately 1 nmi (~1.8 km) we used a closing mode to better study their ecology in greater detail. Multibeam sonar was occasionally used to get an overview of prey patches in relation to whale locations. Behavior was categorized as feeding when the whales displayed slow swimming speed and remained stationary within a confined area with bouts of short and regular dives in the presence of prey. Potential prey species detected at the closest distance either by the acoustics and/or trawl and net samples were used in addition to association with seabirds.
Conductivity temperature depth (CTD – SAIV) casts were made at 252 stations, with about 60 nmi (~110 km) distance between biological and oceanographic sampling stations along the survey line from the surface to 500 m depth. The water masses were divided into three different categories on the basis of the CTD casts: coastal water (warm and steep temperature profile, with salinity at 20 m < 35), Atlantic water (gradually changing temperature profile, with salinity at 20 m ≥ 35), and Arctic water (cold and steep temperature profile, with salinity at 20 m < 35) in line with Blindheim (2004) and Langøy et al. (2012).
A total of 252 trawl stations (n = 125 in 2006 and n = 127 in 2007) were made at predetermined positions (Fig. 1a,b). Trawl depths ranged from 3 to 60 m using a commercial blue whiting pelagic trawl (Egersund). The warp length was 200–220 m, the width between wings ranged between 45 and 63 m, the vertical opening was 50 m, and the mesh size was 35–80 mm in the cod-end. Towing speed was 4.0–5.3 knots and towing duration was standardized to 30 min. Towing distance during trawling varied between 3.7 and 4.9 km. Macro-zooplankton such as adult krill and amphipods are generally too small for the meshes of the Egersund trawl and too large to be caught by the WP2 net (see below). A net with a smaller mesh size (Capelin net, 16 mm cod-end) was therefore placed inside the trawl mouth to catch macro-zooplankton at a few selected stations (see Fig. 1).
Micro- and meso-zooplankton were sampled at each pelagic trawl station using a WP2 net with a diameter of 56 cm and a mesh size of 180 μm. A total of 124 WP2 vertical hauls (200–0 m) were carried out in 2006 and 116 in 2007. Only the stations closest to whale sightings were used in the statistical analyses. Zooplankton biomass was calculated using the methods described in Gjøsæter et al. (2000), where sampled volume from the 0 to 200 m vertical hauls is calculated and then transformed to the surface (m2) and related to total dry weight of zooplankton as g·m−2.
All three vessels were equipped with two types of fishery sonar: a medium-range sonar (Simrad SH 80, 110–122 kHz) and a long-range sonar (Simrad SP 90/SP70, 20–30 kHz). The multibeam sonars were used to detect and count fish schools, krill and amphipods on the basis of acoustic signatures, dynamics and trawl samples. Marine mammal counts and documentation of behavior were also carried out using the sonars. The two sonars were used simultaneously and logged data continuously in areas coinciding with whale sightings, using a ‘Scientific Output’ through an Ethernet connection to identify and sample fish schools along the entire cruise track.
Acoustic recordings were also made at frequencies of 38 and 200 kHz as a minimum with a Simrad EK60 echosounder down to 500 m depth, using standard settings. The acoustic equipment was pre-calibrated following the standard hydro-acoustic calibration procedure for each frequency (Foote 1982, 1987). Analysis and species allocation were performed using the LARGE SCALE SURVEY SYSTEM (LSSS) (Korneliussen 2006). This post-processing software program can be used to identify fish and plankton species on the basis of multi-frequency acoustic signatures and strength.
The relationship between fin- and humpback whales and pelagic fish was studied using Pearson's product-moment correlation test with the software R (e.g. Maindonald & Braun 2003; Corder & Foreman 2009). A general linear model (GLM, SAS Institute) was used to test the relationship between group sizes of whales and zooplankton biomass. The 0.05 level of probability was accepted as indicating statistical significance and all mean values are shown ±standard deviations.
Results
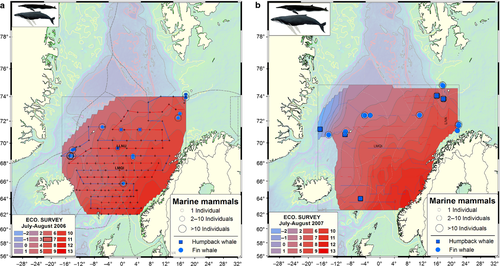
Sub-surface temperatures at 10 m water-depth ranged from 15 to 16 °C in the coastal water of Norway to 2–4 °C in the Arctic water masses around Jan Mayen and −0.2 to 2.0 °C in the Greenland Sea close to the ice edge both years (Fig. 2a,b). The temperature in the central Atlantic water masses ranged from 10 to 14 °C. Salinity varied from 28.5 to 35.0 psu within the study area. The surface temperatures in the Norwegian Sea were generally warmer during summer 2007 than in the same period in 2006 (Fig. 2a,b).
The wind speed was mostly 0–3 (Beaufort scale) and only occasionally (lasting < 24 h) reached 4 (Beaufort scale), so conditions were predominantly favorable for visual sightings. Visibility with the naked eye ranged between about 1000 m and >10,000 m (distance measured by radar). Low precipitation and cloud cover also provided good visibility throughout the cruises. Fog and fogbanks were occasionally experienced in the westernmost area into the Greenland Sea, south of Jan Mayen and around Bear Island (100–1000 m).
A combined total of 26 observations of 56 fin whales (Table 1) and 16 observations of 35 humpback whales (Table 2) were recorded over 41 days in both the summers of 2006 and 2007. Group size for fin whales varied between one and five individuals with an average group size of 2.1 ± 1.2 animals. Humpback whale group size varied between one and six animals with an average group size of 2.5 ± 1.7 animals. Both fin- and humpback whales were distributed in the northernmost part of the study area, in Arctic water masses and the colder parts of Atlantic water masses (Tables 1 and 2). In 2007, both whale species were more or less confined to the northeast and northwest, with the highest concentration of fin whales observed southwest of Bear Island and west of the island Jan Mayen (Fig. 2).
| Vessel (name) | Station (number) | Date (dmy) | Time (UTC) | Whales (n) | Latitude (°N) | Longitude (°E + °W -) | Temp (°C) | Sal (psu) | Water mass (defined) | Mackerel (kg) | Herring (kg) | Blue whiting (kg) | Krill/amphipods |
|---|---|---|---|---|---|---|---|---|---|---|---|---|---|
| Libas | 18 | 20.07.2006 | 4:40 | 3 | 65.76 | 0.14 | 9.73 | 34.95 | Atlantic | 60.0 | 0.7 | 0.0 | Present |
| Libas | 18 | 20.07.2006 | 4:40 | 1 | 65.76 | 0.14 | 9.73 | 34.95 | Atlantic | 60.0 | 0.7 | 0.0 | Present |
| Libas | 19 | 20.07.2006 | 5:30 | 2 | 65.77 | 0.12 | 9.44 | 34.84 | Atlantic | 0.0 | 0.0 | 25.0 | Absent |
| Libas | 19 | 20.07.2006 | 6:45 | 1 | 68.75 | 2.78 | 9.44 | 34.84 | Atlantic | 0.0 | 0.0 | 25.0 | Present |
| Libas | 42 | 27.07.2006 | 9:30 | 1 | 68.77 | 0.12 | 10.20 | 35.20 | Atlantic | 32.4 | 0.7 | 0.0 | Absent |
| Libas | 42 | 27.07.2006 | 9:42 | 2 | 68.58 | 2.80 | 10.20 | 35.20 | Atlantic | 32.7 | 0.7 | 0.0 | Absent |
| Libas | 47 | 28.07.2006 | 23:10 | 3 | 68.73 | −14.10 | 6.03 | 34.58 | Arctic | 0.0 | 0.7 | 1000.0 | Present |
| Libas | 48 | 29.07.2006 | 0:08 | 1 | 68.72 | −14.68 | 6.03 | 34.58 | Arctic | 1.0 | 0.0 | 0.0 | Present |
| Libas | 48 | 29.07.2006 | 0:40 | 5 | 68.75 | −14.75 | 6.03 | 34.58 | Arctic | 1.0 | 0.0 | 0.0 | Present |
| Libas | 50 | 29.07.2006 | 14:58 | 3 | 69.32 | −14.10 | 6.45 | 34.60 | Arctic | 2.2 | 0.0 | 0.0 | Present |
| Libas | 54 | 30.07.2006 | 20:05 | 4 | 71.48 | −5.76 | 6.83 | 34.57 | Arctic | 0.0 | 250.0 | 0.0 | Present |
| Libas | 64 | 04.08.2006 | 13:54 | 1 | 72.28 | 15.42 | 6.86 | 34.96 | Atlantic | 0.0 | 4000.0 | 0.0 | Absent |
| Libas | 64 | 04.08.2006 | 14:02 | 2 | 72.27 | 15.39 | 6.86 | 34.96 | Atlantic | 0.0 | 4000.0 | 0.0 | Absent |
| Libas | 64 | 04.08.2006 | 12:00 | 1 | 72.63 | 15.92 | 6.86 | 34.96 | Atlantic | 0.0 | 4000.0 | 0.0 | Absent |
| Libas | 44 | 28.07.2007 | 19:31 | 1 | 71.03 | −9.67 | 6.59 | 34.84 | Arctic | 0.0 | 0.0 | 11.6 | Present |
| Libas | 45 | 29.07.2007 | 8:10 | 2 | 70.75 | −14.35 | 6.08 | 34.82 | Arctic | 0.0 | 0.0 | 0.5 | Present |
| Libas | 50 | 31.07.2007 | 9:57 | 1 | 72.47 | −4.63 | 6.20 | 34.53 | Arctic | 0.0 | 0.0 | 0.0 | Present |
| Libas | 50 | 31.07.2007 | 11:10 | 5 | 72.47 | −4.25 | 6.20 | 34.53 | Arctic | 0.0 | 0.0 | 0.0 | Present |
| Libas | 51 | 31.07.2007 | 19:00 | 1 | 72.48 | −2.75 | 6.60 | 34.90 | Atlantic | 0.0 | 800.0 | 0.0 | Absent |
| Libas | 56 | 02.08.2007 | 13:30 | 2 | 72.50 | 11.00 | 9.60 | 34.71 | Atlantic | 0.0 | 0.0 | 0.0 | Absent |
| Libas | 57 | 03.08.2007 | 2:57 | 3 | 74.85 | 17.35 | 10.69 | 34.59 | Atlantic | 0.0 | 0.0 | 0.0 | Absent |
| Libas | 57 | 03.08.2007 | 5:00 | 2 | 74.82 | 17.52 | 10.69 | 34.59 | Atlantic | 0.0 | 0.0 | 0.0 | Absent |
| Libas | 61 | 05.08.2007 | 7:15 | 3 | 71.70 | 21.92 | 10.89 | 34.87 | Atlantic | 0.0 | 0.2 | 0.0 | Present |
| Libas | 61 | 05.08.2007 | 8:01 | 2 | 71.58 | 21.85 | 10.89 | 34.87 | Atlantic | 0.0 | 0.2 | 0.0 | Present |
| Libas | 61 | 05.08.2007 | 13:50 | 1 | 71.13 | 21.53 | 10.89 | 34.87 | Atlantic | 0.0 | 0.2 | 0.0 | Present |
| Eros | 66 | 03.08.2007 | 11:36 | 1 | 74.19 | 16.15 | 8.661 | 35.11 | Atlantic | 0.0 | 0.2 | 0.0 | Absent |
| Vessel (name) | Station (number) | Date (dmy) | Time (UTC) | Whales (n) | Latitude (°N) | Longitude (°E+°W-) | Temp (°C) | Sal (psu) | Water mass | Mackerel (kg) | Herring (kg) | Blue whiting (kg) | Krill/Amphipods |
|---|---|---|---|---|---|---|---|---|---|---|---|---|---|
| Libas | 46 | 28.07.2006 | 17:20 | 2 | 68.73 | −14.10 | 6.58 | 34.81 | Arctic | 0.0 | 450.0 | 50.0 | Present |
| Libas | 47 | 28.07.2006 | 23:10 | 1 | 68.72 | −11.97 | 6.58 | 34.81 | Arctic | 0.0 | 0.7 | 1000.0 | Present |
| Libas | 48 | 29.07.2006 | 0:08 | 1 | 68.72 | −14.68 | 6.03 | 34.58 | Arctic | 1.0 | 0.0 | 0.0 | Present |
| Libas | 48 | 29.07.2006 | 0:20 | 6 | 68.72 | −14.75 | 6.03 | 34.58 | Arctic | 1.0 | 0.0 | 0.0 | Present |
| Libas | 49 | 29.07.2006 | 3:25 | 1 | 68.75 | −15.48 | 5.00 | 34.28 | Arctic | 2.3 | 0.0 | 0.0 | Present |
| Libas | 50 | 29.07.2006 | 14:58 | 1 | 69.32 | −14.10 | 6.45 | 34.60 | Arctic | 2.2 | 0.0 | 0.0 | Present |
| Libas | 50 | 29.07.2006 | 23:20 | 4 | 68.77 | −14.68 | 6.45 | 34.60 | Arctic | 2.2 | 0.0 | 0.0 | Present |
| Libas | 64 | 04.08.2006 | 3:00 | 5 | 74.17 | 17.52 | 7.25 | 35.03 | Atlantic | 0.0 | 4000.0 | 10.0 | Present |
| Libas | 64 | 04.08.2006 | 5:24 | 2 | 73.92 | 17.52 | 7.25 | 35.03 | Atlantic | 0.0 | 4000.0 | 10.0 | Present |
| E. Dyrøy | 50 | 29.07.2006 | 19:00 | 1 | 69.50 | −1.50 | 9.03 | 34.92 | Atlantic | 76.4 | 3.6 | 0.0 | Absent |
| E. Dyrøy | 57 | 01.08.2006 | 2:10 | 1 | 71.25 | 4.72 | 9.04 | 34.94 | Atlantic | 0.0 | 200.0 | 0.0 | Absent |
| E. Dyrøy | 58 | 01.08.2006 | 12:50 | 1 | 71.25 | −0.53 | 9.101 | 34.95 | Atlantic | 0.0 | 10.3 | 0.0 | Absent |
| Libas | 44 | 28.07.2007 | 14:50 | 1 | 70.80 | −9.78 | 6.59 | 34.84 | Arctic | 0.0 | 0.0 | 11.6 | Absent |
| Libas | 46 | 29.07.2007 | 21:50 | 1 | 71.27 | −16.75 | −0.68 | 30.45 | Arctic | 0.0 | 0.0 | 0.0 | Absent |
| Libas | 57 | 03.08.2007 | 16:40 | 4 | 73.48 | 17.40 | 10.69 | 34.59 | Atlantic | 0.0 | 0.0 | 0.0 | Absent |
| Libas | 58 | 03.08.2007 | 08:00 | 3 | 73.80 | 17.67 | 8.03 | 34.99 | Atlantic | 0.0 | 0.0 | 0.0 | Present |
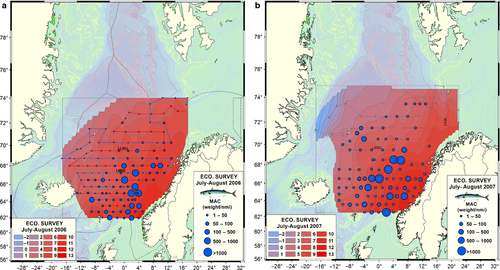
Herring was predominantly recorded in the upper 50 m of the water column, and occasionally deeper, with a maximum of 150 m depth, based on systematic and continuous echosounder recordings both years. Herring distributions, shown as scrutinized sa values every 5 nmi in 2006 and 2007, are shown in Fig. 3(a,b). Mackerel distributions, shown as catch rates (kg·nmi−1) in 2006 and 2007, are shown in Fig. 4(a,b). School sizes ranged from approximately 100 kg to 20 tons. Adult herring was mostly present in the outskirt of the study area, with the highest biomass concentrations in the southwest and west (Fig. 5a,b), whereas mackerel was mostly distributed in the central part of the Norwegian Sea (Fig. 3a,b). The majority of large-sized herring were confined to the northeastern and northwestern parts of the region. The sonar recordings estimated roughly more than 130,000 tons of herring and 30,000 tons of mackerel along the cruise track onboard the M/V Libas in 2006 (Fig. 4).
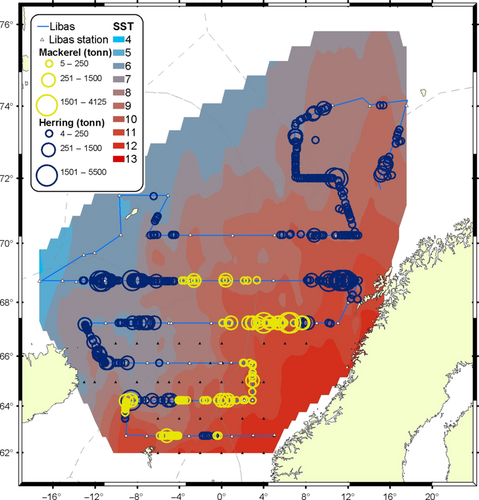
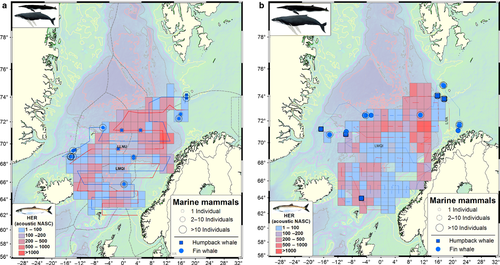
Neither fin- nor humpback whales displayed any significant correlations with the biomass of the pelagic fish species when all areas are taken into account (Table 3). However, when analyzing data collected from the M/V Libas, which surveyed the western- and northernmost areas both years (coinciding with the majority of the whale observations), humpback whales showed a positive correlation with the occurrence of herring from pelagic trawl catches (GLM, F = 200.7; P < 0.001; n = 56).
| Species | 2006 | 2007 | Together | ||||||
|---|---|---|---|---|---|---|---|---|---|
| df | P-value | Cor.coeff | df | P-value | Cor.coeff | df | P-value | Cor.coeff | |
| Mackerel-herring | 125 | 0.546 | −0.054 | 127 | 0.773 | −0.026 | 254 | 0.491 | −0.043 |
| Mackerel-blue whiting | 125 | 0.431 | 0.431 | 127 | 0.643 | −0.041 | 254 | 0.362 | −0.057 |
| Herring-blue whiting | 125 | 0.577 | −0.050 | 127 | 0.654 | −0.040 | 254 | 0.477 | −0.045 |
| Fin whale-mackerel | 125 | 0.542 | −0.055 | 127 | 0.449 | −0.067 | 254 | 0.341 | −0.060 |
| Fin whale-herring | 125 | 0.563 | 0.052 | 127 | 0.498 | −0.060 | 254 | 0.981 | 0.002 |
| Fin whale-blue whiting | 125 | 0.219 | 0.110 | 127 | 0.681 | −0.037 | 254 | 0.582 | 0.035 |
| Humpback whale-mackerel | 125 | 0.595 | −0.048 | 127 | 0.574 | −0.050 | 254 | 0.449 | −0.047 |
| Humpback whale-herring | 125 | 0.187 | 0.110 | 127 | 0.577 | −0.050 | 254 | 0.256 | 0.071 |
| Humpback whale-blue whiting | 125 | 0.570 | 0.051 | 127 | 0.766 | −0.026 | 254 | 0.648 | 0.029 |
| Fin whale-Krill/amphipods | 62 | >0.001 | 0.436 | 59 | 0.013 | 0.317 | 123 | >0.001 | 0.383 |
| Humpback whale-krill/amphipods | 62 | >0.001 | 0.433 | 59 | 0.475 | 0.093 | 123 | >0.001 | 0.305 |
- Cor. coeff, correlation coefficient.
- Significant correlations are shown in bold.
Meso-zooplankton from the WP2 nets was dominated by Calanoid copepods such as Calanus finmarchicus stage IV–VI. Biomass ranged from 0.21 to 21.17 g·m−2 (6.51 ± 3.89 g·m−2) in 2006 and from 0.56 to 13.12 g·m−2 (5.15 ± 2.38 g·m−2) in 2007. No correlation was found between fin- or humpback whale presence and plankton biomass.
Both fin- and humpback whales were positively correlated with catches and the presence of macro-zooplankton (krill and amphipods) in 2006, whereas only a correlation with the fin whale distribution was found in 2007 (Table 3). Krill and amphipods were not systematically sampled, but from a few echosounder recordings and trawl samples these macro-zooplankton were concentrated mainly above 50 m depth in cold Arctic water masses around Jan Mayen and Bear Island.
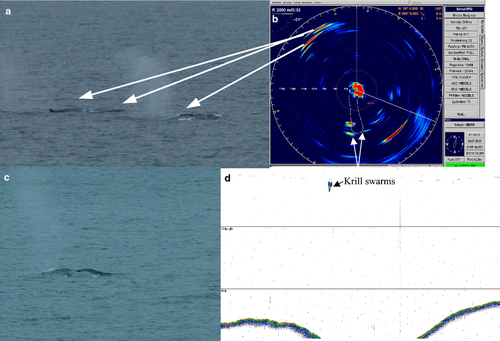
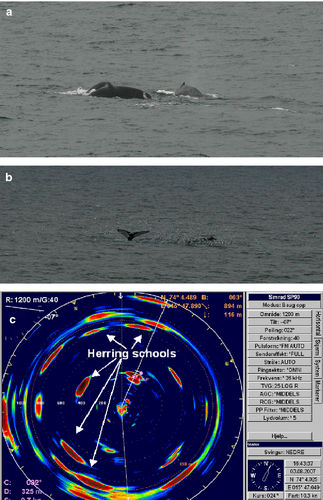
There were some anecdotal observations of ecological interest: six feeding events were detected for fin whales, with several dives of 5–6 min duration and about 30 s surface time with four to five blows. The whales were also swimming at close range in ‘a line’ (Fig. 6). There were three reports of humpback whale feeding: they were swimming in a confined area for a prolonged period, also with short diving intervals (Fig. 7). A large number of seabirds surrounded the whales.
Discussion
The main summer distribution of fin whales was found to be in the northern part of the Norwegian Sea for both years of our study. This area is known as highly productive for macro-zooplankton and pelagic fish, and this distribution pattern has also been found in previous studies (Clapham & Seipt 1991; Øien 2003, 2006; Nøttestad & Olsen 2004; NAMMCO 2006; Øien & Bøthun 2006). Krill and amphipods were positively correlated with fin whales in both 2006 and 2007, which is in accordance with previous studies (Jonsgård 1966; Christensen et al. 1992; Bowen & Siniff 1999).
The humpback whales were found mainly in the northwestern and northeastern regions of the study area both years, with the largest concentrations in the vicinity of Jan Mayen and Bear Island. This is also in accordance with previous studies (Øien 2003; Øien & Bøthun 2006). Krill/amphipods were significantly correlated with the distribution of humpback whales in 2007, but no significant correlation was found between herring and humpback whales. Herring was sampled on a coarser spatial scale, not directly overlapping the humpback whale sightings, contributing to the question as to whether this correlation may result from methodological limitations rather than actual interactions on the relevant spatial scale for the animals.
High densities of krill and amphipods are known to occur in the areas off Jan Mayen (Dalpadado et al. 1998; Melle et al. 2004) and this area also had the largest aggregations of fin whales. Given its stable shelf break, the Jan Mayen area should be a rather predictable habitat for potentially high plankton production through upwelling (Rey 2004). This, in turn, provides seasonally sufficient preferred planktonic prey for the fin whales, despite the large-scale shift of the prey community composition and distribution in the Norwegian Sea and surrounding waters (Langøy et al. 2012; Utne et al. 2012).
Fin whales co-occurred with schools of herring in the northern part of the distribution area. The fin whales displayed group foraging when feeding on NSS herring. Such feeding behavior has also been reported by Nøttestad et al. (2002b). Both prey organisms, macro-zooplankton and pelagic planktivorous fish, were detected in the same region, but the preference for macro-zooplankton was most likely due to the energetic trade-off between the cost of prey capture and the net gain from prey consumption (Pitcher & Parrish 1993; Acevedo-Guiterrez et al. 2002). NSS herring have a higher fat content than krill (Slotte 1999), which would lead us to expect the whales to prefer NSS herring. Furthermore, both prey organisms aggregate within confined areas and should, in this respect, be equally available as prey. However, NSS herring are more motile, with well developed anti-predator strategies/maneuvers than the more passive macro- zooplankton (Pitcher & Parrish 1993; Vabø & Nøttestad 1997; Nøttestad & Axelsen 1999). Thus, the energetic cost of chasing and capturing NSS herring is probably higher than the solitary capture of macro-zooplankton.
The humpback whales were found to be correlated with the overall presence of amphipods and NSS herring in the northernmost areas only, and these were their most important prey organisms. The preferred prey type of humpback whales may change according to season and location (Clapham 1996; Ross 2002). They have a generalist diet, feeding on euphausiids and various species of small schooling fish (Jurasz & Jurasz 1979). The latter include herring, capelin, sand lance Ammodytes sp. and mackerel (Hain et al. 1982; Clapham 2009). In late summer, capelin and herring are reported to dominate their diet (Hjort & Ruud 1929; Ingebrigten 1929). Our observations did not reveal a wide range of prey organisms, but it seemed that NSS herring and amphipods were targeted and preferred over other prey species such as mackerel and blue whiting in the region.
Both species of whale were distributed in the northernmost part of the study area. The distribution of baleen whales is determined largely by demography, the reproductive cycle and feeding conditions (Brodie 1975; Forcada 2002). The main foraging period occurs during the summer season (Jonsgård 1966) when they migrate to areas with high prey density to build up and maintain their energy reserves (Piatt & Methven 1992; Goldbogen et al. 2006). Thus, the distribution during the summer months is normally reflected by the distribution of prey (Nøttestad & Olsen 2004) and this pattern was apparent for the distribution of both whale species in our study.
Atlantic water masses penetrated far into the northern and western parts of the Norwegian Sea, and the central Norwegian Sea was warmer in 2007 than in 2006. This may have led to a more westerly distribution of pelagic fishes such as NSS herring, mackerel and blue whiting as well as krill Meganyctiphanes norvegica (Hewitt & Lipsky 2002) and amphipods Themisto libellula (ICES 2007). This again reflects our observations of more whales in central parts of the Norwegian Sea in 2006, whereas these species were distributed only in the western and northeastern parts in 2007. The zooplankton biomass in 2006 and especially in 2007 was the lowest recorded since 1997 in the Norwegian Sea (ICES 2007; Huse et al. 2012), which may be why most of the fin whale observations were made around Bear Island and Jan Mayen, where the shelf edges retain a stable and predictable supply of macro-zooplankton (Melle et al. 2004).
Combining acoustic data, pelagic trawling of potential prey species, oceanographic monitoring and visual sightings of marine mammals can provide new insights into habitat use in whales (Nøttestad et al. 2002a), dolphins (Bernasconi et al. 2011) and seabirds (Axelsen et al. 2001). The whale species in this study were observed feeding both alone and in groups. The use of this combined methodology and the monitoring of selected predator–-prey events in more detail made it possible to verify these interactions with complementary instrumentation and biological sampling. We could also shed more light on potentially preferred prey for fin- and humpback whales on each studied feeding occasion, due to the more synoptic observation and sampling regime.
In conclusion, the combination of modern underwater multi-frequency acoustic instrumentation such as calibrated echosounders and sonars, the standardized biological sampling of pelagic fish species and zooplankton, oceanographic monitoring and visual whale sightings enabled us to study more synoptically the feeding ecology of baleen whales, as well as the spatial overlap with their potential prey species. Despite major changes in the baleen whale prey communities and concentrations in the Norwegian Sea, there were no indications of any apparent changes in fin- or humpback whale prey preference and spatial distribution in our study from two consecutive years.
Acknowledgements
This project was financed by the Norwegian Ministry of Fisheries and Coastal Affairs in Oslo and the Institute of Marine Research, Bergen, Norway. We would like to thank the skippers and crew onboard the M/V Libas, M/V Eros and M/V Endre Dyrøy for excellent collaboration and practical assistance during the surveys in the Norwegian Sea. We are also grateful to the whale observers for their dedicated and important sighting work on the vessels involved in this study, and to Kjell Rong Utne for assistance with scrutinizing acoustic herring data for 2006 and 2007.


