Tidal exposure or microhabitats: what determines sandy-beach nematode zonation? a case study of a macrotidal ridge-and-runnel sandy beach in Belgium
Abstract
Lately, across-shore zonation has been found to be more important in structuring the nematode community of a tropical macrotidal sandy beach than microhabitat heterogeneity. To evaluate whether this zonation pattern applies to a temperate beach, a macrotidal ridge-and-runnels sandy beach in the North Sea was studied. We investigated whether a similar zonation occurs in sandbar and runnel microhabitats, and whether the runnels harbour a different community from the subtidal. Our results indicate that nematode communities from runnel and sandbar habitats are significantly different. In addition, horizontal zonation patterns for nematode communities differ between both habitats. Nematode assemblages from sandbars are divided to lower, middle and upper beach while upper and middle runnels cluster together. The subtidal and upper runnels showed dissimilar nematode assemblages, although runnels showed the same dominant species (Daptonema normandicum), which increases its abundance towards the upper runnels. This study illustrates the importance of microhabitat heterogeneity, which resulted in different zonation patterns across the sandy beach examined. The divergent zonation between sandbars and runnels in the macrotidal temperate sandy beach, compared with the pattern observed for a subtropical sandy beach with similar morphodynamics, indicates that generalizations about nematode distribution patterns should be made with caution.
Introduction
The description of general macro- and mesoscale patterns of meiofaunal distribution in sandy beaches is one of the key issues in sandy-beach ecology but it is hampered by the small number of basic studies and the diverse sampling protocols applied (Giere 2009). Faunal zonation in sandy beaches is related to environmental, tide-related variables such as desiccation and interstitial oxygen concentration (Defeo & McLachlan 2005). According to McLachlan & Jaramillo (1995), four different types of horizontal zonation on sandy beaches can be discerned: (i) no clear zonation; (ii) two zones delimited by the driftline; (iii) three zones, based on Dahl's (1952) classification – supralittoral, littoral and sublittoral; and (iv) four physical zones, based on sediment moisture – a dry zone, a zone of water retention, a zone of resurgence, and a zone of saturation (Salvat 1964). These physical zones are reflected in the distribution patterns of macrofauna (Defeo & McLachlan 2005) and meiofauna (Rodriguez et al. 2001; Kotwicki et al. 2005; Moreno et al. 2006), and more specifically in the composition of the nematode community (Gheskiere et al. 2004; Gingold et al. 2010). Whereas physical variables constrain the biological zonation by, for example, osmotic stress, biological interactions are believed to influence the distribution indirectly (McLachlan & Jaramillo 1995). As a result, macrofaunal diversity usually increases towards the lower beach, because many organisms depend on the water column for their feeding activity (Armonies & Reise 2000). By contrast, maximum meiofaunal and especially nematode diversity occur around the middle beach (Armonies & Reise 2000; Gheskiere et al. 2004; Gingold et al. 2010), related to the optimal conditions in terms of sediment stability and submergence (Huston 1979). Whereas the role of these tide-related environmental gradients in structuring the intertidal community is widely studied (Armonies & Reise 2000; Gheskiere et al. 2004; Kotwicki et al. 2005; Mundo-OCampo et al. 2007), habitat complexity (e.g. ridges and intertidal runnels) of tide-governed beaches is commonly neglected in sandy-beach surveys (e.g. Gheskiere et al. 2004; but see Gingold et al. 2010, 2011).
Macrotidal (i.e. tide-governed) ridge-and-runnel beaches can be found when a wide, gently sloping intertidal and nearshore zone combine with a moderate supply of sediment and a low-energy wave climate (Masselink et al. 2006). Those beaches are usually more heterogeneous compared with microtidal beaches, displaying intertidal sandbars intercalated by permanent runnels. In contrast, with sandbars, runnels remain submerged over a longer period of time and accumulate organic matter (Gingold et al. 2010). For a long time they were believed to harbour a fauna similar to that found in the subtidal area because of the constant submersion during low tide (Dörjes 1976), and surveys investigating horizontal zonation patterns on sandy beaches often excluded the runnel fauna (Gheskiere et al. 2004). However, a recent study on intertidal marine nematodes from a macrotidal beach in the upper Gulf of California (UGC) revealed differences between the communities inhabiting runnels and the communities living in subtidal sediments. The dominant tide-related horizontal nematode zonation was similar for runnels and sandbars, although these microhabitats contained different nematode communities (Gingold et al. 2010).
Given the importance of runnels potentially harbouring a large number of unique species and therefore being crucial for biodiversity surveys (Gingold et al. 2010), we set out to study the nematode distribution of a different ridge-and-runnel beach, to test the generality of the patterns found at the UGC beach. We chose to study an ultra-dissipative sandy beach at De Panne on the Belgian North Sea coast, with a contrasting climate but with similar topography compared with the beach studied by Gingold et al. (2010). Given the similar tidal regimes of the two beaches, we expected to find a similar tide-related zonation pattern; therefore, our first null hypothesis was: there is no difference in horizontal zonation between the nematode communities inhabiting sandbars and runnels. The UCG beach is under the influence of a subtropical climate, with very high temperatures in summer. There, permanently submerged runnels provide a suitable habitat for more species compared with the sandbars, where high temperature and desiccation are limiting factors. Given that De Panne lies within a temperate climatic zone, this beach does not experience large changes in temperature and desiccation. Therefore, our second hypothesis states that nematode communities from sandbars will not be different from nematode communities in the adjacent runnels.
Material and Methods
Study area
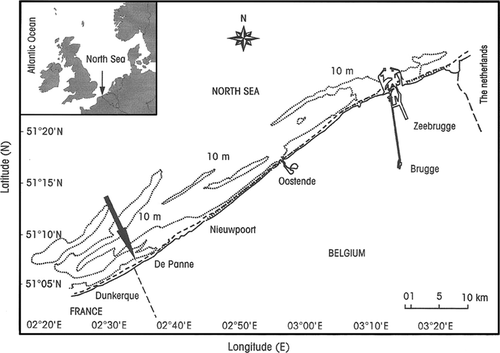
De Panne beach is located in front of the nature reserve ‘Westhoek Reservaat’ (51°05′30′ N, 02°34′01′ E), near the French border on the Belgian west coast (Fig. 1). A concrete dyke, constructed to protect the low-lying ‘Westhoek’ dune reserve from seawater erosion, interrupts the landward margin of the intertidal zone. The beach is 4 km long and is morphodynamically characterized as an ultra-dissipative sandy beach with a semi-diurnal macrotidal regime. The intertidal area is approximately 440 m wide, with four runnels parallel to the water line. The beach slope is about 1:90 to 1:100 and the mean spring and neap tides are 4.97 m and 3.02 m, respectively (Gheskiere et al. 2004).
Sampling strategy
During low spring tide on 24 August 2010, 10 stations were sampled along a transect perpendicular to the shoreline, ranging from the subtidal (Station 1) to the upper beach (Station 10). Each station was located in the middle of a sandbar (even numbers) or in the middle of a runnel (odd numbers), except Station 1, which represented the sublittoral (Fig. 2). At each station, triplicate samples were taken at the angles of an equilateral triangle, with sides of 50 cm, for meiofauna analysis; two replicates for pigments were taken at the edges of the triangle, and one replicate for granulometry was taken at the centre. Cores for meiofauna and granulometry were taken to a depth of 10 cm, whereas only the uppermost centimetre was collected for pigment analysis. Water salinity was measured at the subtidal and runnel stations. Cores for meiofaunal and granulometry analyses had an internal area of 10 cm2, and the core for pigments had an inner area of 2 cm2 (syringe with cut-off tip). Samples for meiofaunal analysis were fixed in the field using a neutral 4% formaldehyde–tap water solution, and samples for chl a were kept dark and cool during transport to the laboratory, where they were stored in a freezer at −20 °C until analysis.

Sample processing
Meiofauna samples were washed over a 38-μm sieve, and organisms were extracted by 10× decantation followed by density-gradient centrifugation, using Ludox®-HS-40, Grace GmbH & Co, Worms, Germany at a specific gravity of 1.18 (Heip et al. 1985). Nematodes were counted under a dissecting microscope. Subsamples of 100 randomly picked nematodes were transferred to De Grisse solution (De Grisse 1969) and mounted on slides for further identification to species level. Sediment particle-size distribution was determined using a Mastersizer 2000G, Malvern Instruments, Malvern-UK, and sediment fractions were defined according to the Wentworth scale (Bale & Kenny 2005). The sediment fractions were expressed as volume percentages. Chl a was extracted in 90% acetone and measured with a Turner fluorometer according to Yentsch & Menzel (1963) and Holm-Hansen et al. (1965).
Data analyses
Nematode assemblages were analysed using univariate and multivariate techniques. Total densities per 10 cm2, species richness (S) and species diversity (Shannon diversity index - H' loge) and the Index of Trophic Diversity (ITD) were calculated. ITD was modified from Heip et al. (1985) as 1/Σθ2, where θ is the contribution of each of four functional feeding groups (following Wieser 1953) to the community. ITD ranges from 1 (when one feeding group contributes 100% and thus functional diversity is lowest) to 4 (each feeding group contributes equally – 25% – and functional diversity is highest). The four feeding types include: 1A – selective deposit feeders, 1B – non-selective deposit feeders, 2A – epistrate feeders, and 2B – predators/omnivores (Wieser 1953).
To assess tide-related faunal zonation patterns, similarities among stations were calculated using the Bray–Curtis similarity on square root-transformed data, and visualized by non-metric multi-dimensional scaling (MDS). The species contributing most to similarity within each station were identified by SIMPER analysis. To identify the environmental variable(s) that correlated best with the faunal pattern, multivariate biological and environmental data (i.e. grain size and chl a) were analysed by BEST analysis, which conducts a Spearman-ranked correlation between the similarity matrices of the species and the environmental data. Similarity matrices on environmental data were based on Euclidean distances. As the number of replicates for environmental and biological data was not equal, the BEST analysis was done using mean values.
To assess the faunal differences between adjacent runnels and sandbars, density, species richness, species diversity and the ITD among stations were first analysed by one-way ANOVA, before checking for homoscedasticity using Cochran's test. Then, Student–Newman–Keuls (SNK) tests were applied to investigate the pairwise differences. Differences in nematode community composition between stations were investigated by means of one-way ANOSIM. If the ANOSIM output showed the same number of possible and actual permutations, we only report R-values because the P-values were not reliable, i.e. R > 0.25 means little separation, R > 0.5 means some overlap, but clear separation, and R > 0.75 indicates good separation.
All multivariate analyses and the calculation of S and H' were performed using PRIMER v.6 (Clark & Gorley 2006), and the ANOVA and SNK tests were performed using WinGMAV v.5 (designed, coded, and compiled by A.J. Underwood and M.G. Chapman, Institute of Marine Ecology, University of Sydney, Australia).
Results
Environmental variables
Sediments from all stations can be described as fine sand (median grain size 186–225 μm); a clay-silt fraction (0–63 μm) was absent at all stations, and a shell fraction was observed only at Station 8. Generally, slightly coarser sediments were observed higher on the beach. There was no clear difference in grain size between the habitats – runnels and sandbars (ANOVA, F = 0.29, P = 0.60).
Salinity increased in the runnel water towards the subtidal. Stations 1, 3 and 5 showed salinities of 35, and stations 7 and 9 had a salinity of 34 and 32, respectively.
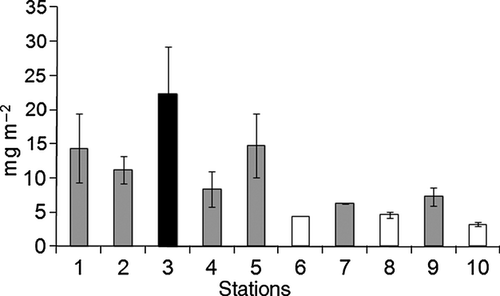
Chl a concentrations were significantly different among the stations (F9,20 = 3.35, P = 0.03). SNK test showed a significantly higher concentration at station 3, and no consistent difference in chl a concentrations between runnel and sandbar stations (Fig. 3).
Nematode community
In total, we found 94 nematode species. These species were distributed among 60 genera and 19 families, with Xyalidae being the most abundant family. Seventy-one species were present at the runnel stations; 14 species were unique for this microhabitat. The sandbar stations harboured 75 species, 18 of which were found only in this habitat. The subtidal station contained 39 nematode species (four exclusives) (Appendix 1).
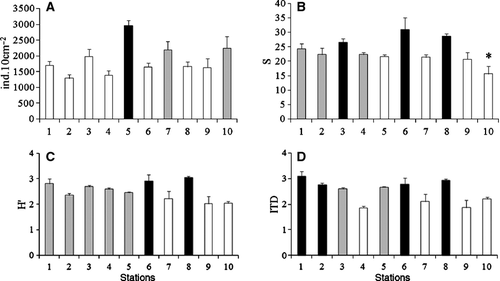
The mean density, species richness, species diversity and ITD were significantly different among stations (Fig. 4, Table 1), but a consistent pattern between runnel and sandbar stations could not be distinguished. Density was significantly higher at station 5 compared with most stations, whereas stations 3, 6 and 8 showed significantly higher species richness compared with stations 5, 7, 9 and 10. H' was significantly higher at stations 6 and 8 compared with stations 7–10. Higher values for ITD were encountered at stations 1, 2, 6 and 8, compared with most of the other stations (Fig. 4).
| MS | F(9,20) | P | |
|---|---|---|---|
| Density | 732676.65 | 5.27 | <0.001 |
| Species richness | 57.94 | 4.75 | 0.002 |
| Shannon diversity index (H') | 0.38 | 4.56 | 0.002 |
| Index of Trophic Diversity | 0.59 | 4.43 | 0.003 |
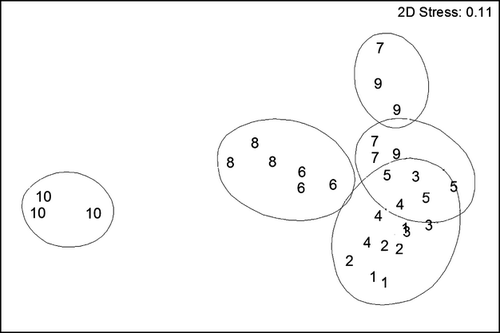
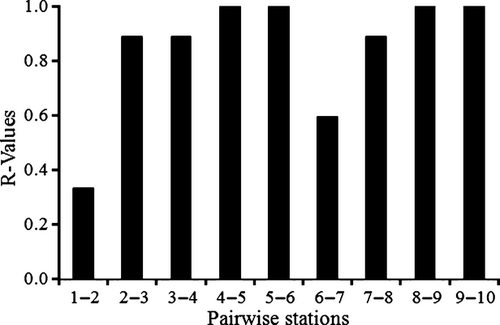
The nematode community structure at De Panne was spatially heterogeneous across the intertidal area, and showed distinct species assemblages at each station (ANOSIM R = 0.816, P < 0.01). A clear zonation from the lower to the upper beach occurred in the sandbar microhabitat along the horizontal axis of the MDS, dividing the community into lower beach (stations 2 and 4), middle beach (stations 6 and 8) and upper beach (station 10) (Fig. 5). The spatial distribution pattern of the runnel microhabitat was discerned along the vertical axis, reflecting a less evident zonation (Fig. 5). Dissimilarities between neighbouring runnel and sandbar communities increased from the subtidal towards the middle beach (from R = 0.333 to R = 1.000). After a sudden decline (Stations 6–7: R = 0.593), it started to increase again towards the upper beach (R = 1.000) (Fig. 6).
Enoplolaimus litoralis, Oncholaimellus calvadosicus and Daptonema normandicum were the dominant species responsible for the similarity between the subtidal station and the group of stations at the lower part of the beach, i.e. stations 1–3. The latter species was also dominant in the upper runnels, i.e. stations 7 and 9 (SIMPER, Table 2). The upper beach (station 10) was the area where the fewest species (only three) contributed 50% of the cumulative similarity, whereas the middle sandbars (Stations 6 and 8) harboured seven and eight characterizing species, respectively (Table 2). Mean grain size best explained the community structure (BEST, ρ = 0.578, P = 0.01).
Nematode communities from each intertidal runnel were significantly different from the communities found in the subtidal station (ANOSIM, R = 0.601, P < 0.01). Pair-wise tests showed that the main difference was observed between subtidal station 1 and runnel stations 5 and 9 (ANOSIM, R = 1.000), reflecting the increase in dissimilarity between subtidal and runnels towards the middle and upper beach (Table 3).
| St. 1 | St. 3 | St. 5 | St. 7 | St. 9 | ||||||||||
|---|---|---|---|---|---|---|---|---|---|---|---|---|---|---|
| Species | FT | (62.0) | FT | (61.6) | FT | (64.7) | FT | (51.8) | FT | (49.5) | ||||
| Enoplolaimus litoralis | 2B | 10.81 | Daptonema normandicum | 1B | 16.82 | Daptonema normandicum | 1B | 18.89 | Daptonema normandicum | 1B | 26.26 | Daptonema normandicum | 1B | 26.77 |
| Oncholaimellus calvadosicus | 2B | 20.65 | Trichotheristus sp.3 | 1B | 28.06 | Oncholaimellus calvadosicus | 2B | 35.22 | Neochromadora munita | 2A | 36.53 | Metadesmolaimus sp.1 | 1B | 38.21 |
| Daptonema normandicum | 1B | 30.05 | Enoplolaimus litoralis | 2B | 37.85 | Paracanthonchus thaumasius | 2A | 44.40 | Metadesmolaimus sp.1 | 1B | 45.11 | Oncholaimellus calvadosicus | 2B | 47.90 |
| Microlaimus sp.2 | 2A | 38.30 | Oncholaimellus calvadosicus | 2B | 47.14 | Chromaspirina pontica | 2B | 52.34 | Bathylaimus sp.1 | 1B | 51.40 | Neochromadora munita | 2A | 56.99 |
| Trichotheristus sp. 3 | 1B | 46.41 | Paracanthonchus thaumasius | 2A | 55.39 | |||||||||
| Monoposthia mirabilis | 2A | 53.96 |
| St. 2 | St. 4 | St. 6 | St. 8 | St. 10 | ||||||||||
|---|---|---|---|---|---|---|---|---|---|---|---|---|---|---|
| (59.4) | (62.6) | (62.8) | (67.4) | (68.9) | ||||||||||
| Oncholaimellus calvadosicus | 2B | 15.49 | Daptonema normandicum | 1B | 15.06 | Metadesmolaimus sp.1 | 1B | 9.52 | Enoplolaimus litoralis | 2B | 8.37 | Theristus sp. 2 | 1B | 21.74 |
| Enoplolaimus litoralis | 2B | 28.41 | Promonhystera faber | 1B | 29.59 | Oncholaimellus calvadosicus | 2B | 18.99 | Neochromadora munita | 2A | 15.46 | Hypodontolaimus sp.1 | 2A | 40.49 |
| Theristus sp.3 | 1B | 40.19 | Metadesmolaimus sp.1 | 1B | 41.69 | Neochromadora munita | 2A | 26.82 | Pomponema sp.2 | 2A | 22.33 | Chromadora axi | 2A | 58.10 |
| Daptonema normandicum | 1B | 48.98 | Theristus sp. 3 | 1B | 51.66 | Odontophoroides sp. 1 | 1B | 33.66 | Theristus sp. 2 | 1B | 28.64 | |||
| Promonhystera faber | 1B | 57.23 | Promonhystera faber | 1B | 39.83 | Mesacanthion sp. 1 | 2B | 34.86 | ||||||
| Paracanthonchus thaumasius | 2A | 45.85 | Monoposthia mirabilis | 2A | 40.81 | |||||||||
| Monoposthia mirabilis | 2A | 51.38 | Sigmophoranema rufum | 2B | 46.24 | |||||||||
| Odontophoroides sp.1 | 1B | 51.31 |
- FT, feeding type.
| Stations | Dissimilarity | r-value |
|---|---|---|
| 1–3 | 43.41 | 0.407 |
| 1–5 | 51.86 | 1.000 |
| 1–7 | 64.49 | 0.889 |
| 1–9 | 62.64 | 1.000 |
Discussion
General zonation patterns for meiofauna and especially for nematodes are difficult to find but they would allow better planning of biodiversity estimations and surveys. Therefore, we set out to describe the zonation pattern of intertidal marine nematodes at a macrotidal ridge-and-runnel beach, in order to compare it with earlier studies at the same beach (De Panne) and with a geographically contrasting ridge and runnel beach in the Upper Gulf of California (UGC). Our results indicate different zonation patterns for nematode communities in the sandbar and runnel microhabitats at the macrotidal beach of De Panne. In addition, nematode communities from both microhabitats were significantly different. As such, both null hypotheses for this study were rejected.
Our study showed a different pattern of nematode density compared with the results obtained by Gheskiere et al. (2004) and Kotwicki et al. (2005) for the same beach in the same season. In these earlier studies, an increase in density was observed towards the water line, whereas in our study the abundance peak was observed at the middle beach (station 5). Higher density in the middle beach agrees with the findings of Gingold et al. (2010) and Kotwicki et al. (2005) for macrotidal beaches from the Gulf of California and from a nearby Belgian beach, respectively. The difference between our results and those previously obtained in the same study area (Gheskiere et al. 2004; Kotwicki et al. 2005) could be the result of a temporal variability; nematode densities can change dramatically from year to year (McIntyre & Murison 1973; Gourbault et al. 1998; Nicholas 2001).
Highest nematode diversity was found in the sandbars of the middle beach (stations 6 and 8), corroborating previous work at this beach (Gheskiere et al. 2004; Urban-Malinga et al. 2008) and at other macrotidal sandy beaches (Armonies & Reise 2000; Gingold et al. 2010). All these authors attributed the higher diversity at this point of the beach to the intermediate disturbance hypothesis (Huston 1979), as an optimal balance among desiccation, sediment stability, temperature and oxygen concentration is found in the middle beach. The similarity among these studies is a good indication of a general pattern of nematode species diversity in the middle beach of macrotidal sandy beaches. The middle beach can be considered a transitional area, with a mixture of swash and surf zone processes allowing the co-occurrence of species from both the upper beach and the subtidal. In our study, 63% of the nematode species occurring in the middle beach were also found in the upper beach and/or subtidal.
Considering that across-shore zonation depends on the beach morphology, the degree of exposure, and the tidal regime (McLachlan & Jaramillo 1995; Rodriguez 2004; Kotwicki et al. 2005), the results presented here are compared only with topographically similar beaches. The nematode zonation in the sandbars corresponded to the three major assemblages previously found by Gheskiere et al. (2004) and Urban-Malinga et al. (2008), revealing the spatial heterogeneity of sandy beaches. This zonation (upper, middle, lower beach) is commonly found in macrotidal sandy beaches, and confirms the three biological zones established by Dahl (1952). However, our study revealed that the three horizontal biological zones are not valid for the runnels, as the nematode communities for runnels and sandbars at De Panne beach were increasingly dissimilar towards the upper beach (see Fig. 6). In addition, nematode communities from different runnel stations were not clearly separated, as in the case of the sandbar stations (Fig. 5). At our study site, the uppermost sandbar was exposed for approximately 5 h, whereas the lowermost sandbar was exposed for 1.5 h. The increasingly extreme conditions towards the upper beach may cause a stronger separation of sandbar assemblages. By contrast, the more stable conditions in the runnels lead to a less obvious horizontal zonation pattern in nematode communities inhabiting the runnels. The slight difference between upper and lower runnel assemblages may be a consequence of increasing grain size (the variable that best explained the nematode communities), temperature, and decreasing salinity towards the upper beach. Although there was no statistical difference between the grain size of runnels and sandbar, there was an increase of approximately 40 μm in the grain size from the subtidal to the uppermost station. As nematodes are tiny animals that live in constant association with the sediment, any difference in grain size may have an effect in the community structure (Giere 2009). On the other hand, the availability of labile organic matter in the sediment does not seem to affect the nematode community composition (Maria et al. 2012) given that Chl-a differed among stations but not between habitats. The absence of a comparable horizontal zonation pattern in sandbars and runnels contrasts with the findings of Gingold et al. (2010), who suggested that across-shore zonation dominates over the runnel-ridge heterogeneity. Our results demonstrate that local variability and environmental heterogeneity can be more important in structuring the nematode community of De Panne beach. Perhaps the different zonation pattern of runnels in the De Panne and Upper Gulf of California (UGC) beaches is caused by the difference in temperature fluctuations that both beaches undergo. Temperatures at UGC are much higher than at De Panne, and increases in this factor could be considered crucial for the survival, reproduction, maturation, respiration and food assimilation of nematode species (Tietjen & Lee 1973; Heip et al. 1978; Moens & Vincx 2000a,b).
Whereas we found discrete assemblages in the middle and upper sandbars, nematode assemblages of runnels and sandbars were not dissimilar towards the water line, and were characterized by sharing Daptonema normandicum, Enoplolaimus litoralis and Oncholaimellus calvadosicus with the subtidal community. The similarity between the subtidal and lower stations supports the idea that low-intertidal communities are an extension of the subtidal community (Degraer et al. 1999; Gheskiere et al. 2004). Thirty of 33 nematode genera found, and 12 of 13 properly identified species are known from subtidal areas of the North Sea (Heip et al. 1983; Vincx 1989; Vanreusel 1990; Steyaert et al. 1999; Vanaverbeke et al. 2002, 2007; Vanaverbeke & Vincx 2008).
Nematode communities from sandbars and runnels were significantly different. Compared with nematodes from runnels, nematodes from the upper sandbars are exposed to more extreme conditions, such as high rates of desiccation, high temperature and salinity fluctuations, which are caused by long periods of tidal exposure. Although salinity decreases towards the upper runnels, the runnel assemblages were characterized by high abundances of Daptonema normandicum, a nematode species that was not abundantly present in the upper sandbars. The interstitial spaces of the runnels are always filled with water, which may favour the deposit-feeding strategy of this species (Gheskiere et al. 2004). This species is also reported from areas with high organic enrichment, such as tidal flats (Moens & Vincx 1997), beaches polluted by sewage (Huang et al. 2005) and subtidal areas with large amounts of total organic carbon (Schratzberger et al. 2000; Mahmoudi et al. 2005). A closely related species, Daptonema oxycerca, is not able to sustain its osmoregulation under hypertonic conditions for long periods (Foster 1998) and, if this is also true for D. normandicum, may explain its low densities in the upper sandbars. The low density of D. normandicum in the upper sandbars may also be related to the sampling time, as this species is not abundant in the upper centimetres of sandbar sediments during low tide (Maria et al. 2012). The combination of possible high food availability in water-saturated sediments and less extreme temperatures in the runnels may provide a suitable habitat for D. normandicum. Sandy-beach zonation for macrofaunal organisms only exists during low tide (McLachlan & Brown 2006).
Approximately one-sixth of the overall taxonomic species richness (14 of 94) on this sandy beach was found exclusively in the runnels, and, therefore, the exclusion of this microhabitat from a survey would underestimate the biodiversity of the ecosystem. However, there was also a similar number of unique species for the sandbar microhabitat (18 of 94), in contrast to the observations of Gingold et al. (2010), who found few exclusive species for this microhabitat. Three of the four possible feeding types (according to Wieser 1953) were found in the upper 50% of the typical species for runnels and sandbars. This indicates that both habitats provide resources for herbivores, deposit feeders and omnivores/predators. This, again, contrasts with the assumption that only runnels are a stable environment and provide food resources for all nematode-feeding types (Gingold et al. 2010). Microphytobenthos, despite its low abundance, has been shown to be a potential carbon source for nematode species from the sandbar microhabitat (Maria et al. 2011). In addition, nematodes can shift their preferential food source according to their maturation stage or the availability of resources (Moens & Vincx 1997; Nicholas 2001).
Conclusions
The results of the present study reinforce the importance of including different microhabitats when studying across-shore zonation patterns. Given that some nematode species were exclusive to either runnels or sandbars, only this approach allows us to obtain a complete picture of the biodiversity of sandy-beach ecosystems, as previously suggested by Gingold et al. (2010). Sandbar nematode communities show a clear zonation in the upper, middle and lower beach, but this pattern is less evident in the runnel microhabitat. Therefore, the divergent zonation between the upper sandbars and runnels in this temperate-zone macrotidal sandy beach, compared with the patterns observed for a sandy beach with very similar hydrodynamics, located in the subtropical climatic zone of the Gulf of California, demonstrates that generalization with respect to nematode zonation patterns should be made with caution.
Acknowledgements
We thank Niels Viaene and Ngo Xuan Quang for their support during the sampling campaign, as well as Juliana Rocha, Verônica Oliveira and Valéria Santana for their help during the meiofauna counting and Dirk Van Gansbeke for providing the pigments results. Gratitude is expressed to Dr Janet W. Reid, JWR Associates, for her critical revision of the English. Comments by two reviewers increased the quality of this manuscript. The first author was sponsored by a PhD scholarship from Vlaamse Interuniversitaire Raad – VLIR-UOS. This paper contributes to FWO project G.0041.08N.
Appendix 1
Nematode species list per microhabitat
| Species | Sandbars | Runnels | Subtidal |
|---|---|---|---|
| Acantholaimus sp.1 | X | ||
| Ascolaimus elongatus | X | X | X |
| AXONOLAIMIDAE type 1 | X | ||
| Bathylaimus sp.1 | X | X | |
| Bolbolaimus crassiceps | X | X | X |
| Bolbolaimus sp.2 | X | ||
| Camacolaimus sp.1 | X | ||
| Camacolaimus sp.2 | X | ||
| Chaetonema riemani | X | ||
| Chromadora axi | X | X | |
| Chromadora sp.1 | X | X | |
| Chromadora sp.2 | X | X | |
| Chromadorella salicaliensi | X | X | X |
| Chromadorita sp. 1 | X | X | |
| Chromaspirina inglisi | X | X | X |
| Chromaspirina pontica | X | X | X |
| Daptonema normandicus | X | X | X |
| Daptonema sp.2 | X | X | |
| Daptonema sp.3 | X | ||
| Daptonema sp.4 | X | ||
| Daptonema sp.5 | X | ||
| Daptonema sp.6 | X | ||
| Dichromadora sp.1 | X | X | |
| Eleutherolaimus sp.1 | X | X | X |
| Enoplolaimus litoralis | X | X | X |
| Enoplolaimus sp.3 | X | X | |
| Eumorpholaimus sp.1 | X | X | X |
| Gammanema sp.1 | X | X | X |
| Hypodontolaimus sp.1 | X | X | X |
| Hypodontolaimus sp.3 | X | X | |
| Hypodontolaimus sp.4 | X | X | |
| Leptolaimus sp. 1 | X | ||
| Leptonemella sp.1 | X | X | X |
| Marylynnia sp.1 | X | ||
| Mesacanthion sp. 1 | X | X | |
| Mesacanthion sp. 2 | X | ||
| Metachromadora sp. 2 | X | ||
| Metadesmolaimus sp.1 | X | X | X |
| Metadesmolaimus sp.2 | X | X | X |
| Metadesmolaimus sp.3 | X | X | |
| Metadesmolaimus sp.4 | X | X | |
| Metadesmolaimus sp.5 | X | X | X |
| Microlaimus sp.1 | X | X | X |
| Microlaimus sp.2 | X | X | X |
| Microlaimus sp.3 | X | ||
| Microlaimus sp.4 | X | ||
| Monoposthia mirabilis | X | X | X |
| Monoposthia sp.2 | X | X | X |
| Neochromadora munita | X | X | |
| Neochromadora sp.2 | X | X | |
| Neochromadora sp.3 | X | ||
| Oncholaimellus calvadosicus | X | X | X |
| Oncholaimus dujardini | X | X | |
| Onyx sp.1 | X | X | |
| Odontophora sp.1 | X | X | X |
| Odontophoroides sp. 1 | X | X | |
| Paracanthonchus thaumasius | X | X | X |
| Paracyatholaimus sp.1 | X | ||
| Paracyatholaimus sp.3 | X | X | |
| Paralinhomoeus sp.1 | X | ||
| Pomponema sp.2 | X | X | X |
| Promonhystera faber | X | X | X |
| Pseudonchus sp.1 | X | ||
| Richtersia sp.1 | X | ||
| Rhabdocoma sp.1 | X | ||
| Rynchonema sp.1 | X | ||
| Sabatieria sp.1 | X | X | |
| Sabatieria sp.2 | X | ||
| Sabatieria sp.4 | X | ||
| Setosabatieria sp.1 | X | ||
| Setostephanolaimus sp.1 | X | X | X |
| Sigmophoranema rufum | X | X | |
| Southernia sp.1 | X | ||
| Southerniella sp. 1 | X | ||
| Spilophorella sp.1 | X | X | |
| Stephanolaimus sp.1 | X | X | |
| Stephanolaimus sp.3 | X | ||
| Synonchiella sp.1 | X | X | X |
| Synodontium sp. 1 | X | X | X |
| Theristus sp. 2 | X | ||
| Theristus sp.3 | X | X | X |
| Theristus sp.4 | X | ||
| Theristus sp.5 | X | ||
| Theristus sp.6 | X | X | |
| Terschellingia sp.1 | X | X | X |
| Terschellingia sp.2 | X | ||
| Trefusia sp.1 | X | X | |
| Trichotheristus mirabilis | X | X | X |
| Trichotheristus sp.3 | X | X | X |
| Tripyloides sp.1 | X | ||
| Trissonchulus sp. 1 | X | ||
| Viscosia sp.1 | X | X | X |
| Xyala striata | X | X | X |
| Unidentified | X |


