
Developing an Automatic Pronunciation Scorer: Aligning Speech Evaluation Models and Applied Linguistics Constructs
CRediT author statement–Danwei Cai: conceptualization; methodology; software; project administration; investigation; validation; visualization; writing–original draft preparation; writing–review and editing. Ben Naismith: conceptualization; data curation; formal analysis; methodology; writing–original draft preparation; writing–review and editing. Maria Kostromitina: writing–original draft preparation; writing–review and editing. Zhongwei Teng: conceptualization; data curation; methodology; investigation. Kevin P. Yancey: conceptualization; project administration; writing–original draft preparation; writing–review and editing. Geoffrey T. LaFlair: writing–original draft preparation; writing–review and editing.
A one-page Accessible Summary of this article in nontechnical language is freely available in the Supporting Information online and at https://oasis-database.org
We would like to thank Alina A. von Davier for her review of this manuscript and her support for this work.
The handling editor for this article was Okim Kang.
Abstract
Globalization and increases in the numbers of English language learners have led to a growing demand for English proficiency assessments of spoken language. In this paper, we describe the development of an automatic pronunciation scorer built on state-of-the-art deep neural network models. The model is trained on a bespoke human-rated dataset that reflects current perspectives on pronunciation and intelligibility. The new scorer is evaluated along three criteria: How well it explains expert human ratings, how it compares to other state-of-the-art automatic pronunciation scorers in explaining expert human ratings, and the extent to which it exhibits bias toward different groups of test takers. Results indicate that the proposed scorer shows strong positive correlations with expert human ratings and outperforms other scorers. However, the scorer shows some bias related to audio quality and language family groups. We conclude with future directions for mitigating bias and argue that this scorer holds potential for use in operational settings.
Introduction
Due to globalization and consequent world-wide increase in the number of English language learners, there is a growing demand for English proficiency assessments, especially those that can evaluate learners’ speaking proficiency (Evanini & Zechner, 2019). Traditionally, test taker performance on speaking assessments has been scored by human raters. Although widely used, this scoring method is not without drawbacks, such as the labor-intensive nature of the task as well as the potential for rater fatigue and bias (e.g., Kang et al., 2019; Winke et al., 2013). In recent years, however, there has been a rise in automatic second language (L2) speech scorers (a.k.a. automated speech evaluation systems and automarkers) that can score test taker spoken responses instead of, or in conjunction with, human raters. Thanks to the development of sophisticated automated speech recognition (ASR) systems and advancements in natural language processing (NLP) and artificial intelligence (AI), state-of-the-art (SOTA) automatic speech scorers can comprehensively evaluate pronunciation features of test taker speech, a key subconstruct of overall speaking proficiency.
There are currently several automatic speech scorers used by test providers, including SpeechRater by English Testing Service (ETS; e.g., Zechner & Evanini, 2019); Custom Automated Speech Engine (CASE v1.9) by Cambridge Assessment (e.g., Xu et al., 2021); Ordinate Scoring System by Pearson Test of English (PTE; e.g., Pearson, 2019); and Duo Speaking Grader by the Duolingo English Test (DET; e.g., Cardwell et al., 2024). Although these automatic scorers include pronunciation as a measured subconstruct, they each operationalize this subconstruct differently. Moreover, it is oftentimes unclear how automatic scorers make decisions about the measurement of speech features. This lack of transparency turns an automatic scorer into a “black box,” leaving users unsure of how speech is being assessed and undermining the validity of the resultant scores. Lack of conceptual and empirical support for features weakens the representation of the construct and, in turn, interpretations of scores.
In the domain of educational measurement and L2 assessment, researchers have extensively discussed validity considerations for automatic scorers of constructed-response tasks. Williamson et al. (2012) argued that when an automatic scorer aims to evaluate characteristics of test taker language, such as pronunciation, there needs to be a clear operationalization of how this subconstruct is represented and measured through theoretically and empirically selected features. This study, therefore, sets out to describe the process of development and validation of a new automatic pronunciation scorer for a high-stakes English language proficiency exam (i.e., exams used for university entry or other high-stakes contexts), the DET. As part of the pronunciation scorer's validation, we have compared its performance to expert human raters. Specifically, we evaluated the automatic pronunciation scores against human ratings by calculating correlation coefficients and by performing differential feature functioning (DFF; Zhang et al., 2017) analysis on model scores to ensure fairness across different subgroups, such as the test taker's gender and language families.
Background Literature
Pronunciation as a Component of the Construct of Second Language Speech
Until relatively recently, pronunciation had largely been absent from the L2 speaking proficiency research and assessment landscape (Suzukida & Saito, 2022). Since the introduction of automatic speech scorers, however, pronunciation has gained ground as a component of L2 speaking proficiency, especially given the capabilities of such systems to measure acoustic as well as temporal features of L2 speech (Hsieh et al., 2019; Zechner et al., 2009). Additionally, compared to earlier approaches to L2 pronunciation, the growing status of English as an international language has motivated a shift from the native-speaker standard in pronunciation learning and assessment to a new standard focusing on intelligible speech (producing individual words or utterances that are understood by a listener; Jenkins, 2006; Levis, 2020). This intelligibility-based pronunciation assessment centers around successful communication rather than comparing a test taker's pronunciation with an inner-circle English accent (e.g., American English or British English; Brown, 2020; Kachru, 1997).
With this shift, research has attempted to identify the segmental (individual phonemes), suprasegmental (prosodic), and temporal features that are most important for being intelligible (e.g., Kang et al., 2022) and easily understood (i.e., comprehensible; e.g., Kang, 2010) and that can be used to characterize L2 pronunciation proficiency. The field of L2 assessment, however, is yet to agree on features that define the construct of L2 pronunciation and the related subconstructs of intelligibility and comprehensibility that are usually the focus of L2 pronunciation learning (Huensch & Nagle, 2023; Saito & Plonsky, 2019). Nevertheless, attempts have been made to define and empirically identify these features, linking them to L2 pronunciation and spoken proficiency.
With regard to segmentals, several earlier frameworks identified contrastive features that may affect intelligibility and comprehensibility and, by extension, affect L2 oral proficiency evaluations. These frameworks include Catford's (1987) functional load principle that proposes a ranked list of English phonemes where phonemic contrasts that are most crucial for distinguishing meaning between words carry the heaviest “functional load” (see Brown, 1991). Munro and Derwing (2006) provided empirical evidence of functional load, finding that speakers who substitute certain high functional load consonants with contrasting phonemes are perceived as less comprehensible than those who make low functional load substitutions. These findings were supported in Derwing and Munro's (2015) more recent conceptualization of segmental features that affect intelligibility. In this work, issues that may lead to less intelligible speech include segmental deviations (e.g., insertion, deletion, substitution, and distortion) and prosodic deviations (e.g., in sentence stress, rhythm, and intonation). In the assessment context, Kang and Moran (2014) trialed the functional load for evaluating oral proficiency. Although these frameworks were not incorporated into existing automatic pronunciation scorers, they served as a foundation for later empirical efforts to validate pronunciation features.
Research has also suggested that certain suprasegmental and temporal features are important predictors of judgments about L2 speakers’ comprehensibility and oral proficiency (Kang, 2010). Some of these features include prominence (e.g., Field, 2005), pitch range (e.g., Kang, 2010), intonation composition of utterances (e.g., Kang & Johnson, 2018), as well as speech rate, length of silent pauses, and, to some extent, rhythm (e.g., Kang et al., 2022). Lexical stress, defined as prominence on one syllable, which makes the syllable sound longer, higher (in frequency), and louder, has also been associated with intelligibility and comprehensibility of L2 speech (Hahn, 2004; Zielinski, 2008). Other fluency-related features associated with intelligible and comprehensible speech include breakdown fluency (Hsieh et al., 2019), repair fluency (Iwashita et al., 2008), mean length of run and expected pause ratio (Kang & Johnson, 2018), and other fine-grained microfluency features (Yan et al., 2021).
At the linguistic competence level, pronunciation has not been explicitly discussed in well-known communicative models of language assessment (e.g., Bachman & Palmer, 1996); however, it has been somewhat incorporated into the Common European Framework of Reference (CEFR; Council of Europe [COE], 2001, 2020). The CEFR describes pronunciation competence across A1–C2 proficiency levels in terms of intelligibility, individual sounds, prosodic features, and fluency. Taken together with features born out of previous empirical work, these competence descriptions serve as a useful source for rubric development for human scores that can be used for training automatic pronunciation scorers. Note that in developing the automatic pronunciation scorer in this paper and validating it via human expert ratings, we took a similar approach. That is, we operationalized pronunciation as a combination of features related to segmental and suprasegmental speech features, fluency features, and perceived intelligibility.
Pronunciation in Automatic Speech Scorers
Automatic pronunciation scorers almost always rely on some form of automatic speech recognition (ASR). ASR used in speech autoscorers has been criticized for having a higher error rate in recognizing spontaneous L2 speech compared to scripted speech (Zechner & Evanini, 2019). These difficulties have generally stemmed from the lack of L2 speech datasets to train systems on, as well as considerable variability in L2 speech production (Qiao et al., 2021). Finally, for pronunciation specifically, L2 spontaneous speech typically displays features hindering ASR performance, including mispronounced words and disfluencies like false starts and filled pauses (Kim et al., 2024; Qiao et al., 2021). However, in recent years, ASR and automatic pronunciation scorers have improved their capabilities to accurately process L2 speech and its pronunciation features (Tejedor-García et al., 2021).
Existing automatic scorers largely reflect a growing recognition of the importance of pronunciation for communicative success, as well as the role of intelligibility and comprehensibility in pronunciation. Well-known automatic speech scorers of high-stakes English language proficiency tests (such as the SpeechRater, CASE v1.9, the Ordinate Scoring System, and the Duo Speaking Grader) each incorporate pronunciation as one of the measured subconstructs; however, there are differences in how pronunciation is operationalized. Below, we detail how each scorer operationalizes pronunciation and how the features included in the scorers relate to intelligibility- and comprehensibility-focused description of L2 pronunciation proficiency.
First deployed in 2006 for scoring the low-stakes Test of English as a Foreign Language (TOEFL) Practice Online assessments, SpeechRater (Zechner & Evanini, 2019; Zechner et al., 2009) is currently used for rating the internet-based TOEFL (iBT) speaking assessment. Overall, for the TOEFL iBT speaking section scores, SpeechRater to human rater agreement reaches r = .85, slightly lower than human–human interrater agreement of r = .90 (Zechner, 2019). SpeechRater derives its features from the subconstructs of the TOEFL iBT Speaking section rubrics (Chen et al., 2018) and from findings in the fields of second language learning and assessment (Zechner & Evanini, 2019). Pronunciation along with fluency is integrated in one of these subconstructs, namely, delivery (Chen et al., 2018). For fluency, a three-way distinction is made (Hsieh et al., 2019): breakdown fluency (related to pause frequency, length, and placement), speed fluency (e.g., syllables per second or mean length of runs), and repair fluency (related to restarts, repetitions, and self-corrections).
For pronunciation, SpeechRater includes segmental and suprasegmental features. The five segmental measures relate to the likelihood of phones compared to a reference model. Suprasegmental features relate to stress (five features), tone/intonation (two features), and rhythm (12 features). For the stress features, shorter distances and more uniform intervals between stressed syllables receive higher scores. Similarly, tone features relate to distance between tone units but correlate less to proficiency scores. The rhythm features focus on interval-based aspects of vowel sounds, consonant sounds, and syllables in the speech signal. In terms of construct representation and previous research on pronunciation-related features, it appears that SpeechRater, although providing a comprehensive coverage of temporal, fluency, stress, and rhythm features, is somewhat limited in its assessment of segmental features. For example, although phone likelihood comparison is included, it provides only one measure for vowel duration (comparing mean test taker vowel and expert speaker vowel durations). At the suprasegmental level, tone/intonation is limited to only two features.
The ordinate scoring system (Pearson, 2019) is the automatic speech scorer that underlies the PTE Academic. It is trained on a large number of responses from test takers and scores from human raters. Pearson (2019, p. 6) claims to measure “many hundreds of linguistic and acoustic features in each response,” with the following example types mentioned specifically for pronunciation: pace, timing, rhythm, power of voice, emphasis, intonation, and accuracy of pronunciation. These features are grouped into pronunciation and fluency and intonation. Pearson (2019) reports that the correlation between ordinate machine scores and human scores was r = .96. There is limited transparency about how specific ordinate features map to overall pronunciation (including comprehensibility and intelligibility) and little detail on how certain segmental and suprasegmental features are measured.
Finally, CASE is the automatic speech scorer used to score the Linguaskill General Speaking test (Linguaskill) by Cambridge Assessment English. Xu et al. (2021) have described the features of CASE (Version 1.9) as being related to the subconstructs of intelligibility, intonation, fluency, vocabulary, and grammar. The exact features (or number of features) of CASE are not publicly available; instead, validation of the automatic scorer is presented in terms of the reliability of the results when compared to human ratings (56.8% exact agreement and 96.6% adjacent agreement between automatic speech scorer and human grades; Xu et al., 2020).
For each speaking item scored by the Duo Speaking Grader, the automatic speech scorer extracts features and then combines them into a single portfolio that is graded using a machine learning (ML) model. The current features have been grouped into six subconstructs: content, discourse coherence, vocabulary, grammar, fluency, and pronunciation (Cardwell et al., 2024). The current model contains pronunciation and fluency features that relate to the length of the response (e.g., total number of tokens, total duration), the speed of the response (e.g., words per second), and accuracy, measured through the acoustic model's confidence in the transcription. In essence, this score can be seen as a proxy for intelligibility as it is the extent to which the ASR model can actually “understand” test taker speech.
Current automated scoring systems include elements that are typically proxies for intelligibility and comprehensibility, operationalized through finer-grained fluency, segmental, and suprasegmental features. This paper reports on the development of a feature for the Duo Speaking Grader that is a more holistic measure of pronunciation, including aspects of intelligibility and comprehensibility, in order to improve measurement of the speaking construct.
Machine Learning Methods on Pronunciation Assessment
The application of machine learning methods in pronunciation assessment has largely centered on computer-assisted pronunciation training (CAPT), focusing on providing pronunciation feedback for L2 learners (Neri et al., 2008; Rogerson-Revell, 2021). Goodness of pronunciation (GOP) has emerged as a widely used measure for evaluating L2 speech by quantifying pronunciation accuracy on the basis of confidence scores derived from ASR models. Initially, GOP was computed using hidden Markov model (HMM)-based ASR systems, which assessed pronunciation quality by estimating the likelihood that specific phonemes were present in the speech signal at each moment (Kim et al., 1997; Witt & Young, 2000). With advancements in deep neural network (DNN)-based ASR, GOP estimation has improved, enhancing phoneme discrimination and reducing word error rates (Amodei et al., 2016). Beyond phoneme-level assessments, DNN models support multigranularity scoring, aggregating GOP scores at the phoneme, word, and utterance levels to provide a holistic evaluation of pronunciation (Gong et al., 2022; Lin et al., 2020). Further refinements leverage acoustic features from pretrained DNN models to enhance pronunciation assessment beyond traditional GOP scores, for example, by integrating phoneme transition patterns and linguistic-acoustic similarity (Lin & Wang, 2021; Liu et al., 2023).
However, CAPT's construct differs substantively from high-stakes L2 pronunciation assessments. CAPT tools are designed to enhance learners’ pronunciation by providing detailed phonetic feedback on various aspects such as phoneme articulation, stress, and intonation. In contrast, high-stakes assessments require a holistic evaluation that integrates pronunciation into the broader context of language proficiency. Such evaluation involves ensuring that the automatic scorers not only accurately reflect pronunciation quality but also align with theoretical constructs of communicative competence (Choi & Kang, 2023), including how segmental, suprasegmental, and temporal aspects of pronunciation play into that competence.
Bias in Automated Scoring
Another aspect of automatic pronunciation scoring that needs to be accounted for is potential bias toward certain speakers’ attributes, mainly due to the scorer's underlying acoustic models used for ASR and its training data. Early automatic scorers struggled with L2 speech because the ASR systems were designed for first language (L1) English speakers (Litman et al., 2018). Such systems tend to compare speaker pronunciations against a standard “ideal” accent, even though achieving native-like pronunciation is not necessarily realistic, or even desirable, for effective communication (Levis, 2020; Suzukida & Saito, 2022).
Studies have also found that speaker characteristics like L1, dialect, gender, and age can substantially impact how automatic scorers evaluate pronunciation. Just as human assessors’ perceptions can be influenced by a speaker's linguistic background and identity (Carey et al., 2011; Kartushina & Frauenfelder, 2014), automatic scorers show varying sensitivity to speaker characteristics. This bias tends to appear particularly in how they handle accented speech (i.e., the extent to which L2 speech is perceivably different from the L1 norm; Kang, 2010), with many automatic pronunciation scorers struggling to fairly evaluate pronunciations that differ from their training data's accent profile (Eskenazi, 2009). Saenz and Hain (2021) found that different automatic pronunciation scorers showed varying sensitivity to speaker background characteristics like L1 and dialect used in everyday life, residence in a multilingual household, and other characteristics. These findings align with human assessor behavior, in which prior experience with certain accents and perceived speaker identity are known to influence pronunciation evaluation (Winke et al., 2013). Finally, studies have noted that audio quality can introduce bias when L2 speech is automatically measured and scored (Chen et al., 2018), emphasizing the need to investigate the effect that devices, which capture speech, have on scores. Given these possible limitations of automatic speech scorers, there needs to be an estimation of the degree to which they may display bias towards speakers on the basis of construct-irrelevant characteristics, such as their L1, gender, and the technology used to capture their spoken responses. In the context of high-stakes language assessments, investigations of these scorers for potential bias generate core pieces of validity evidence (Williamson et al., 2012) and are a central practice of responsible use of AI in language assessment development (Burstein, 2023).
The Present Study
-
To what extent can a SOTA automatic pronunciation scorer be adapted to predict construct-aligned human ratings of L2 pronunciation?
-
How does the adapted automatic pronunciation scorer compare to existing baseline scorers when predicting construct-aligned human ratings of L2 pronunciation?
-
To what extent does the adapted automatic pronunciation scorer exhibit bias toward test takers on the basis of construct-irrelevant attributes?
Automatic Pronunciation Scorer Development
This section describes our proposed automatic pronunciation scorer. We first briefly introduce the hierarchical pronunciation scorer based on the study by Liu et al. (2023), which was originally proposed for read-aloud tasks in which speakers all read the same script. Then, we describe the method used to adapt this pronunciation scorer to the responses for open-ended speaking tasks common in high-stakes assessments. The following section provides an explanation of the developed pronunciation scorer (see Appendix S1 in the online Supporting Information for further technical details).
Hierarchical Pronunciation Scorer
The pronunciation scorer uses DNNs to analyze the audio and progressively aggregates information from four stages: frame-level (a small, fixed-length segment of audio data processed as a unit), phoneme-level (meaningful English speech sounds), word-level (constructed from phonemes), and utterance-level (a unit of speech bounded by silence, often equivalent to written phrases, clauses, or sentences). A pronunciation score for the audio input is generated from the utterance-level features.
Extracting Frame-Level and Phoneme-Level Acoustic Features
We employed a phoneme recognition model to analyze raw audio waveforms and extract frame-level acoustic features. These features encode small segments (around 20 milliseconds) of the waveform into patterns that facilitate phoneme identification. To obtain phoneme-level features, consecutive frames corresponding to the same phoneme were grouped together, allowing the model to capture phoneme-specific characteristics more effectively.
An example of frame-level and phoneme-level acoustic features extracted by a phoneme recognition model from the audio waveform is shown in Figure 1. The bottom of the figure shows a direct representation of the raw audio waveform. The x-axis represents time, and the y-axis represents the amplitude of the sound. The vertical dashed lines mark the boundaries of individual phonemes. The middle of the figure displays the frame-level acoustic features extracted by the phoneme recognition model. These features are depicted as a sequence of colored vertical lines, where each line represents a frame of approximately 20 milliseconds. The frame-level features are averaged over the duration of each phoneme, providing a compact representation of the phonetic content of each phoneme (depicted at the top of the figure). The color intensity indicates the magnitude of the acoustic features at each time step.

Extracting Phoneme-Level Pronunciation Quality Features
From the reference text in Liu et al.’s (2023) read-aloud task, the Gruut toolkit (Hansen, 2021) was used to convert written words into International Phonetic Alphabet (IPA) phonemes. From this phoneme sequence, the model generates reference phoneme embeddings1 that represent expected pronunciation patterns learned from diverse speakers. Rather than relying on fixed, ideal pronunciations, these embeddings capture natural variation, enabling the model to numerically compare input speech and identify deviations that may affect intelligibility.
To assess pronunciation, phoneme-level acoustic features were concatenated with their corresponding reference phoneme embeddings, allowing the model to evaluate deviations from expert pronunciation. To further quantify the mismatches, we calculated the linguistic-acoustic similarity between the phoneme-level acoustic features and reference phoneme embeddings (Liu et al., 2023), which measures how closely the observed pronunciation aligns with the expected one. This similarity was then integrated into the existing representation to form phoneme-level pronunciation quality features.
Extracting Word-Level Features
A transformer network (Vaswani et al., 2017) analyzed phoneme-level pronunciation quality features to capture subtle pronunciation details, which were then aggregated into word-level features by averaging phoneme features within each word (see the sections Phoneme-Level Aggregation with Linguistic-Acoustic Similarity and Hierarchical Pronunciation Scorer in Appendix S1 in the online Supporting Information for details).
Extracting Utterance-Level Features and Pronunciation Scores
A transformer network analyzes word-level features to identify broader pronunciation patterns across the utterance. The resulting features are then averaged into an utterance-level feature, which is passed through a fully connected layer to produce a final pronunciation score.
In summary, the pronunciation score captures both segmental and suprasegmental aspects of speech. This comprehensive approach is feasible because the automatic pronunciation scorer's training is data-driven, tailored to match human ratings that assess three CEFR linguistic competence scales: overall phonological control, sound articulation, and prosodic features (see the Dataset Construction section for more detail). By training the pronunciation scorer to mirror these subconstructs, it automatically incorporates both segmental and suprasegmental pronunciation aspects at the frame, phoneme, word, and utterance levels. At the frame and phoneme levels, the scorer focuses on acoustic properties and temporal dynamics critical for identifying precise phoneme articulation. As features aggregate to the word and utterance levels, the scorer integrates information on word stress, sentence stress/rhythm, intonation, and connected speech. All of these elements impact overall intelligibility.
Adapting to Open-Response Pronunciation Assessments
The automatic pronunciation scorer described above was primarily designed for read-aloud tasks, which allow direct comparison between an L2 speaker's speech and a canonical text. In contrast, open-response speaking assessments reflect more dynamic and authentic use of language. These responses are typically longer, comprising multiple utterances. Therefore, the original pronunciation scorer, which evaluates single utterances against a fixed canonical written text, was adapted to assess spontaneous speech.
Extracting Reference Transcriptions
Figure 2 illustrates our proposed assessment pipeline for the open-response scenario. Initially, the Whisper ASR system (Radford et al., 2023), a large-scale trained DNN model, was employed to transcribe the spoken response. Table 1 provides examples of how Whisper ASR processes and transcribes speaking responses, illustrating its handling of disfluencies and pronunciation variations. As these examples illustrate, Whisper simplifies and clarifies the spoken responses by removing redundancies and hesitations (in gray) and making corrections (in blue). This cleaning process emphasizes the system's ability to capture the essential content of a response. The Whisper transcription therefore serves as a reference text, enabling the pronunciation scoring system, which was originally designed for read-aloud tasks, to be applied to open-response speech by aligning the spoken input with an automatically generated transcript.

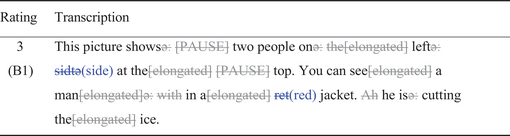 |
- Note. [PAUSE] represents noticeable pause. Gray words with strikethrough indicate deletions. Blue words with strikethrough indicate replacements.
Text Segmentation and Text–Audio Alignment
In open-response scenarios, we broke down paragraphs into smaller parts using text segmentation and text-audio alignment. Doing so helps reduce computational demands—particularly important for transformer-based models that require more memory with longer inputs. To achieve this goal, we first extracted text segments from the ASR transcription. These segments were created on the basis of punctuation marks (“.”, “?” and “!”) and then further divided or merged to ensure that each contains 10–35 words. Next, we aligned these text segments with their corresponding audio using a forced alignment algorithm so that the audio matched the segmented transcription (see Appendix S1 in the online Supporting Information for further details).
Using these speech segments and their reference transcriptions, the hierarchical pronunciation scorer was applied to each segment to estimate the pronunciation proficiency score. The pronunciation score for the entire speaking response was calculated as the weighted average of the scores for each segment, with weights proportional to the duration of each segment.
Dataset Construction: Human Ratings Pronunciation Dataset
In this section we describe the creation of the training dataset, the rubrics used to assign gold-standard labels, and the rater training procedures and their rates of agreement. To train and evaluate new automatic pronunciation scorers, we created a gold-standard dataset of pronunciation ratings from expert human raters. Human ratings are used extensively as part of the training and evaluation of the DET's writing and speaking graders, as described by Cardwell et al. (2024). However, unlike previous human rating datasets that scored overall writing/speaking proficiency holistically, the ratings in this dataset focused on the subconstruct of pronunciation.
In total, 2,624 individual speaking samples from 1,312 test takers were rated (Table 2). This total is a combination of three subdatasets: (a) a pilot subset, (b) the main subset of L2 English test takers, and (c) the main subset of L1 English test takers. Unlike other pronunciation rating datasets (e.g., Zhang et al., 2021), the samples in the dataset are representative of DET test takers with respect to background and proficiency across all six CEFR levels, including pronunciation ability. The inclusion of L1 English speakers as a baseline comparison group for pronunciation assessment is common practice in L2 speech intelligibility research (e.g., Kang, 2010).
| Subdataset | # Samples | Double-rated |
|---|---|---|
| Pilot | 312 | 312 (100%) |
| Main | 2,312 | 469 (20.3%) |
| L2 English | 2,060 | 427 (20.7%) |
| L1 English | 252 | 42 (16.7%) |
- Note. L1 = first language; L2 = second language.
The pilot dataset was created primarily to trial all elements of the procedure described below, including the appropriateness of the rubrics and the length of the speech samples. On the basis of the pilot dataset, the rubrics were amended slightly, but otherwise no other changes were deemed necessary. In addition, the pilot ratings were used as benchmarks as part of the training and standardization materials for the raters. In the main subset, approximately 20% of all ratings were double-rated to ensure rater reliability while still considering practicality. Among these double-rated samples, only five resulted in a rating difference of two (on a scale from 1 to 6), and no differences were greater than two. These five responses were adjudicated by a third rater.
Dataset Compilation
Prior to creating the dataset, we decided that the ideal sample length would be approximately 30 seconds, rather than the entire test taker responses, which have maximum durations of 1 to 3 minutes, depending on the task. We chose this sample length to balance the shorter length preferred for machine learning with the longer length desired for human raters. This decision was also informed by reliability research, which shows that human rater reliability improves up to 30 seconds (compared to 5 and 10 seconds) but does not show further improvement at 60 seconds (Cucchiarini et al., 2002; Moran et al., 2019).
To compile the dataset, we extracted approximately 30-second segments from the original speaking responses using text–audio alignment. The segments were selected at the utterance level, with each segment defined by end sentence punctuation (“.”, “?”, “!”) in the transcription. Consecutive utterance segments were combined to ensure the total duration was approximately 30 seconds. From these segments, one was randomly selected from the available options. This method ensured that there were no mid-utterance or mid-word cuts in the extracted segments. These segments underwent no preprocessing steps, such as voice activity detection or enhancement, which might otherwise have influenced the integrity of the raw data.
-
Gender: Even balance of male and female.
-
Proficiency: Even balance of test taker speaking proficiencies as estimated by an ML classifier trained to predict the human CEFR rating of a speaking response. Because there are limited numbers of test takers at the highest (CEFR C2) and lowest (CEFR A1) levels, there was not an even distribution in the final dataset.
-
L1 of L2 English test takers: For the L2 English subset, the 29 most frequent L1s were selected, as these account for over 90% of all test takers during the sampling period. These 29 L1s were categorized into 13 groups according to language family and region, as detailed in Table 3.
-
L1 variety of L1 English test takers: For the L1 English dataset, we filtered all test takers who reported English as their L1 and who submitted identification from countries that have English as a national language. All of these except for 32 test takers (from Malta and Guyana) could then be categorized in one of seven regions: North America; United Kingdom and territories and Ireland; Oceania; Africa; South Asia; Southeast Asia; and Caribbean.
| Region | Family | Language | # Responses | # Test Takers |
|---|---|---|---|---|
| Sino-Tibetan | Mandarin, Cantonese, Burmese | 188 | 94 | |
| East Asia | Japonic | Japanese | 156 | 78 |
| Koreanic | Korean | 178 | 89 | |
| Indo-Aryan | Hindi, Urdu, Bengali, Punjabi, Gujarati, Nepali | 186 | 93 | |
| Southeast Asia | Dravidian | Telugu | 174 | 87 |
| Austronesian | Indonesian, Tagalog | 184 | 92 | |
| Austroasiatic | Vietnamese | 162 | 81 | |
| Eastern Europe / Central Asia | Slavic | Russian, Ukrainian, Uzbek | 210 | 105 |
| Europe | Romance | Spanish, Portuguese, French, Italian, Romanian | 230 | 115 |
| Germanic | German | 158 | 79 | |
| English | 276 | 138 | ||
| Western Asia | Turkic | Turkish | 176 | 88 |
| Middle East / North Africa | Semitic | Arabic, Amharic | 184 | 92 |
| Indo-Iranian | Farsi, Pashto | 162 | 81 |
In following this stratification scheme, we sought to ensure a diverse sample of test takers, especially in terms of accent/English variety, representative of the global DET test taker population.
Rubrics
The rubrics used to assign the pronunciation ratings consist of a scale from 1 to 6, corresponding to CEFR bands A1 to C2 (Appendix S2 in the online Supporting Information). Each score point is accompanied by the descriptors from three CEFR linguistic competence scales: overall phonological control, sound articulation, and prosodic features. However, these scales were not rated separately as analytic ratings but as one holistic rating. The descriptors were slightly edited after the piloting process. These rubrics can be seen to encompass key aspects of pronunciation including segmental features, prosodic features, and perceived intelligibility/comprehensibility. In addition, raters had the option to mark responses as having poor audio quality or as having insufficient language to accurately assess pronunciation. These samples were then excluded from further analysis.
Raters
Four expert human raters were used in this project: two “in-house” raters for the pilot subset and two “contractor” raters for the main subset. The two in-house raters developed and refined the rubrics and training materials on the basis of their piloting. The two contractor raters then underwent training and certification prior to commencing their rating (delivered by the lead in-house rater using selected samples from the pilot data). All contractor ratings were completed independently, and monitoring and feedback were provided by the lead in-house rater.
Rater Agreement
All reported agreement rates refer to the 421 double-rated items in the main subset after filtering out nonvalid responses. Three common rater agreement measures were used, quadratic weighted kappa (QWK), Spearman's rank correlation coefficient (Spearman's ρ), and two-way random single-score intraclass correlation coefficient (ICC). The agreement values for each of these measures are provided in Table 4. Regardless of the measure used, the agreement rates were very high according to the interpretation guidelines described above. Overall, for valid double-rated responses, the mean contractor ratings were 3.67 (4.0 median) and 3.57 (4.0 median), respectively. On the basis of these results, we could confidently conclude that the two raters have high interrater agreement in terms of assigning CEFR bands, regardless of test taker proficiency level, and as a result, the single-rated ratings can be considered reliable for research and development purposes.
| Agreement Measure | Agreement Rate | Interpretation |
|---|---|---|
| Quadratic weighted Kappa | .85 | Very good agreement |
| Spearman's rank correlation | .84 | High correlation |
| Intraclass correlation | .85 | Excellent agreement |
Empirical Evaluation
In this section, we present the results of a comprehensive empirical evaluation of our automatic pronunciation scorer. We compared its performance to several baselines and assessed its fairness. This evaluation provided insights into the scorer's reliability, accuracy, and potential biases, ensuring its robustness and applicability in high-stakes language assessments.
Experimental Setups
Implementation Details
We processed the dataset and then trained and evaluated our automatic pronunciation scorer on the human ratings. The dataset was first transcribed using the large-sized Whisper model and then processed with text segmentation and text–audio alignment to generate speech segments, following the method described in the Automatic Pronunciation Scorer Development section. On average, each segment had a duration of 11.9 seconds and the total duration of all segments by response was about 26.5 seconds. The distribution of segments per response was as follows: 537 responses had one segment, 968 responses had two segments, 675 responses had three segments, 155 responses had four segments, and 20 responses had five segments (see Appendix S1 in the online Supporting Information for further details). To robustly assess the scorer, we employed a 5-fold cross-validation method, whereby the data was randomly divided into five subsets. In each validation cycle, one subset was used for testing, and the others were used for training. This method ensured that each data segment was used for both training and testing across the validation cycles.
Comparing Baselines
We evaluated the proposed automatic pronunciation scorer against four baseline systems.
Goodness of Pronunciation Scores
GOP is a dominant machine learning method for phoneme-level pronunciation feedback in CAPT (see the Machine Learning Methods on Pronunciation Assessment section). In our implementation, the GOP score was calculated on the basis of the transcription obtained from the large-sized Whisper model. The GOP score for each specific phoneme was computed, utilizing the phoneme recognition acoustic model (Appendix S1 in the online Supporting Information). The overall GOP score was then calculated by averaging the GOP scores for each reference phoneme in the response.
Automated Speech Recognition Scores
The ASR confidence score reflects the ASR model's confidence in recognizing speech. It is used as a proxy feature to measure the pronunciation quality of the test takers’ responses (see the Extracting Reference Transcriptions section). In our experiment, we used the medium size Whisper ASR model (Radford et al., 2023) to provide ASR scores.
Microsoft's Pronunciation Assessment
Microsoft's Pronunciation Assessment (MPA) represents the SOTA commercial speech assessment service. For each speaking response, MPA provides an overall score reflecting pronunciation quality, derived from a weighted combination of accuracy, fluency, and completeness scores. Additionally, MPA evaluates the prosody of each response, offering a separate prosody score.2 We use the large-size Whisper ASR model to get transcripts for MPA.
Proposed Automatic Pronunciation Scorer Trained With Speechocean762 Dataset
To evaluate the effectiveness of using construct-aligned human ratings for training our pronunciation scorer, we compared it against a model trained on the Speechocean762 dataset (Zhang et al., 2021). This comparison evaluated our assumption that it is important to have representative data with construct-aligned ratings. Unlike our dataset, which consists of free speech from diverse L1 backgrounds with construct-aligned pronunciation ratings, Speechocean762 is a Mandarin L1 read-aloud dataset with ratings based on accuracy, fluency, completeness, and prosody. Additionally, each utterance in the Speechocean762 dataset has a shorter duration, averaging 4.3 seconds.
Experimental Results
In this section, we present the empirical evaluation of our automatic pronunciation scorer and compare its performance, along with that of several baseline scorers, against construct-aligned human ratings. We evaluated performance using Spearman's ρ and QWK between the machine scores and the human ratings. When calculating QWK, we trained an isotonic regression model to project continuous ratings onto the human rating scale and rounded the results to obtain discrete scores (1–6). Table 5 presents the results of the proposed pronunciation scorer compared to other baseline systems.
| Method | Spearman's ρ | 95% CI | QWK | 95% CI |
|---|---|---|---|---|
| Human Interrater* | .86 | [.84, .88] | .87 | [.84, .88] |
| GOP Scorer | .66 | [.64, .68] | .60 | [.58, .65] |
| Whisper (Medium) ASR Scorer | .72 | [.71, .74] | .69 | [.67, .72] |
| MPA Prosody Scorer | .77 | [.75, .78] | .71 | [.69, .74] |
| MPA Pronunciation Scorer | .75 | [.74, .77] | .70 | [.68, .73] |
| Proposed Pronunciation Scorer trained with Speechocean762 | .71 | [.69, .73] | .65 | [.63, .68] |
| Proposed Pronunciation Scorer | .82 ± .02 | [.81, .84] | .81 ± .01 | [.80, .83] |
- Note. *The interrater correlation coefficients here were calculated from the entire Duolingo English Test pronunciation dataset rather than just the main subset. GOP = goodness of pronunciation; ASR = automated speech recognition; MPA = Microsoft's Pronunciation Assessment; QWK = quadratic weighted kappa.
Among all baseline systems evaluated, the GOP scores exhibited the weakest performance, Spearman's ρ = .66, QWK = .60. The ASR scores, Spearman's ρ = .72, QWK = .69, derived from the Whisper model, demonstrated improved performance over GOP.
MPA prosody scores, Spearman's ρ = .77, QWK = .71, consistently outperformed all other baseline methods, likely due to the critical role that prosodic features play in the assessment of spontaneous speech. MPA pronunciation scores, Spearman's ρ = .75, QWK = .70, exceed those of the GOP scores and Whisper ASR scores but fall short of the MPA prosody score.
When assessing the effectiveness of the proposed pronunciation scorer, the choice of training dataset plays a critical role in the scorer's performance. Comparative results demonstrate that the scorer trained on the DET's construct-aligned human ratings pronunciation dataset, Spearman's ρ = .82, QWK = .81, substantially outperformed the one trained on the Speechocean762 dataset, Spearman's ρ = .71, QWK = .65.
The proposed pronunciation scorer outperformed all baseline systems, nearly matching the correlation scores of human raters. The Steiger's (1980) test, which tests for significant differences between correlation coefficients, shown in Table 6, further validates the proposed pronunciation scorer. The statistically significant differences in correlation scores indicate that it consistently outperformed baseline systems in alignment with human ratings.
| Method | z-statistic | p-value | 95% CI |
|---|---|---|---|
| GOP Scorer | 20.05 | < .001 | [17.99, 21.97] |
| Whisper (Medium) ASR Scorer | 13.89 | < .001 | [11.81, 15.91] |
| MPA Prosody Scorer | 9.46 | < .001 | [7.40, 11.70] |
| MPA Pronunciation Scorer | 11.68 | < .001 | [9.48, 13.77] |
| Proposed Pronunciation Scorer trained with Speechocean762 | 16.44 | < .001 | [14.38, 18.45] |
- Note. GOP = goodness of pronunciation; ASR = automated speech recognition; MPA = Microsoft's Pronunciation Assessment
Evaluating Bias With Differential Feature Functioning Analyses
To evaluate the fairness of our automatic pronunciation scorer, we used differential feature functioning (DFF) analysis (Zhang et al., 2017) to determine whether our developed pronunciation scorer or any of the baselines had bias with respect to different subgroups of test takers. In the context of pronunciation scoring, DFF refers to a phenomenon where a subgroup of test takers tends to receive higher or lower feature values than other subgroups of test takers of the same proficiency.
In this model, b0 is the intercept representing the expected value of Fi when Gi and θi are both zero. The error term ϵ captures the variation in Fi that is not explained by the grouping variable Gi or the proficiency variable θi. The grouping variable Gi is binary. We tested DFF of 16 distinct groups, including gender, operating system (Windows or Mac—a proxy for socioeconomic status), and 13 language family groups3 as detailed in Table 3. For the gold-standard language proficiency variable θi, we used human rating of pronunciation. Both the pronunciation score Fi and the language proficiency θi were normalized (zero mean and unit standard deviation) to ensure that the regression coefficients were interpretable across different scales of measurements.
Ideally, the pronunciation feature Fi should only be predicted by the proficiency variable θi without interference from the grouping variable Gi. In this case, the linear coefficient b1 of the grouping variable G should be 0, meaning that whether an individual belongs to the grouping (G = 1) or not (G = 0) has no impact on the prediction of this individual's pronunciation. On the contrary, if the regression coefficient b1 is statistically significantly different from zero, it suggests the presence of DFF with respect to the grouping variable G. This would mean that the subgroup represented by G = 1 systematically scores higher (b1 > 0) or lower (b1 < 0) on the feature Fi, independent of their overall language proficiency, compared to the subgroup for which G = 0.
In simpler terms, DFF occurs when a feature used in scoring behaves differently for certain subgroups, even if the subgroups have the same level of proficiency. For example, if male test takers (G = 0) score consistently lower than female test takers (G = 1) on a pronunciation feature, despite having the same overall language proficiency, this would indicate a bias in that feature. Such a bias would be concerning because it means the score is unfairly influenced by the test taker's group membership rather than their actual ability. Figure 3 shows the regression coefficients b1 for the grouping variable G across various automatic pronunciation scorers and 16 subgroups, highlighting whether any features exhibit significant bias for the tested subgroups. The error bars represent 95% confidence intervals for each estimate. Regression coefficients b1 with p-values smaller than .05 (indicated by a red dot) indicate the presence of potential DFF.

Gender Group Analysis
DFF analyses indicate that the proposed pronunciation scorer, whether trained on Speechocean762 or the DET's human ratings dataset, shows minimal bias with respect to gender.
Operating System Group Analysis
All pronunciation scoring methods consistently showed negative b1 values for the Windows operating system, likely due to greater variability in recording devices and environments compared to Mac, which has standardized hardware. Signal-to-noise ratio (SNR)4 analysis showed that Mac recordings had a higher average SNR (31 ± 7 dB) compared to Windows (29 ± 7 dB), indicating better perceived audio quality. This may contribute to better performance in audio-based scoring systems. However, other variables, such as microphone quality, recording environments, and user behavior, may also play a role.
Our automatic pronunciation scorer exhibited a more pronounced b1 compared to other methods. This discrepancy is likely because the DET's human-rated pronunciation dataset contains a significantly larger amount of data from Windows users—approximately 2.5 times more than from Mac users—with normalized mean ratings of −0.14 for Windows versus 0.34 for Mac. This imbalance in the training data has led the scorer to learn to associate lower audio quality with lower pronunciation scores. In the Discussion section, we consider how to mitigate this issue and enhance the fairness of our automatic scorer.
Language Family Group Analysis
This analysis compared a target language family group (e.g., Indo-Aryan) with all other language family groups (e.g., non-Indo-Aryan). Our pronunciation scorer generally performed well across most groups but still showed bias towards certain language families. Similar to the operating system group, this bias could be attributed to disparities in the training dataset between target and nontarget groups within these language families. For example, in our pronunciation dataset, an Indo-Aryan speaker has a lower normalized mean rating, x = − 0. 127, compared to non-Indo-Aryan speakers, x = 0. 009. Such discrepancies in data distribution may lead the automatic scorer to overfit to characteristics that disadvantage these language families in pronunciation scoring. Additionally, variables such as ASR and phoneme acoustic model performance might contribute to this bias. A discussion on how to address these biases and improve the fairness of our automatic scorer is provided below.
Discussion
The goal of this study was to develop and validate an automatic pronunciation scorer for high-stakes L2 assessment purposes that was built on a theoretically and empirically grounded construct of L2 pronunciation. There were three research questions that the study addressed: (a) the extent to which a SOTA automatic pronunciation scorer could be adapted to predict construct-aligned human ratings of L2 pronunciation; (b) how the adapted automatic pronunciation scorer compared to existing baselines when predicting construct-aligned human ratings of L2 pronunciation; and (c) the extent to which the developed automatic pronunciation scorer showed evidence of differential feature functioning.
Automatic Pronunciation Scorer Development Outcomes
In response to the first research question, we developed a dataset of human ratings of pronunciation aligned with the CEFR standards and recent developments in L2 pronunciation, which centered intelligibility and comprehensibility as key aspects of pronunciation. We then built a pronunciation scorer based on recent advancements in machine learning, which is trained and evaluated on the developed pronunciation dataset.
To ensure the quality and reliability of our developed pronunciation dataset, we first analyzed the interrater agreement among human raters. Human raters demonstrated high interrater agreement, as evidenced by Spearman's ρ, QWK, and ICC. This high agreement rate is evidence of the quality of the rubrics and rater expertise and thus, evidence supporting the validity of the pronunciation construct defined in this study. The interrater reliability reported in the study is comparable with that reported in existing meta-analytic studies of L2 pronunciation constructs (e.g., Plonsky & Derrick, 2016; Saito, 2021). The observed consistency of rater judgements suggests that the construct of L2 pronunciation was well-defined in the rubrics and that the raters were able to effectively apply the definition in assigning the scores.
High interrater reliability provided a foundation for the training and evaluation of the automatic pronunciation scorer. The proposed pronunciation scores demonstrated a strong, positive correlation with human ratings. In fact, the observed correlations were stronger than correlations observed in other similar studies, such as Ramanarayanan et al. (2017), who compared human and automatic scoring of pronunciation features in human–machine spoken interactions (Spearman's ρ between .54 and .61 for interrater agreement and between .47 and .58 for human–machine agreement), and Hong and Nam (2021), who evaluated the reliability of an automatic pronunciation scorer, r = . 43 and r = .50 for human–machine agreement. Importantly, the human–machine correlations in this study nearly matched those demonstrated by human raters amongst themselves. This observation implies that the ability of the developed pronunciation scorer to assess L2 speakers’ English pronunciation was very close to that of humans who used rubrics aligned with the field definition of effective L2 pronunciation. This high level of agreement between human raters and the automatic scorer boosts confidence in the accuracy and reliability of the scorer, suggesting that the scorer can effectively capture the target L2 pronunciation construct.
Developed Automatic Scorer's Performance Compared to Other Automatic Scorers
To address the second research question, we evaluated the efficacy of the developed pronunciation scorer in comparison to several existing baseline automatic scorers, namely GOP, Whisper ASR confidence score, MPA, and a Speechocean762-trained scorer. The developed pronunciation scorer exhibited superior agreement with human ratings, suggesting that it measured the pronunciation construct defined in the study more accurately than its counterparts.
This outcome underscores several features of our pronunciation scorer that separate it from the other automatic scorers and, possibly, play a role in making it more effective. First, in developing the automatic scorer, we clearly defined the construct of L2 pronunciation via rubrics that we aligned with the CEFR as well as the field's view on the construct. Additionally, in refining the automatic scorer, we used an L2 corpus that included speech of English learners from different L1 backgrounds, enhancing the scorer's applicability across various linguistic contexts. Furthermore, the alignment of the scorer with CEFR standards and L2 pronunciation research ensures that the scorer is comprehensive and standardized. The quality of the dataset used to train the scorer, including the diverse L1 backgrounds, length of speech files, and assessment standard-aligned human ratings of pronunciation, also emerged as a possible variable in enhancing the automatic scorer's performance, relative to the baseline scorers it was compared with.
Addressing Differential Feature Functioning
In addressing the third research question, we found no evidence of DFF by gender, consistent negative bias towards Windows operating systems, and negative bias towards two of the 14 language families. We discuss these potential biases in our developed pronunciation scorer, proposing various strategies to enhance fairness and accuracy.
Mitigating Differential Feature Functioning in Operating System Group
-
Expanding data variety: Simulating diverse recording conditions—such as background noise, room acoustics, and microphone differences—and training the model accordingly to help it adapt and assess pronunciation fairly across different environments.
-
Improving audio quality: Applying noise reduction techniques to enhance lower-quality recordings to help ensure that speech clarity does not disproportionately affect scoring.
-
Balancing data representation: Ensuring that recordings from both Windows and Mac users are evenly represented in the dataset to help prevent the automatic scorer from learning biases based on hardware differences rather than actual pronunciation ability.
Mitigating Differential Feature Functioning in Different Language Family Groups
The DFF analysis revealed biases in our developed pronunciation scorer related to specific language family groups, likely due to the underrepresentation of high- or low-proficiency speakers from certain language families. To reduce bias, refining the scorer with advanced training techniques and increasing data representation for affected groups can help ensure fairer pronunciation assessment across language backgrounds.
Conclusion
In exploring the three research questions, this study has demonstrated the viability of training a SOTA automatic pronunciation scorer for use in L2 pronunciation assessment. The new scorer shows high agreement with expert human raters and performs better than other SOTA scorers. The scorer demonstrated some bias based on the test taker operating system and language family; however, this bias can be mitigated through practical solutions, including the need for a more balanced and representative sample. The limitations of this version of the pronunciation scorer will have to be addressed prior to its operational use. Developing automatic pronunciation scorers requires substantial human and computational resources to ensure accurate unbiased measurement. Curating representative datasets, training human raters, and running models demand time, expertise, and access to large data and computational resources often unavailable to many researchers. Despite these challenges, such investment is justified, especially in high-stakes settings, as these automatic scorers expand the set of meaningful characteristics of spoken language that can be measured in order to assess test takers’ spoken proficiency and in turn provide more evidence to support interpretations and uses of test scores.
The development and validation of the exploratory automatic pronunciation scorer detailed in this study highlights the potential for significant advancements in the field of automated speech evaluation for high-stakes English language proficiency assessments. Additionally, it underscores the importance of triangulating methods across disciplines in developing automated scorers. By leveraging a SOTA hierarchical pronunciation scorer trained to integrate construct-relevant segmental and suprasegmental pronunciation features, the proposed automatic scorer aligns closely with human raters, demonstrating high correlation coefficients comparable to interrater agreement. This alignment underscores the scorer's ability to accurately reflect the nuanced construct of L2 pronunciation.
The empirical validation revealed that the automatic scorer not only surpasses traditional GOP and ASR methods but also effectively outperforms SOTA commercial systems like MPA. These findings indicate that the careful curation and alignment of training data to CEFR standards and linguistic research significantly enhance the scorer's performance.
Despite these successes, the study also uncovered areas requiring further refinement, particularly concerning DFF across various subgroups, such as operating systems (which perform with varying audio quality) and language families. Addressing these biases through data augmentation, balanced dataset compilation, and accent-inclusive modeling will be crucial for future iterations of the scoring system prior to operational use.
In conclusion, the proposed pronunciation scorer represents a robust tool for automated assessment, offering high reliability and validity in evaluating L2 English pronunciation. Continued enhancements, particularly in mitigating subgroup biases, will further solidify its utility in diverse educational and high-stakes testing environments.