Preparation and evaluation of cefquinome-loaded gelatin microspheres and the pharmacokinetics in pigs
Abstract
Cefquinome (CEF) is widely used for veterinary clinical applications because of its broad spectrum and high efficiency. However, frequent administrations are required due to its short elimination half-life. In this study, cefquinome sulfate gelatin microspheres (CEF-GMS) were prepared as a sustained-release formulation using emulsion chemical cross-linking technique. Physical properties, stability, sustained-release property in vitro, and pharmacokinetics in pigs were assessed. The morphology of CEF-GMS showed a good sphericity with porous structure on the surface, and the mean diameter was 8.80 ± 0.78 μm, with 90.60 ± 3.98% of the total in the range of 5–20 μm. There were no significant changes of all estimated indexes in the stability tests. In vitro drug release study showed that the release of CEF from CEF-GMS was much slower than that from crude CEF in a release medium. Pharmacokinetic characteristics were evaluated following intramuscular administration of CEF-GMS or Cefquinome sulfate injection (CEF-Inj) in pigs at a dosage of 4 mg CEF/kg body weight. The plasma drug concentration–time data of CEF-GMS and CEF-Inj were both best fitted by two-compartment models with first-order absorption, and the elimination half-life of CEF-GMS was almost 10 times that of CEF-Inj. Overall, CEF-GMS might be used as a sustained-release formulation of CEF for veterinary clinical applications.
1 INTRODUCTION
During the past several decades, cephalosporins have been widely used in human and veterinary medicine for preventing and treating bacterial infections. Cefquinome (CEF) is the first fourth-generation cephalosporin developed solely for veterinary use. It exhibits enhanced potency with few side effects (Maden et al., 2001), marked resistance to β-lactamases (Limbert et al., 1991) and high cellular outer membrane permeability (Bryskier, 1997) compared with the third-generation cephalosporin. CEF has a broad antibacterial spectrum of activity against both gram-positive and gram-negative bacteria, such as Streptococci, Staphylococci, Esherichia coli, Pseudomonas aeruginosa (Deshpande, Pfaller, & Jones, 2000; Limbert et al., 1991; Thomas, Thomas, & Wilhelm, 2006). The MIC50 and MIC90 of CEF are reported to be less than 0.06 μg/ml for Esherichia coli (Sheldon, Bushnell, Montgomery, & Rycroft, 2004). CEF has been extensively used for veterinary clinical applications to treat respiratory disease, mastitis and endometritis of livestock (Amiridis, Fthenakis, Dafopoulos, Papanikolaou, & Mavrogianni, 2003; Bradley & Green, 2009; Lang, Rose, Thomas, & Zschiesche, 2002; Moller & Hofmann, 1997). However, CEF is eliminated relatively rapidly in vivo, for its elimination half-life (T1/2β) after parenteral administration is quite short at the range of 0.5–6 hr for mice, dogs, cattle (Limbert et al., 1991), pigs (Li et al., 2008; Limbert et al., 1991), horse (Allan & Thomas, 2003), goats (Dumka, Dinakaran, Ranjan, & Rampal, 2013; Errecalde, Prieto, Puelles, Luders, & Garcia Ovando, 2001), sheep (Tohamy, 2011; Uney, Altan, & Elmas, 2011), chicken (El-Gendy, Tohamy, & Radi, 2009), and ducks (Yuan et al., 2011). This adverse characteristic requires frequent administrations of CEF to maintain its therapeutic level in clinical applications. Therefore, sustained-release formulations of CEF are urged to be developed in order to improve treatment compliance, reduce stress levels in animals and enhance preferred animal welfare.
Microspheres are considered as one of the most common drug controlled delivery carriers (Edlund & Albertsson, 2002). Among variety of excipients, gelatin has extensively been used for microspheres preparation because of its biodegradation, biocompatibility, nontoxicity, and low cost (Choy, Cheng, Choi, & Kim, 2008; Mladenovska, Kumbaradzi, Dodov, Makraduli, & Goracinova, 2002; Morimoto et al., 2001; Tielens et al., 2007). The release of entrapped drugs from gelatin microspheres (GMS) is controlled by drugs diffusion from both the intact and degrading microsphere matrix. Therefore, cross-linking procedures are required to reduce gelatin dissolution in aqueous environments, in order to limit the degradation rate of gelatin microspheres and then maintain its long-term drug release property (Leo, Vandelli, Cameroni, & Forni, 1997). In this study, cefquinome sulfate gelatin microspheres (CEF-GMS) cross-linked by glutaraldehyde were prepared as a sustained-release formulation for intramuscular administration, aiming to reduce the frequent administrations of CEF for veterinary clinical applications.
2 MATERIAL AND METHODS
2.1 Reagents and chemicals
The pure reference standard of cefquinome sulfate (80.1%, K0320906) was brought from the China Institute of Veterinary Drug Control. The raw material of cefquinome sulfate (86.4%, No. 20110702) was purchased from Qilu Synva Pharmaceutical Co. Ltd. (Shandong, China). Cefquinome sulfate injection (CEF-Inj, No. 110805) was got from Qilu Animal Health Products Co. Ltd. (Shandong, China). Gelatin was supplied by Cangzhou Xueyang Gelatin Co. Ltd. (Hebei, China). Polyethylene glycol 6000 (PEG 6000) was purchased from Jinan Synthetic Resins Co. Ltd. (Jinan, China). All other reagents and chemicals were of analytical grade purchased from Sinopharm Chemical Reagent Co. Ltd. (Beijing, China).
2.2 Animals
Sixteen clinically healthy pigs (25 ± 2 kg) were purchased from Jianfeng Animal Husbandry Co. Ltd (Hubei, China) for pharmacokinetic study, and were fed with a drug-free commercial diet to acclimatize to the temperature, humidity, light, and ventilation in the animal breeding room for 1 week before experimental treatment. The study was approved by the Bioethics Committee of the Huazhong Agricultural University.
2.3 Preparation of CEF-GMS
CEF-GMS were prepared using the reported emulsion chemical cross-linking method with some modifications (Tabata & Ikada, 1989). Some factors related to the preparation of unloaded GMS were investigated, including stirring rate, gelatin concentration in aqueous solution, temperature of emulsifying procedure, ratio of the water/oil phase, amount of emulsifying agent, cross-linking agent, and plasticizing agent. Orthogonal design test of L9 (34) was subsequently conducted to optimize process conditions. The optimum technology for preparation of unloaded GMS was presented as follows.
A mixture of 3 ml aqueous solution containing 0.3 g of gelatin and 0.015 g of PEG6000 was added to 50 ml of liquid paraffin containing 2 ml of Span-80, and both the water phase and oil phase were preheated to 60°C; Then, the biphasic system was thoroughly mixed to form a water/oil emulsion using a magnetic stirrer (S10-3, Sile instrument Co. Ltd., Shanghai, China), which was maintained at 60°C and 900 rpm for 15 min. Once formed, emulsion droplets were rapidly chilled to 5°C under continuous stirring in an ice bath and then solidified by adding 3 ml of glutaraldehyde; 20 ml of isopropanol was added to dehydrate the formed microspheres after 90 min cross-linking reaction. Finally, microspheres were rinsed by isopropanol, ethyl ether and petroleum ether successively to remove the remaining liquid paraffin and glutaraldehyde, then vacuum-dried overnight. Dried microspheres were sterilized by using gamma-ray radiation sterilization (cobalt-60) for 30 min. Cefquinome sulfate-loaded GMS were prepared on the base of optimum process conditions for unloaded GMS. Each microsphere sample was prepared three batches to verify reproducibility of the preparation technology.
2.4 Analysis of the particle size and morphological characteristics
The particle size and distribution range of CEF-GMS were measured by a micrometer under a light microscopy (XSP-M, Chongqing Optical and Electrical Instrument Co. Ltd., Sichuan, China). Morphological characteristics were observed by a scanning electron microscopy (SEM; JSM-639OLV, Jeol Ltd., Tokyo, Japan) after CEF-GMS samples were mounted on aluminum studs and sputter-coated with gold.
2.5 Determination of drug loading
 (1)
(1)2.6 In vitro drug release study
 (2)
(2)2.7 Stability of CEF-GMS
The stability of CEF-GMS was assessed by accelerated test and long-term test according to Guiding principles of stability tests for veterinary drugs (Chinese Veterinary Pharmacopoeia Committee, 2010a). Appearance, morphology, particle size, and drug loading of CEF-GMS were all examined. Accelerated test was performed at 40 ± 2°C/relative humidity (RH) 75 ± 5% for 6 months, and samples (n = 3) of CEF-GMS were evaluated after 1, 2, 3, and 6 months. Similarly, long-term test was conducted under 25 ± 2°C/RH 60 ± 10% conditions for 12 months, and samples (n = 3) of CEF-GMS were estimated after 3, 6, and 12 months.
2.8 Pharmacokinetics study
Sixteen pigs were randomly divided into two treatment groups (n = 8): CEF-GMS group and CEF-Inj control group. Each group was administrated at a dosage of 4 mg CEF/kg body weight via intramuscular injection. Blood samples (about 5 ml at each time point) were collected from the precaval vein at 0, 0.083, 0.25, 0.5, 1, 1.5, 2, 3, 4, 6, 8, 12, 24, 48, 72, 96, 120, and 144 hr after drug applications, and transferred into heparinized tubes immediately. Plasma was separated by centrifuged at 1,503 g for 10 min and stored at −20°C until analysis.
CEF extraction from plasma samples was conducted according to the classical protein precipitation separation method with some modifications (Cao & Lu, 2005). Briefly, a volume of 0.5 ml plasma was placed in a 2-ml plastic centrifuge tube after samples were thawed at room temperature, and 0.1 ml of 10% perchloric acid aqueous solution was added into the tube. Subsequently, the mixture was vortexed for 30 s, followed by being centrifuged at 18,407 g for 10 min. Finally, the supernatants were filtered and injected directly into the HPLC for analysis.
A standard calibration curve in the range of 0.05–10 μg/ml was established. Five replicates of control samples at each concentration of 10, 1 and 0.1 μg/ml were used to evaluate the extraction recovery and variation coefficient of inter and intra day (Wang et al., 2009). The limit of detection (LOD) and quantification (LOQ) of CEF was defined as the drug concentration resulting in a peak height three times and 10 times the signal noise (S/N ≥ 10), respectively. Extraction recovery was determined by comparing peak areas from processed plasma standard samples with those from the CEF standard in the mobile phase for each standard concentration. The variability in the peak area ratios at each concentration was determined as an indicator of the precision. The pharmacokinetic parameters of CEF-GMS and CEF-Inj were calculated using 3p97 program (version 1.0, edited by Chinese Society of Mathematical Pharmacology). The concentration–time profiles were analyzed by the compartmental method, and the lowest value of Akaike information criterion (AIC) was applied to select the best fitted model (Yamaoka, Nakagawa, & Uno, 1978).
2.9 Statistical analyzes
All data were presented as a mean value with its standard deviation (mean ± SD). Statistical analyzes were performed using GraphPad Prism 5 software. Student's t test was used to compare CEF-GMS group with CEF-Inj group, p < .05 was considered statistically significant.
3 RESULTS
3.1 Preparation of CEF-GMS
The single-factor test indicated that four process conditions played significant roles in the preparation of unloaded microspheres: stirring rate, gelatin concentration, amount of emulsifying agent, and ratio of the water/oil phase. In this study, the mean diameter of microspheres was found to decrease as the stirring rate increased from 500 to 1,100 rpm. However, too high speed resulted in low yield of microspheres because of splashing of the water/oil emulsion. Therefore, 900 rpm of stirring rate was determined in the end. Meanwhile, the size of microspheres was also significantly affected by gelatin concentration within a range, which indicated that the higher ratio resulted in the bigger microspheres. Span-80 was chosen as an emulsifying agent to mix the water phase and oil phase into homogeneous water/oil emulsion. Once the emulsion was inhomogeneous, the morphology of microspheres was observed as concave on their surfaces. Moreover, the ratio of water/oil phase also played an important role in the adhesion degree of microspheres, and PEG6000 was used as a plasticizing agent to reduce aggregation of microspheres. Appropriate water/oil ratio could guarantee the good dispersion of microspheres produced.
On the base of optimum process conditions for preparing unloaded gelatin microspheres, various weight ratios of CEF/gelatin were investigated for the preparation of cefquinome sulfate-loaded gelatin microspheres. As shown in Table 1, the ratio of CEF/gelatin had no great effect on the particle size of CEF-GMS, but played an important role in the drug loading which decreased along with the reducing of the ratio of CEF/gelatin. However, too high amount of CEF would influence the sphericity of CEF-GMS and result in a waste of CEF. Therefore, the ratio of CEF/gelatin was appropriately determined to be 1:3.
| CEF: gelatin | Mean diameter (μm) | Drug loading (mg/g) |
|---|---|---|
| 1:1 | 10.27 ± 2.23 | 49.21 ± 7.33 |
| 1:2 | 8.62 ± 1.12 | 42.92 ± 6.16 |
| 1:3 | 8.46 ± 0.83 | 37.43 ± 1.76 |
| 1:4 | 8.01 ± 0.77 | 24.59 ± 3.24 |
| 1:6 | 8.82 ± 0.85 | 12.37 ± 1.91 |
| 1:8 | 9.57 ± 1.68 | 8.66 ± 1.57 |
3.2 Characterization of CEF-GMS
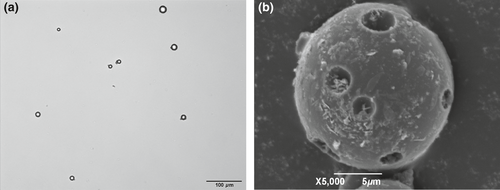
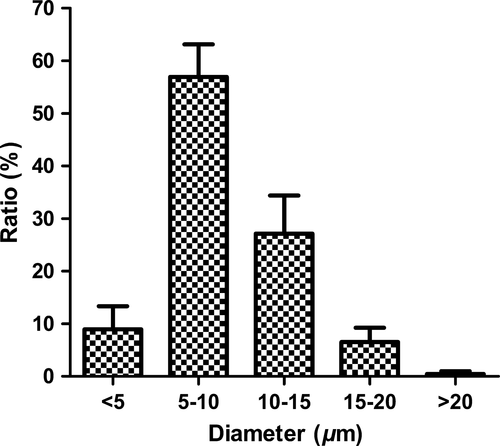
Both the optical and SEM photomicrographs of CEF-GMS showed that the particles appeared spherical in shape, and SEM images further revealed the porous structure and CEF crystals on the surface of CEF-GMS (Figure 1). Six batches of CEF-GMS were prepared to investigate the reproducibility of this preparation technology. Drug loading of CEF-GMS was calculated to be 37.89 ± 1.34%. The mean particle size of CEF-GMS was averaged to be 8.80 ± 0.78 μm by choosing 500 particles randomly, with 90.60 ± 3.98% of the total in the range of 5–20 μm. The distributions of particle size were shown in Figure 2. In addition, particle aggregation or fusion was rarely observed.
There were no significant changes of appearance, morphology, and particle size of CEF-GMS in the stability tests, except that a few microspheres were adhesive with each other at 4°C/RH75% after 6 months storage. Drug loading of CEF-GMS became to be 37.51 ± 0.42% after 6 months in the accelerated test and 37.19 ± 0.30% after 12 months in the long-term test (n = 3), neither of which was significantly different compared with that before storage.
3.3 In vitro drug release study
In vitro release study of CEF-GMS and free CEF was carried out in PBS (pH 7.4) within 5 hr (Figure 3). At each time point, the amount of released CEF was determined by withdrawing 5 ml release medium from six parallel dissolution cups and the results averaged. As shown in Figure 3, 90.88 ± 3.17% of loaded CEF released from CEF-GMS. In addition, an initial burst release of 38.89 ± 1.79% was observed within the first 0.5 hr, followed by a sustained release for the subsequent 4.5 hr. However, in the free CEF group, almost all of CEF (92.22 ± 1.65%) was dissolved in the release medium within a short time (0.75 hr) under the same experimental conditions. The above results suggested that CEF-GMS prepared in this study could greatly prolong CEF release in vitro.
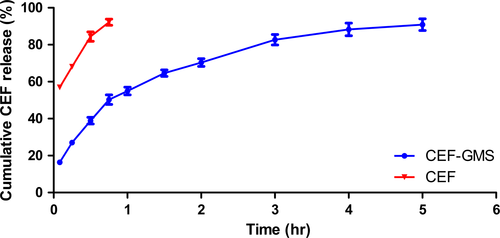
After model fitting, release profiles of CEF-GMS and free CEF were best fitted with Higuchi equation (Mt/M∞ = 38.999 t1/2 + 11.354, r = .9829) and First-order kinetics equation (Ln (1−Mt/M∞) = −2.617 t−0.5638, r = .9970), respectively.
3.4 Pharmacokinetic study
The calibration curve for CEF in pigs’ plasma was linear at the range of 0.05–10 μg/ml (r = .9999). LOD and LOQ were 0.025 and 0.05 μg/ml, respectively. The extraction recovery was 82.15 ± 4.20%, 80.53 ± 3.74%, and 79.37 ± 3.24% for 10, 1 and 0.1 μg/ml, respectively. Variation coefficients were 2.824%, 3.436%, 3.386% for intraday, and 4.08%, 4.64%, 5.11% for interday at different concentrations of 10, 1 and 0.1 μg/ml, respectively.
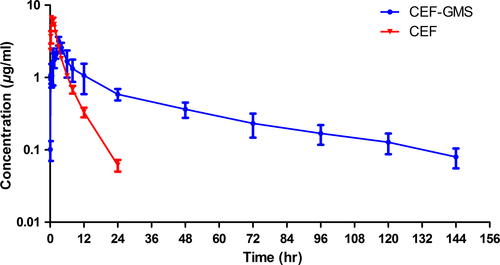
Sixteen healthy pigs were used in the pharmacokinetics study. The mean plasma drug concentration–time profiles of CEF detected in pigs after intramuscular administration of CEF-GMS and CEF-Inj at a dosage of 4 mg CEF/kg body weight were shown in Figure 4. Plasma concentration of CEF in CEF-Inj group declined quickly after topping at about 1 hr, became closed to the LOQ at 24 hr, and could not be detected at 48 hr. However, CEF could still be quantified in plasma of pigs at 144 hr after CEF-GMS administration. The concentration–time profiles of CEF-GMS and CEF-Inj were both fitted by two-compartment models with first-order absorption, and pharmacokinetic parameters of the two groups were summarized in Table 2. All parameters reflected the characteristics of the two formulations on absorption, distribution, and elimination in pigs.
| Parameters | Units | CEF-Inj | CEF-GMS |
|---|---|---|---|
| Ka | hr−1 | 2.527 ± 0.311 | 0.908 ± 0.569** |
| α | hr−1 | 0.729 ± 0.073 | 0.231 ± 0.069** |
| β | hr−1 | 0.157 ± 0.008 | 0.015 ± 0.001** |
| T 1/2Ka | hr | 0.279 ± 0.035 | 1.109 ± 0.698* |
| T 1/2α | hr | 0.959 ± 0.094 | 3.277 ± 1.088** |
| T 1/2β | hr | 4.437 ± 0.239 | 45.899 ± 3.029** |
| AUC | μg hr/ml | 24.604 ± 1.984 | 61.187 ± 16.644** |
| T P | hr | 0.771 ± 0.056 | 2.799 ± 1.373** |
| C max | μg/ml | 6.428 ± 0.637 | 2.438 ± 0.366** |
| V/F(c) | L/kg | 0.402 ± 0.041 | 1.059 ± 0.206** |
| CL(s) | L/(kg hr) | 0.164 ± 0.014 | 0.069 ± 0.018** |
- Ka, absorption rate constant; α, distribution rate constant; β, elimination rate constant; T1/2Ka, absorption half-life; T1/2α, distribution half-life; T1/2β, elimination half-life; AUC, area under the concentration–time curve; TP, the time point of maximum plasma concentration of the drug; Cmax, the maximum plasma concentration of the drug; V/F(c), apparent distribution volume; CL(s), total body clearance. *p < .05, **p < .01.
4 DISCUSSION
For now, 2.5% CEF suspension in ethyl oleate is available as an injectable product on the market, which may relieve the rapid elimination of CEF to some extent, for the T1/2β of CEF suspension in coho salmon is as long as 20.56 hr (San Martin, Bataglia, Hernandez, Quiroz, & Canon, 1998), and that in camels is 10.24 hr (Al-Taher, 2010). In this work, CEF was entrapped in microspheres, and the sustained-release property of CEF-GMS was evaluated by in vitro and in vivo studies.
An initial burst release of CEF from CEF-GMS was observed in vitro drug release study, which might be largely due to porous structures of CEF-GMS (Ahmed, Dashevsky, & Bodmeier, 2000; Yang, Chia, & Chung, 2000) and drug crystals absorbed on the surface of CEF-GMS (Francis et al., 2011). For controlled release drug delivery systems, too high initial burst release may lead to drug waste (Huang & Brazel, 2001), even drug concentration being near or above a toxic level in vivo (Jeong, Bae, & Kim, 2000; Shively, Coonts, Renner, Southard, & Bennett, 1995). In this study, the initial burst release of 38.89 ± 1.79% of total CEF within 0.5 hr conformed to the standard of Chinese Veterinary Pharmacopoeia (40%).
After the initial burst release, a controlled release of CEF from CEF-GMS was observed. A total of 90.88 ± 3.17% of loaded CEF cumulatively released from CEF-GMS within a period of 5 hr, whereas 92.22 ± 1.65% of CEF released from the free CEF group within 0.75 hr, suggesting that CEF was well-encapsulated in CEF-GMS. It was reported that the length of the sustained-release phase for microspheres was highly dependent on drug properties (Poletto, Jäger, Ré, Guterres, & Pohlmann, 2007), types of polymer used (Gu, Sun, Papadimitrakopoulos, & Burgess, 2016; Naraharisetti, Lew, Fu, Lee, & Wang, 2005), and the particle size of microspheres (Berkland, Kim, & Pack, 2003; Siepmann, Faisant, Akiki, Richard, & Benoit, 2004). Among these factors, the particle size of microspheres played a significant role in the release rate of encapsulated drugs by affecting the surface area/volume ratio and secondary effects including the drug distribution in particles, polymer degradation rate, and microspheres erosion rate (Berkland et al., 2003). The effect of surface area/volume ratio on drug release was to decrease the release rate with increasing microsphere size. For example, the sustained-release time for 77% curcumin from the curcumin loaded gelatin microspheres (C-GMS) prepared by Cao's group (2011) reached to 48 hr, exhibiting longer sustained-release time than CEF-GMS prepared in this work. Besides different drug properties, it might be due to a decrease in surface area/volume ratio with increasing microsphere size, for the mean size of C-GMS (18.9 μm) was smaller than that of CEF-GMS (8.80 μm).
Furthermore, the particle size of microspheres was reported to be largely affected by the stirring rate in the emulsification process (Govender et al., 2005; Preda & Leucuta, 2003). Similar results were observed in this study, the mean diameter of GMS decreased as the stirring rate increased from 500 to 1,100 rpm. In addition, the mean diameter of GMS was also related with the solution viscosity which increased with gelatin concentrations in the emulsion phase. As reported in the published literature, greater viscosity would result in larger emulsion droplets and consequently in bigger microspheres (Liang, Chang, Lin, & Sung, 2003; Yang, Chung, & Ng, 2001).
Pharmacokinetic profiles of CEF-GMS and CEF-Inj were investigated in pigs after intramuscular administration at a single dosage of 4 mg CEF/kg body weight. The absorption half-life (T1/2Ka) of CEF-GMS was more than three times that of CEF-Inj, overcoming the limitation of quick absorption of CEF. In addition, the slower absorption would not affect its antibacterial effect, for the concentration of CEF after CEF-GMS administration at early 0.083 hr (0.10 ± 0.03 μg/ml, data not shown) had been higher than the MIC90 for Esherichia coli (0.06 μg/ml; Sheldon et al., 2004). The slower absorption of CEF-GMS was also consistent with its later Tp (the time point of maximum plasma concentration of a drug). The Cmax of CEF-GMS was much less than that of CEF-Inj, which might reduce adverse reactions due to dose dumping (Iwata, Nakamura, & McGinity, 1999). The area under the concentration–time curve (AUC) of CEF-GMS was more than two times that of CEF-Inj, revealing that more CEF was absorbed in blood for CEF-GMS group. The apparent distribution volume (V/F) of CEF was less than 0.5 L/kg due to its low lipid-solubility, which was consistent with previous studies (Li et al., 2008; Yang et al., 2009). However, the V/F of CEF-GMS was more than 1.0 L/kg, suggesting that the entrapped CEF distributed more widely in pigs. Furthermore, the T1/2β of CEF-GMS was almost 10 times that of CEF-Inj, indicating that CEF-GMS prepared in this study eliminated much slower from blood in pigs. By comparing with the CEF proliposomes, the T1/2β of which (16.503 ± 1.275) after intramuscular administration at a single dosage of 18 mg/kg in rabbits was only 1.89 times that of CEF-Inj (8.752 ± 0.846; Fu et al., 2013), it could be seen that CEF-GMS prolonged the release time of CEF more significantly. Additionally, the total body clearance (CL(s)) was also an indicator of elimination rate, and the smaller its value, the slower elimination rate was. Therefore, the smaller CL(s) of CEF-GMS than that of CEF-Inj further indicated the sustained-release characteristic of CEF-GMS. All above results reflected advantages of CEF-GMS on absorption, distribution, and elimination in vivo.
In conclusion, CEF-GMS, which were successfully prepared by emulsification-linkage method in this work, exhibited good morphology, shape, drug loading, and stability. The in vitro drug release study and pharmacokinetics study in pigs both demonstrated its sustained-release property, suggesting that CEF-GMS could overcome the limitation of rapid elimination of CEF and might be a promising formulation for veterinary clinical applications.
ACKNOWLEDGMENTS
The authors would like to thank Hubei Jianfeng Animal Husbandry Co. Ltd. for providing healthy pigs and kindness help in the period of pharmacokinetics study.
CONFLICT OF INTEREST
The authors report no conflicts of interest.


