Use of RNA-seq to determine variation in canine cytochrome P450 mRNA expression between blood, liver, lung, kidney and duodenum in healthy beagles
Abstract
RNA sequencing (RNA-seq) is a powerful tool for the evaluation and quantification of transcriptomes and expression patterns in animals, tissues, or pathological conditions. The purpose of this study was to determine the physiologic expression of cytochrome P450 (CYP) mRNA transcripts in whole blood, kidney, duodenum, liver, and lung in healthy, adult male (n = 4) and female (n = 4) beagles via RNA-seq. mRNA expression was above background (transcripts per million) for 45 canine CYPs, with liver, duodenum, and lung expressing a high number of xenobiotic metabolizing CYPs, while prominent endogenous metabolizing CYP expression was present in blood and kidney. The relative expression pattern of CYP2A13, 2B11, 2C21, 2D15, 2E1, 3A12, and 27A1 in liver, lung, and duodenum was verified through qPCR. This is the first global profiling of physiologic CYP mRNA expression in multiple canine tissues, providing a platform for further studies characterizing canine CYPs and changes in gene expression in disease states.
1 Introduction
Cytochrome P450 (CYP) constitutes the major enzyme family catalyzing oxidative metabolism of drugs and lipophilic xenobiotics. This family also serves an important role in endogenous synthesis and metabolism of steroid hormones, prostaglandins, bile acids, and eicosanoids. In humans, there are 57 functional genes and 58 pseudogenes, clustered into 18 families and 44 subfamilies based on their amino acid homologies (Zanger & Schwab, 2013). Important CYP families involved in drug metabolism include CYP1A, CYP2B, CYP2C, CYP2D, CYP2E, and CYP3A. These CYPs have been implicated in drug–drug interactions (DDI), acting as a substrate, inhibitor, or inducer to alter the pharmacokinetics of important drugs. Over-and under-expression among CYPs can lead to subtherapeutic doses or toxicities (Danielson, 2002). An additional complication is single nucleotide polymorphisms (SNP), which can cause amino acid changes, altering CYP expression and function in affected populations, potentially resulting in life-threatening adverse drug reactions or subtherapeutic dosing (Danielson, 2002; Zanger & Schwab, 2013). Advancement in the understanding of human CYP expression and metabolism has led to the development of genetic screening to identify individuals or populations who may be at greater risk for DDI. This level of pharmacogenetic understanding is lacking in veterinary patients, with limited information available regarding CYP expression profiles. Current knowledge of canine CYP includes sequencing of four CYP families (Blaisdell, Goldstein, & Bai, 1998; Trepanier, 2006), the identification of SNPs that lead to functional changes in CYP1A2, CYP2C41, and CYP2D15 metabolism, and protein quantification of seven CYPs in the liver and two CYPs in the intestine (Court, 2013; Heikkinen et al., 2015).
RNA sequencing (RNA-Seq) allows for the evaluation of the entire transcriptome of a tissue and has become a powerful tool for quantifying gene expression and transcripts, discovering alternative splicing sites, detecting gene fusions, mapping transcription pathways, and the detection of SNP (Chen, Wang, & Shi, 2011; Marguerat & Bahler, 2010). Short paired reads are aligned to a published genome, with alignment based upon selected conditions including mismatch frequency, indel, and exon junction call. Once mapped, transcript data can be quantified as unique counts and normalized via transcript per million (TPM), which takes into account the variation of transcript length and sequencing depth. By normalizing for these sources of variation, expression of different genes across tissues can be compared, giving an overview of the gene expression in disease states, tissues, or individual animals (Consortium, 2014).
RNA-seq has been used in physiologic studies to characterize the equine transcriptome (Stefaniuk & Ropka-Molik, 2016) and alterations in the transcriptome of Holstein milk over a 250-day period (Wickramasinghe, Rincon, Islas-Trejo, & Medrano, 2012). Pathological conditions such as changes in the immune response of sheep to Fasciola hepatica (Rojas et al., 2015) and pathway analysis of canine lymphoma (Mooney et al., 2013) highlight the use of RNA-seq in monitoring alterations in the transcriptome in response to disease states. Armed with the canine genome, drug-induced toxicities caused by drug transporter mutations in P-glycoprotein have been characterized, allowing for the development of genetic screening to identify at-risk dogs (Mealey, 2013). CYP SNP has been implicated in alterations in the metabolism of nonsteroidal anti-inflammatory drugs, causing altered pharmacokinetics in celecoxib (Paulson et al., 1999).
The published canine genome consists of annotations, describing the location, size, exons, and introns of each gene(Ashurst & Collins, 2003). Annotations are based on curation by researchers targeting specific genes and automated programs such as Ensembl, which predicts annotations based upon a combination of gene sequences placed in public databases, gene orthologues from other species, and protein homology (Curwen et al., 2004). Annotations are constantly evolving, with manual curations improving gene boundaries and next generation sequences providing vast amounts of data from individual animals allowing for the identification of SNP (Aken et al., 2016; Cunningham et al., 2015).
The purpose of this study was to quantify and compare CYP mRNA expression in the liver, kidney, lung, duodenum, and blood via RNA-seq, providing a global overview of the CYP transcriptome in the healthy canine. Sites were selected for evaluation due to their importance in determining pharmacokinetic parameters such as absorption, metabolism, distribution, and excretion in the canine.
2 Methods
Subjects acted as a control group for a separate study. All protocols were approved by the Institutional Animal Care and Use Committee (IACUC) at Zoetis.
2.1 Sample collection
Male (n = 4) and female (n = 4) healthy 18-month-old purpose-bred beagles (Marshall Farms) were euthanized via injection of sodium pentobarbital. One tissue sample per animal for blood (n = 8), and sections of liver (n = 8), kidney (n = 7), lung (n = 8), duodenum (n = 8) were collected. One kidney sample (F) was not collected. Blood (PAXgene Blood RNA Tube, PreAnalytiX, Hombrechtikon Switzerland) and tissues (RNAlater®, Qiagen, Valencia, CA, USA) were kept frozen at −80◦C until processing. Liver and kidney total RNA was isolated using the RNA Mini protocol (Qiagen®, Valencia, CA, USA), lung and duodenum isolated using the Fibrous RNA protocol (Qiagen®), and blood using PAXgene Blood RNA Kit, PreAnalytiX (Qiagen®). RNA integrity number (Bioanalyzer 2100, Agilent Technologies, Santa Clara, CA, USA) and cDNA quality (NanoDrop 8000, ThermoScientific, Wilmington, DE, USA) were evaluated before individual tissue cDNA library preparation (Schroeder et al., 2006). cDNA library preparation was completed utilizing the TruSeq® Stranded mRNA sample preparation protocol (Illumina®, San Diego, CA, USA). Libraries were quantified (Quanti-IT® High-Sensitivity DNA Assay Kit, ThermoScientific, Grand Island, NY, USA), pooled into four lanes, and submitted for sequencing (Eureka Genomics®, Hercules, CA, USA).
2.2 RNA-seq analysis and statistics
RNA sequence QC and mapping were performed using CLC Genomics Workbench 9.0 (Qiagen®). Quality checks of RNA sequencing reads included statistics on the number of reads per tissue sample, base quality score, read length, GC content, and most frequent 15-mers. Reads were trimmed of low-quality bases and sequencing adapter contamination and mapped to the most recent canine annotated reference genome (CanFam 3.1, Ensembl release 81), a publicly available Boxer genome (Lindblad-Toh et al., 2005). To maximize the likelihood of detecting all CYPs in the genome, orthologues of human CYP annotations were identified via ENSEMBL Biomart, a data mining tool allowing for comparison between the annotated genome of two organisms. An extensive literature search was also carried out to ensure that all known canine CYP were accounted for (Table 1). Canine CYP2D15 was not present in ENSEMBL annotations but was available via the National Center for Biotechnology Information (NCBI, www.ncbi.nlm.nih.gov). Annotations which do not have an individual canine nomenclature were named based upon the human orthologue, denoted by * (ex: CYP3A*), and gene names found via NCBI was denoted by ^ (ex: CYP2D15^) (Geer et al., 2010).
| CYP | Ensembl canine ID | Chromosome | Gene start | Gene end |
|---|---|---|---|---|
| CYP11A1 | ENSCAFG00000017888 | 30 | 37,475,246 | 37,487,340 |
| CYP17A1 | ENSCAFG00000010279 | 28 | 15,292,522 | 15,299,029 |
| CYP19A1 | ENSCAFG00000015338 | 30 | 16,957,215 | 16,988,392 |
| CYP1A1 | ENSCAFG00000017937 | 30 | 37,793,073 | 37,800,053 |
| CYP1A2 | ENSCAFG00000017941 | 30 | 37,818,419 | 37,824,226 |
| CYP1B1 | ENSCAFG00000006164 | 17 | 30,269,745 | 30,278,554 |
| CYP20A1 | ENSCAFG00000012765 | 37 | 12,086,971 | 12,140,228 |
| CYP21 | ENSCAFG00000000712 | 12 | 1,450,677 | 1,453,734 |
| CYP24A1 | ENSCAFG00000011839 | 24 | 39,860,978 | 39,878,155 |
| CYP26A1 | ENSCAFG00000007574 | 28 | 7,428,543 | 7,432,724 |
| CYP26B1 | ENSCAFG00000009005 | 17 | 50,634,286 | 50,653,930 |
| CYP27A1 | ENSCAFG00000014943 | 37 | 25,366,035 | 25,401,253 |
| CYP27B1 | ENSCAFG00000000287 | 10 | 1,825,193 | 1,829,911 |
| CYP27C1 | ENSCAFG00000004542 | 19 | 23,375,348 | 23,399,773 |
| CYP2A13 | ENSCAFG00000032339 | 1 | 112,932,246 | 112,938,257 |
| CYP2A7^ | ENSCAFG00000031823 | 1 | 112,900,488 | 112,906,745 |
| CYP2B6 | ENSCAFG00000005052 | 1 | 112,817,437 | 112,833,488 |
| CYP2C21 | ENSCAFG00000008099 | 28 | 8,727,010 | 8,750,427 |
| CYP2D15^ | n/a | 10 | 23,255,259 | 23,259,380 |
| CYP2E1 | ENSCAFG00000013318 | 28 | 41,078,615 | 41,090,460 |
| CYP2F1 | ENSCAFG00000023821 | 1 | 112,974,519 | 112,985,841 |
| CYP2J2 | ENSCAFG00000018871 | 5 | 49,942,193 | 49,984,322 |
| CYP2R1 | ENSCAFG00000008504 | 21 | 37,550,262 | 37,579,759 |
| CYP2S1 | ENSCAFG00000005049 | 1 | 112,734,986 | 112,747,565 |
| CYP2U1 | ENSCAFG00000011203 | 32 | 28,425,473 | 28,444,361 |
| CYP2W1 | ENSCAFG00000011551 | 6 | 15,883,508 | 15,889,186 |
| CYP39A1 | ENSCAFG00000002026 | 12 | 14,727,773 | 14,817,905 |
| CYP3A12 | ENSCAFG00000014877 | 6 | 9,836,676 | 9,869,352 |
| CYP3A26 | ENSCAFG00000014942 | 6 | 9,777,663 | 9,815,345 |
| CYP3A* | ENSCAFG00000014939 | JH373739.1 | 21 | 13,206 |
| CYP3A43* | ENSCAFG00000014990 | 6 | 9,722,712 | 9,743,588 |
| CYP46A1 | ENSCAFG00000017838 | 8 | 68,072,603 | 68,097,030 |
| CYP4A37^ | ENSCAFG00000023282 | 15 | 13,604,130 | 13,623,797 |
| CYP4A38^ | ENSCAFG00000025004 | 15 | 13,638,745 | 13,657,531 |
| CYP4A11* | ENSCAFG00000023399 | 15 | 13,573,988 | 13,581,711 |
| CYP4A39 | ENSCAFG00000004169 | 15 | 13,663,448 | 13,675,044 |
| CYP4B1 | ENSCAFG00000004097 | 15 | 13,675,916 | 13,694,493 |
| CYP4F11 | ENSCAFG00000023401 | 20 | 46,611,481 | 46,631,393 |
| CYP4F22 | ENSCAFG00000023053 | 20 | 46,674,180 | 46,694,052 |
| CYP4V2 | ENSCAFG00000007384 | 16 | 44,525,644 | 44,544,809 |
| CYP4X1 | ENSCAFG00000023824 | 15 | 13,508,318 | 13,546,829 |
| CYP51A1 | ENSCAFG00000001945 | 14 | 17,746,739 | 17,766,635 |
| CYP7A1 | ENSCAFG00000007098 | 29 | 9,285,140 | 9,347,795 |
| CYP7B1 | ENSCAFG00000007246 | 29 | 14,444,860 | 14,613,129 |
| CYP8B1 | ENSCAFG00000005370 | 23 | 11,967,341 | 11,968,846 |
- Canine identified CYP genes. ^ indicates that the specific canine gene name was identified via ncbi.gov, while *denotes the human name because a canine is not available. One gene remains located on the canine scaffold (JH373739.1).
- n/a if Ensembl canine ID was unavailable.
Data were normalized using DESeq2 (Love, Huber, & Anders, 2014) and expressed as transcripts per million mapped reads (TPM). Only uniquely mapped reads were included in the data analysis to minimize bias in expression due to the nonspecific mapping of reads in regions of high homology. The mean CYP expression and standard error (SE) for each organ were determined and presented in Table form. Due to the small sample size, no inferences regarding CYP differences based upon gender could be made.
2.3 Primer design and quantitative real-time PCR
Quantitative real-time PCR (qPCR) was performed to verify RNA-seq expression pattern of CYP2A13, CYP2B11, CYP2C21, CYP2E1, CYP27A1, and CYP2D15. The genes selected were the top two or three genes expressed in liver, lung, and duodenum. Specific primer pairs (IDT®, Coralville, IO, USA) were selected for the eight individual CYPs and two housekeeping genes (HRPT, ACT-β) (Table 2). Reverse transcription (Invitrogen iScript, BioRad, Hercules, CA, USA) was performed at the three sites of xenobiotic absorption and metabolism, liver (n = 8), duodenum (n = 8), and lung (n = 8). Quantification of cDNA (NanoDrop 8000, ThermoScientific, Wilmington, DE, USA) was performed before qPCR (CFX384 Touch™ Real-Time PCR Detection System, BioRad, Hercules, CA, USA) utilizing SYBR green detection (SsoAdvanced Universal SYBR Green Supermix, BioRad, Hercules, CA, USA). Amplification protocol was: 95◦C for 30 s, 40 cycles at 95◦C to denature and 59◦C for 10 s to anneal. Melt curve analysis was performed with temperature range from 55–95◦C, with 0.5◦C increment increase every 5 s. Samples were run in triplicate. Relative quantification was performed utilizing HPRT to standardize all the samples. To normalize the data, all samples were compared to ACT-β. Relative expression of qPCR was compared to the TPM for the selected genes. Pearson correlation coefficient was utilized to determine the strength of the overall expression pattern between qPCR and RNA-seq.
| Gene | Forward | Tm-F | Reverse | Tm-R |
|---|---|---|---|---|
| 2E1 | AGAAATCGACAGGGTGATCG | 60.07 | CATCGTGTCCTGGTTTGCTA | 59.72 |
| 2C21 | CCCTGTATGGTCCAGTCCAA | 60.77 | GCAGAGAATTATGGCCCTGT | 59.15 |
| 2A13 | GAGATTGATCGGGTGATTGG | 60.28 | GGAGGAGAAACTCCCGAAAC | 60.05 |
| 2B11 | TTCGAGCTTTTCCACAGCTT | 60.13 | CAGGTAGGCGTCGATGAAGT | 60.28 |
| 27A1 | CAGAAGGACTTTGCCCACAT | 60.11 | TTTATGGGGACCACAGGGTA | 60.14 |
| 2D15 | TGGACTTCCAGGAACCAATC | 59.9 | GGACTGTCCAACCAGCTCTC | 59.84 |
| HPRT | CCCTCGAAGTGTTGGCTATAA | 59.23 | TCAAGGGCATATCCTACAACAA | 59.8 |
- Primers utilized for each gene, including housekeeping genes: HPRT.
| Liver mean TPM (SE) | Duodenum mean TPM (SE) | Lung mean TPM (SE) | Kidney mean TPM (SE) | Blood mean TPM (SE) | |
|---|---|---|---|---|---|
| CYP11A1 | 0.0 (0) | 0.0 (0) | 0.1 (0.1) | 2.6 (0.4) | 0.3 (0.1) |
| CYP17A1 | 0.1 (0) | 0.0 (0) | 0.1 (0) | 0.1 (0) | 0.0 (0) |
| CYP19A1 | 0.1 (0) | 0.1 (0) | 0.2 (0.1) | 0.1 (0.1) | 0.0 (0) |
| CYP1A1 | 11.9 (2) | 44.9 (39.5) | 60.3 (31.3) | 0.8 (0.3) | 0.0 (0) |
| CYP1A2 | 135.3 (26) | 0.0 (0) | 0.1 (0) | 0.1 (0) | 0.0 (0) |
| CYP1B1 | 2.6 (0.4) | 48.8 (4.7) | 73.8 (17.4) | 24.0 (1.6) | 0.1 (0) |
| CYP20A1 | 6.4 (0.4) | 14.2 (2.1) | 23.3 (2.3) | 27.8 (1.4) | 9.9 (1.3) |
| CYP21 | 4.3 (0.5) | 3.8 (1.2) | 0.3 (0.1) | 1.1 (0.2) | 0.1 (0) |
| CYP24A1 | 0.0 (0) | 0.1 (0) | 0.0 (0) | 7.8 (3.1) | 0.2 (0.1) |
| CYP26A1 | 11.2 (1.2) | 0.1 (0) | 0.1 (0) | 0.1 (0) | 0.0 (0) |
| CYP26B1 | 3.8 (0.7) | 3.8 (0.8) | 52.7 (12.4) | 7.3 (1.2) | 0.4 (0) |
| CYP27A1 | 307.9 (13.7) | 65.5 (8.6) | 150.1 (19.3) | 56.9 (3.9) | 87.8 (13.5) |
| CYP27B1 | 0.0 (0) | 0.0 (0) | 0.4 (02.) | 14.1 (2.9) | 0.0 (0) |
| CYP27C1 | 0.4 (0.1) | 0.6 (0.2) | 2.5 (0.3) | 0.8 (0.1) | 0.6 (0.1) |
| CYP2A13 | 1146.0 (179.7) | 0.1 (0.1) | 47.3 (18.4) | 0.9 (0.7) | 0.0 (0) |
| CYP2A7^ | 432.0 (33.9) | 0.0 (0) | 0.5 (0.1) | 0.1 (0) | 0.0 (0) |
| CYP2B11 | 644.8 (53.4) | 107.3 (34) | 951.7 (192.6) | 0.3 (0.1) | 0.1 (0) |
| CYP2C21 | 2172.8 (82) | 0.3 (0) | 1.2 (0.2) | 0.7 (0.2) | 0.2 (0.1) |
| CYP2D15^ | 888.1 (49.9) | 0.2 (0) | 0.8 (0.2) | 14.1 (1.8) | 1.5 (1.1) |
| CYP2E1 | 12668.2 (412.3) | 0.0 (0) | 3.1 (0.8) | 2.0 (0.6) | 0.0 (0) |
| CYP2F1 | 6.6 (0.6) | 0.0 (0) | 2.6 (1.2) | 0.0 (0) | 0.0 (0) |
| CYP2J2 | 50.2 (2) | 44.3 (9.9) | 22.5 (4.5) | 130.7 (5.4) | 0.8 (0.2) |
| CYP2R1 | 10.7 (1) | 26.3 (3.7) | 22.1 (2.5) | 17.3 (0.9) | 2.5 (0.4) |
| CYP2S1 | 0.6 (0.1) | 18.0 (5.5) | 83.7 (9.4) | 0.3 (0.1) | 0.2 (0.1) |
| CYP2U1 | 56.2 (1.6) | 7.8 (0.8) | 18.9 (1.6) | 14.8 (0.9) | 4.8 (1.1) |
| CYP2W1 | 14.8 (1.3) | 0.4 (0.2) | 1.9 (0.5) | 1.3 (0.1) | 1.2 (0.2) |
| CYP39A1 | 11.7 (1.1) | 8.3 (0.8) | 30.8 (3) | 15.5 (0.8) | 3.8 (0.6) |
| CYP3A* | 482.5 (34.8) | 0.0 (0) | 0.1 (0.1) | 0.1 (0) | 0.2 (0.1) |
| CYP3A12 | 631.2 (42.1) | 338.7 (116.2) | 5.6 (3.2) | 0.3 (0.1) | 0.9 (0.2) |
| CYP3A26 | 1145.3 (75.4) | 54.7 (4.6) | 78.3 (9.6) | 45.9 (1.5) | 53.7 (6.9) |
| CYP3A43* | 93.2 (9.9) | 20.5 (5) | 0.4 (0.2) | 0.1 (0) | 0.0 (0) |
| CYP46A1 | 0.2 (0.1) | 0.6 (0.2) | 1.8 (0.2) | 1.1 (0.4) | 3.8 (0.3) |
| CYP4A11* | 0.1 (0) | 0.0 (0) | 0.2 (0.1) | 1.4 (0.3) | 0.0 (0) |
| CYP4A37^ | 643.5 (29.7) | 0.1 (0) | 1.5 (0.4) | 2008.2 (126.5) | 0.4 (0.1) |
| CYP4A38^ | 309.1 (21.4) | 0.1 (0) | 1.6 (0.1) | 383.3 (13.6) | 0.1 (0) |
| CYP4A39 | 326.9 (17.8) | 0.0 (0) | 1.7 (0.2) | 942.8 (125.4) | 0.0 (0) |
| CYP4B1 | 1.8 (0.2) | 1.6 (0.8) | 502.0 (105.8) | 6.7 (0.4) | 0.2 (0.1) |
| CYP4F11 | 59.5 (4.6) | 0.8 (0.5) | 23.9 (2.4) | 0.4 (0.1) | 1835.9 (160.5) |
| CYP4F22 | 0.2 (0) | 0.2 (0.1) | 0.1 (0) | 0.4 (0.1) | 0.7 (0.1) |
| CYP4V2 | 194.2 (10.9) | 18.8 (2.6) | 61.0 (7) | 148.1 (17.4) | 79.4 (11) |
| CYP4X1 | 5.4 (0.4) | 10.8 (1.4) | 11.5 (2.1) | 13.3 (0.7) | 1.9 (0.3) |
| CYP51A1 | 72.3 (7.6) | 12.1 (1.3) | 20.3 (2.4) | 10.1 (0.6) | 7.2 (0.8) |
| CYP7A1 | 246.4 (39.2) | 3.1 (0.3) | 4.3 (0.7) | 3.0 (02.) | 1.6 (0.2) |
| CYP7B1 | 133.3 (9) | 4.0 (1.6) | 56.8 (7) | 5.7 (0.5) | 0.3 (0) |
| CYP8B1 | 395.8 (47.7) | 3.3 (1.2) | 2.2 (0.6) | 22.5 (2.8) | 0.0 (0) |
- Mean transcript per million (TPM) plus the standard error (SE). *the human annotation correlates with the presence of an annotated canine CYP which has not received individual isoform identification. ^ denotes canine CYP information found on ncbi.gov.
3 Results
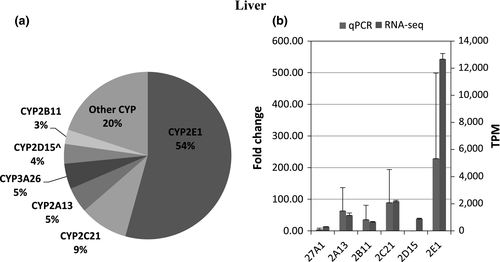
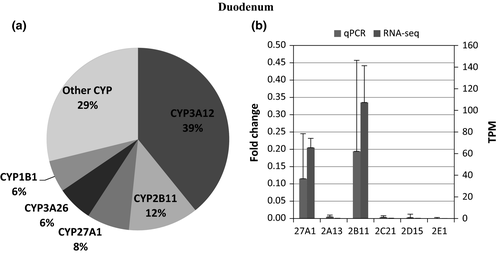
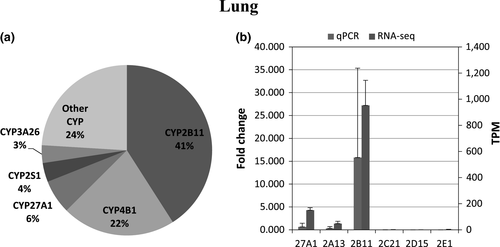
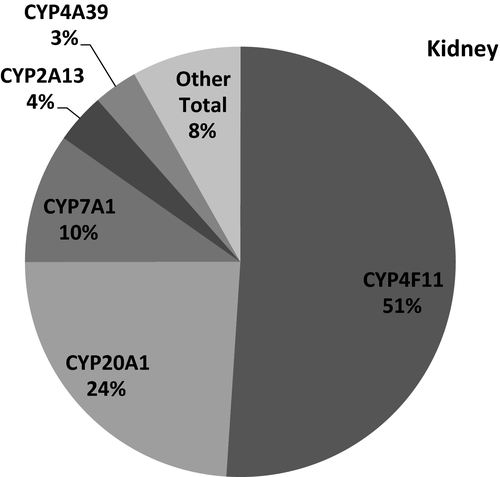
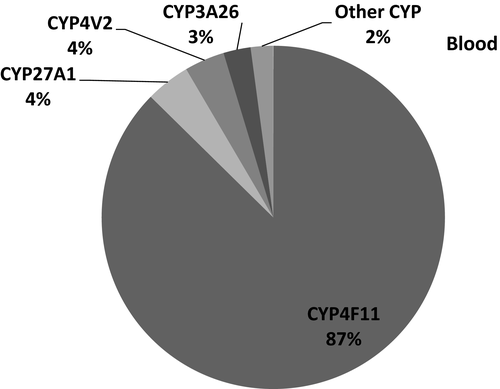
The number of transcripts mapped per sample ranged 6.5–23 million reads per sample In total, expression of 45 CYPs was identified and quantified in any of the five different tissues (Table 3). CYP2E1 had the highest mean transcript expression in the liver, followed by transcript levels for CYP2C21, CYP2A13, CYP3A26, CYP2D15, and CYP2B11, with a high correlation between RNA-seq and qPCR data (r = 0.95). (Figure 1a,b) In the duodenum, CYP3A12 was the highest expressed followed by CYP2B11, CYP27A1, CYP3A26, and CYP1B1, and the expression pattern between RNA-seq and qPCR appeared similar (r = 0.99). (Figure 2a,b). In the lung, CYP2B11 was the highest expressed, with minimal transcript expression of other metabolizing CYPs. The expression pattern between qPCR and RNA-seq remained constant (r = 0.99) (Figure 3a,b). The highest expressed CYP in the kidney (Figure 4) and blood (Figure 5) is correlated with eicosanoid production, and limited CYP xenobiotic enzyme expression was present at these two sites.
4 Discussion
CYPs can be categorized by their function. For example, CYP2F-S, CYP4, and CYP20-51 are classically associated with homeostatic functions. Reported functions for this subset of CYPs include eicosanoid production, angiogenesis, regulation of inflammation (Fleming, 2001), bile production, and cholesterol homeostasis (Pikuleva, 2006). The prevalence of these CYPs in the kidney and blood cells indicates important functions in homeostasis with perhaps limited drug and xenobiotic metabolism. An estimated 70–80% of drug biotransformation is attributed to CYP1,2, and 3 families in human (Zanger & Schwab, 2013).
Known CYPs in humans that utilize pharmaceuticals as substrates, inhibitors, or inducers include 1A1; 1A2; 2B6; 2D; 2C8,9,19; 2E1; and 3A4,5,7 (Sikka, Magauran, Ulrich, & Shannon, 2005). The canine orthologues to these genes include 3A12/26 for 3A4, 2C21 for 2C9, 2D15 for 2D6, and 2B11 for 2B6 (Court, 2013; Zanger & Schwab, 2013). The three highest transcript signals observed in the liver were CYP2E1, CYP2C21, and CYP2A13. The pattern of transcript expression conflicts with previous reports in which CYP2D15 had greater transcript expression than CYP3A26 and CYP3A12 based on qPCR rather than RNA-seq (Haller et al., 2012).
Transcripts for both CYP3A12 and 3A26 were observed in the canine as well as CYP3A* and CYP3A43*. In humans, CYP3A43 differs from CYP3A4 by six amino acid within the substrate recognition pocket, and its contribution to drug metabolism has yet to be established (Domanski, Finta, Halpert, & Zaphiropoulos, 2001). These two annotations have not been well characterized and may either suggest two additional CYP3A isoforms or gene duplication. Alignment of the four genes indicates areas of conservation, but sequencing and recombinant expression are necessary to determine whether other CYP3A enzymes are present in the canine. In humans, a gene duplication of CYP2D6 has been implicated in alterations in drug metabolism, and it is possible the CYP3A* and 3A43* may be gene duplications (Gaedigk et al., 2007). CYP2C41 mRNA was not expressed in any of the sampled tissues nor could the expression of this gene be found through the use of novel transcript detection. This gene has only been reported in 16% of beagles studied, and its prevalence in other breeds has not been reported (Court, 2013). The presence of this gene has been suggested as a cause of the rapid metabolism of celecoxib and may also influence the metabolism of other CYP2C-dependent drugs (Paulson et al., 1999).
Whether the level of RNA expression correlates with protein expression requires further evaluation, as protein abundance is subject to post-transcriptional and translational regulation (Schwanhausser et al., 2011). Previous quantitative protein mass spectroscopy (LC-MS) suggested the presence of very little CYP3A26 protein but a large quantity of CYP3A12, CYP2E1, CYP2D15, CYP2C21, and CYP1A2. However, the mRNA transcript expression was much lower, which could be a reflection on the efficiency of the translation or variation between study populations. Unlike the liver, CYP expression in the duodenum does correlates with LC-MS CYP quantification in the duodenum, with CYP3A12 > CYP2B11 (Haller et al., 2012). Using a single study population to examine both transcription expression and the presence of protein may help to clarify these discrepancies. Furthermore, it is important to keep in mind that protein quantification does not reflect enzyme kinetics, a critical component when considering drug metabolism and the rate of metabolite formation. In that regard, even a small amount of one enzyme may be more efficient in drug metabolism as compared to many enzymes with slow kinetics or a narrow substrate window.
In the lung, CYP2B11 has the greatest transcript expression, but to the author's knowledge, there are no protein quantification studies to determine whether there is a correlation. This enzyme has been implicated in the metabolism of anesthetic drugs such as propofol (Hay Kraus, Greenblatt, Venkatakrishnan, & Court, 2000), ketamine, and midazolam while being inhibited by medetomidine (Baratta, Zaya, White, & Locuson, 2010) and ketoconazole (Lu et al., 2005).
This is the first report regarding global CYP mRNA expression in multiple tissues in the canine using RNA-seq. By utilizing this powerful tool, the selection bias is removed as all expressed genes are reported. However, the power of this analysis is limited if CYP genes are not annotated or incorrectly annotated (as in the case of CYP2D15) or individual genes cannot be distinguished (such as CYP3A*). The quality of the data is also important and can be influenced at various stages from RNA isolation through sequencing. The reads per million for both lung and duodenum were low compared to liver. These tissues are more fibrous compared to that of the liver and kidney, yielding less RNA which in turn can impact downstream applications. Biological replications (n = 8 for all tissues except kidney n = 7) were only completed in one breed. The pattern of expression in duodenum, liver, and lung was confirmed via qPCR for six select genes. In this case, where the physiologic expression profile is not well known, using a gold standard such as qPCR can be used to validate the results of RNA-seq. Correlation of the relative expression provided by qPCR with the absolute quantification of RNA-seq provides confidence in the results. Ideally, any gene which may have a poor or variable description requires secondary validation and sequencing.
Knowledge of baseline expression is vital to understanding drug metabolism in both healthy and disease states. In this work, transcripts for 45 CYP enzymes were identified and quantified in the canine compared to 57 in humans. As anticipated, the liver, duodenum, and lung are important sites for drug metabolism. In contrast, the kidney and blood may have greater expression of enzymes important for homeostasis. Additional research to fully characterize the relationship between transcript signal and CYP protein abundance/expression along with an understanding of the impact from altered expression when xenobiotically induced or in disease states is required to help guide therapeutic management.
Acknowledgments
The authors would like to thank Sarah Corum, Christopher Chio, Thomas Wilson, and Kevin Esch of Zoetis for technical help, advice, and input. Funding was provided by Zoetis®.


