Differentiation of stable kidney function versus progressive dysfunction in dogs
Abstract
Background
Circulating creatinine and symmetric dimethylarginine (SDMA) are biomarkers of kidney function that have been used variously to define stable vs progressive chronic kidney disease (CKD). Slope monitoring of inverse biomarker values (creatinine−1 or SDMA−1) has shown promise, but quantitative criteria to distinguish stable vs progressive CKD using this approach are lacking.
Objective
Assessment of creatinine−1 and SDMA−1 slope cutoffs to distinguish stable vs progressive CKD.
Animals
One hundred ten clinically healthy university staff-owned dogs and 29 male colony dogs with progressive X-linked hereditary nephropathy (XLHN).
Methods
Retrospective analysis combining 2 prospective observational studies, 1 tracking kidney function biomarkers in healthy dogs (HDs) to a maximum of 3 years, and 1 tracking kidney function biomarkers in male colony dogs with progressive XLHN to a maximum of 1 year. The minimum slope of creatinine−1 or SDMA−1 as measured using the IDEXX SDMA test from HD was assigned as the slope cutoff for stable kidney function.
Results
The stable vs progressive slope cutoff was −0.0119 week × dL/mg for creatinine−1 and −0.0007 week × dL/μg for SDMA−1.
Conclusions and Clinical Importance
In the studied CKD population, progressive dysfunction can be distinguished from stable kidney function by using the slope of creatinine−1 or SDMA−1. These criteria may serve to characterize CKD in other cohorts of dogs and to establish guidelines for degrees of progression rate in dogs with naturally occurring CKD.
Abbreviations
-
- AUC
-
- area under the biomarker vs time curve
-
- CKD
-
- chronic kidney disease
-
- CREA
-
- creatinine
-
- CREA−1
-
- inverse creatinine
-
- CV
-
- coefficient of variation
-
- GFR
-
- glomerular filtration rate
-
- HD
-
- healthy dogs
-
- IRIS
-
- International Renal Interest Society
-
- SDMA
-
- symmetric dimethylarginine
-
- SDMA−1
-
- inverse symmetric dimethylarginine
-
- XLHN
-
- X-linked hereditary nephropathy
1 INTRODUCTION
Chronic kidney disease (CKD) is a heterogenous condition with a variable medical course dependent on etiology, genetic factors, environmental factors, and management. Once diagnosed, CKD can be characterized further by staging criteria established by the International Renal Interest Society (IRIS).1 Staging stratification of CKD severity is based on blood creatinine (CREA) or symmetric dimethylarginine (SDMA) concentrations, both of which are surrogate markers of glomerular filtration rate (GFR).2 The trajectory of the clinical course of CKD as stable or progressive can be difficult to predict, and currently there are no consensus guidelines on how best to differentiate between these clinical states or determine the rate of CKD progression.
The most basic approach to characterize CKD progression includes serial monitoring or trending of changes in serum CREA or SDMA. Direct measurement or prediction of GFR is difficult and rarely practical in a clinical setting. Consequently, observation of a fixed change in 1 of these kidney function markers over a predefined time interval is a possible approach. Set increments of change can have limited utility, however, because small changes may be more clinically relevant in some areas of the biomarker range than at others. This consideration is especially relevant for kidney function biomarkers that change hyperbolically with changes in GFR.
Additional approaches for using functional kidney biomarkers to characterize CKD progression include percentage change, doubling of serum CREA, area under the biomarker vs time curve (AUC), time-normalized AUC, and expert consensus. For example, progression of CKD could be defined as a 25% increase in CREA over 1 year of established CKD.3 Ease of use is the main benefit of the percentage change approach, because it can be estimated quickly. Although widely used for reporting outcomes in the human medical literature, the percentage change approach, by itself, is agnostic to differences in clinical implications of such changes (eg, 25% change) occurring at the low end vs the high end of the biomarker range. A related approach is the doubling of serum CREA, and it has similar benefits and limitations. Likewise, AUC represents the change in kidney function over time but is influenced substantially by the frequency with which the biomarker is measured and the duration of time the biomarker is followed. Normalizing AUC by a fixed unit of time (eg, 4 weeks) can allow for easier comparison among patients. The AUC also lacks directionality, which makes it challenging to quantify CKD progression. Expert panel review and consensus opinion is an approach used most commonly for retrospective research comparisons. It remains impractical in clinical settings, is dependent on the training of the review panel, and is difficult to reproduce given lack of consensus on what constitutes stable or progressive disease.
Another common metric to detect CKD progression is the slope of serial inverse CREA measurements over time. As GFR decreases progressively over time, steady-state serum CREA concentration increases hyperbolically. Transforming measurements of CREA to its reciprocal (CREA−1) linearizes this otherwise hyperbolic relationship and allows for prediction of the rate of decline of GFR over the spectrum for the CREA range. Slope of inverse CREA has long been accepted in the human medical literature as a simple method for estimating the progressive decline of GFR and progression of CKD.4 Slope of inverse CREA subsequently has become well-established in the veterinary literature.5-10 Serum SDMA concentration also has a similar hyperbolic relationship with changes in GFR, and the slope of SDMA−1 has been validated as a surrogate method of assessing progressive changes in GFR in both veterinary medicine11 and human medicine.12
Recognition of stable or nonprogressive CKD compared to progressive CKD has important clinical implications for ongoing diagnostic evaluation, therapeutic strategies, and prognostic assessment for dogs in the earliest stages of CKD. Despite evidence that the slope of an inverse functional biomarker such as serum CREA or SDMA is accepted as a valid indicator of progressive changes in GFR and progressive CKD, no consensus exists on what slope value constitutes stable kidney function (ie, stable CKD) vs progressive CKD. Similarly, no recommendation or consensus of actual slope cutoffs that might differentiate these clinical states are available.
Dogs with X-linked hereditary nephropathy (XLHN) have been established as a reliable model of progressive CKD.13 X-linked hereditary nephropathy is associated with a heritable defect in glomerular basement membrane maturation.13-15 Proteinuria usually is manifested at 3 to 6 months of age followed by progressive kidney disease.14 In affected male dogs, terminal kidney failure usually develops between 6 and 24 months of age.14 Because no models of stable CKD are available, comparing the slopes of inverse biomarkers of known models of CKD progression and healthy dogs (HDs) would serve as an initial step in differentiating between stable and progressive CKD. The purpose of our study was to establish cutoffs in slopes of inverse biomarkers by comparing dogs with XLHN with HDs.
2 MATERIALS AND METHODS
2.1 Study population and clinical evaluation
The HD cohort with presumptive stable kidney function was taken from a previous study16 that assessed serologic response to Borrelia burgdorferi, Ehrlichia spp., and Anaplasma spp. A prospective collection of blood samples from owner-reported HDs between 1 and 10 years of age belonging to students and staff of the University of Missouri was used. Antibody-positive dogs were evaluated every 4 months; antibody-negative dogs were evaluated every 6 months. A minimum of 3 study visits was required for all dogs. At each evaluation, the following were completed: (a) owner-submitted detailed history; (b) veterinarian-performed physical examination; and (c) veterinarian-obtained CBC, serum biochemistry profile, urinalysis, and serology. Laboratory analysis was performed by IDEXX Laboratories, Inc. (Westbrook, Maine), with SDMA determined by liquid chromatography mass spectrometry and CREA determined by Jaffe's reaction using a Beckman clinical chemistry analyzer (Beckman Coulter, Inc., Brea, California). Dogs with a serologic response to Ehrlichia chaffeensis and Ehrlichia ewingii were common.16 This finding was not unexpected because dogs without clinical evidence of ehrlichiosis may remain seropositive for at least 2 years.17 Serologic response to Anaplasma spp. was rarely detected whereas serologic response to B. burgdorferi was not detected at all. For inclusion in the study, HD had to remain classified as clinically healthy based on the above clinical criteria and complete a minimum of 3 study visits. For the representative biomarker progression plots, a subset of 30 HD was chosen randomly among all HD dogs using the “sample” function in R (RStudio Team [2020]. RStudio: Integrated Development for R. RStudio, PBC, Boston, MA. URL: http://www.rstudio.com/). No treatments known to affect renal function were administered to dogs enrolled in the study. Owner consent was required for enrollment, and the study protocol was reviewed and approved by the University of Missouri Institutional Animal Care and Use Committee.
The progressive kidney dysfunction cohort consisted of dogs with XLHN. The XLHN dogs were from a single family of colony dogs maintained at Texas A&M University. In this family, XLHN is caused by a mutation in the gene encoding the α5 chain of type IV collagen.18 End-stage kidney disease develops between 6 and 18 months of age (median, 10 months).15 A minimum of 3 samples was required for all dogs. A set of 8 dogs was sampled approximately every 5 days; a set of 21 dogs was sampled approximately every 25 days. No treatments known to affect renal function were administered to dogs enrolled in the study. Dogs were cared for according to the principles outlined in the National Institutes of Health Guide for the Care and Use of Laboratory Animals, and the study protocol was reviewed and approved by the Texas A&M University Institutional Animal Care and Use Committee. Determination of SDMA was performed by IDEXX Laboratories, Inc. (Westbrook, Maine) using liquid chromatography mass spectrometry, and CREA was determined by enzymatic method using a Vitros 250 clinical chemistry analyzer (Johnson & Johnson Co., Rochester, New York) at Texas A&M University.
2.2 Inverse biomarkers and slope analysis
Biomarker (CREA, SDMA) results were transformed into inverse values (CREA−1, SDMA−1) by taking the reciprocal value of each biomarker measurement. Using a least squares regression model for each dog, slopes of the values of each inverse biomarker (dependent variable) over time (ie, follow-up day; independent variable) were calculated. Thus, 2 slopes were calculated for each dog: (a) the slope of inverse CREA (CREA−1 slope) over time and (b) the slope of inverse SDMA (SDMA−1 slope) over time. When referring to either the slope of CREA−1 or the slope of SDMA−1 in a general sense, or both collectively, the term “inverse biomarker slopes” may be used. When necessary, the descriptor “non-inverse” is used to distinguish non-reciprocal biomarker results from inverse biomarker results. Similarly, “non-inverse” biomarker slopes will be used to distinguish slopes of non-reciprocal biomarker results over time from the slopes of inverse biomarker results over time.
For each study group (HD, XLHN), the median and 25% and 75% quartiles were calculated for CREA−1 and SDMA−1 slopes. Radial plots and boxplots were used to visually examine the distribution of inverse biomarker slopes. Wilcoxon signed rank tests were used to determine whether non-inverse and inverse biomarker slopes for XLHN and HD dogs were different from zero. Under the guidance of a panel of subject matter experts (LDC, CD, MN, DP, SR, GS, SV), a conservative slope for both CREA−1 and SDMA−1 demarcating the cutoff between stable and progressive CKD was selected. A post-hoc coefficient of variation (CV) analysis was conducted to provide an initial understanding of biomarker variability among HD dogs, specifically whether the variability of CREA and SDMA (as well as CREA−1 and SDMA−1) were different. For each HD dog, CVs were calculated for each biomarker (non-inverse and inverse) and juxtaposed in boxplots for comparison.
3 RESULTS
3.1 Demographics
A total of 139 dogs were included in the study (Table 1). Twenty-nine (21%) dogs were diagnosed with XLHN whereas 110 (79%) dogs were healthy (HD). All XLHN dogs (n = 29) were enrolled at ≤15 weeks of age. All HD dogs were at least 15 weeks of age when enrolled. All XLHN dogs (n = 29) were intact males compared to 7 (6%; 7/110) HD dogs. Spayed females (43%; 47/110) and neutered males (40%; 44/110) were common among HD dogs. Sixty-two percent (18/29) of XLHN dogs were between 5 and 10 kg. The remainder (38%; 11/29) of the XLHN dogs were between 10 and 15 kg. The HD dogs were mostly between 5 and 35 kg.
| Demographic (n = 139) (%) | Total (%) | XLHN (n = 29) (21%) | HD (n = 110) (79%) |
|---|---|---|---|
| Age | |||
| ≤15 weeks | 29 (21) | 29 (100) | 0 (0) |
| >15 weeks to 1 year | 9 (6) | 0 (0) | 9 (8) |
| >1 to 2 years | 15 (11) | 0 (0) | 15 (14) |
| >2 to 3 years | 10 (7) | 0 (0) | 10 (9) |
| >3 to 4 years | 11 (8) | 0 (0) | 11 (10) |
| >4 to 5 years | 21 (15) | 0 (0) | 21 (19) |
| >5 to 6 years | 11 (8) | 0 (0) | 11 (10) |
| >6 to 7 years | 12 (9) | 0 (0) | 12 (11) |
| >7 to 8 years | 5 (4) | 0 (0) | 5 (5) |
| >8 to 9 years | 9 (6) | 0 (0) | 9 (8) |
| >9 to 10 years | 5 (4) | 0 (0) | 5 (5) |
| >10 years | 2 (1) | 0 (0) | 2 (2) |
| Sex | |||
| Female | 12 (9) | 0 (0) | 12 (11) |
| Spayed female | 47 (34) | 0 (0) | 47 (43) |
| Male | 36 (26) | 29 (100) | 7 (6) |
| Neutered male | 44 (32) | 0 (0) | 44 (40) |
| Weight (kg) | |||
| 0 to 5 | 6 (4) | 0 (0) | 6 (5) |
| >5 to 10 | 37 (27) | 18 (62) | 19 (17) |
| >10 to 15 | 23 (17) | 11 (38) | 12 (11) |
| >15 to 20 | 13 (9) | 0 (0) | 13 (12) |
| >20 to 25 | 16 (12) | 0 (0) | 16 (15) |
| >25 to 30 | 16 (12) | 0 (0) | 16 (15) |
| >30 to 35 | 17 (12) | 0 (0) | 17 (15) |
| >35 to 40 | 5 (4) | 0 (0) | 5 (5) |
| >40 | 6 (4) | 0 (0) | 6 (5) |
- Abbreviations: HD, healthy dogs; XLHN, X-linked hereditary nephropathy.
3.2 Biomarker progression
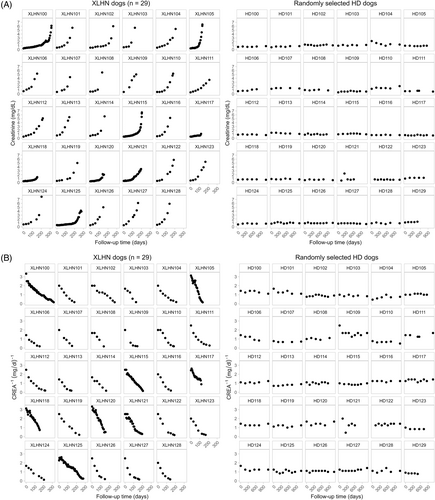
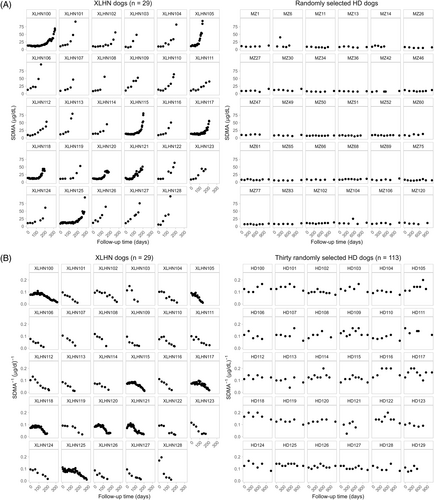
Progression plots were generated for all XLHN dogs, but because of space constraints, progression plots for a set of 30 randomly chosen HD dogs are provided (Figures 1 and 2). A notable overall upward trend in CREA and SDMA can be seen by Day 200 in all XLHN dogs. A corresponding overall downward trend can be seen in CREA−1 and SDMA−1 results in all XLHN dogs. In contrast, non-inverse and inverse plots for CREA and SDMA for HD dogs remain relatively stable throughout the study period. At the time of first visit, CREA results of HD dogs tended to be higher than those of XLHN dogs. With disease progression, CREA results for XLHN dogs surpassed those of the HD dogs, whereas CREA−1 results for XLHN dogs became lower than those of the HD dogs. At the time of the first visit, SDMA results of XLHN and HD dogs tended to be similar. With disease progression, SDMA results of XLHN dogs surpassed those of the HD dogs, whereas SDMA−1 results for XLHN dogs became lower than those of the HD dogs. A qualitative difference in biomarker progression in the XLHN dogs is that CREA results tend to increase initially whereas many of the XLHN dogs have comparatively stable SDMA results initially. This finding translates to differences in the onset of the CREA−1 biomarker progression in comparison to the onset of the SDMA−1 biomarker progression. Because the SDMA and CREA results of HD dogs remained stable throughout the study period, qualitative differences in non-inverse and inverse biomarker progression between SDMA and CREA were not observed.
3.3 Slope analysis
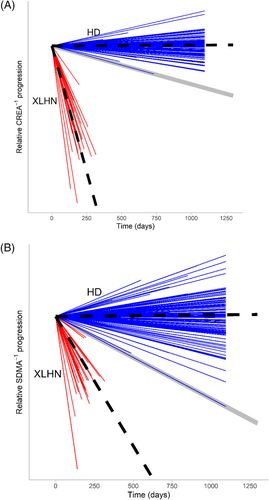
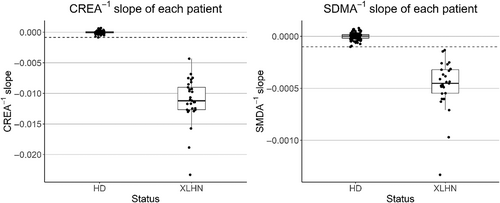
Slopes of HD dogs for inverse biomarkers were indistinguishable from zero (P > .7) whereas those of XLHN dogs were < 0 (P < .0001; Figures 3 and 4). The inverse slopes for the XLHN dogs are completely separated from the slopes of the HD dogs. Based on this separation, and in consultation with previously identified subject matter experts, it was decided that the minimum inverse slope of the HD dogs would serve as the most conservative cutoff between stable kidney function and progressive kidney dysfunction in order to minimize overinterpreting CKD progression. The minimum and most conservative slope among HD dogs was −0.0007 (μg/dL)−1/week for SDMA−1 and −0.0117 (mg/dL)−1/week for CREA−1. Coefficients of variation of SDMA and SDMA−1 for HD dogs appeared to be larger than those of CREA and CREA−1 (Figures S1 and S2). To further explore the potential influence of puppy growth on the qualitative differences in the biomarker progression plots between CREA and SDMA observed in the XLHN dogs, inverse CREA and inverse SDMA slopes from 17 unaffected littermates from the same XLHN colony were evaluated. In these healthy unaffected littermates, the inverse SDMA slopes were indistinguishable from zero (P = .78) whereas the inverse CREA slopes were < 0 (P < .0001; Figure S3). In fact, the inverse SDMA slopes of the unaffected littermates were above the SDMA-based stable vs progressive cutoff, and thus most similar to the inverse slopes observed with stable kidney function (Figure S4). Conversely, the inverse CREA slopes of the unaffected littermates were below the CREA-based stable vs progressive cutoff, and thus most similar to the inverse slopes observed with progressive kidney dysfunction. For direct comparison, the overlay of the inverse CREA slopes in XLHN dogs and unaffected littermates is shown in relation to the inverse CREA cutoff in the HD cohort (Figure S5).
4 DISCUSSION
Our study provides the first quantitative suggested cutoffs for CREA−1 and SDMA−1 slopes derived from longitudinal serum CREA and SDMA measurements of HD with stable kidney function that could be used as a guideline to differentiate stable kidney function from a progressive decrease in kidney function. These criteria may serve to characterize CKD in other cohorts of dogs with naturally occurring CKD, and this methodology potentially could be used to differentiate progression rates among dogs with CKD. The progressive CKD observed in XLHN dogs is a well-characterized model with tubular degeneration and regeneration, interstitial fibrosis, and chronic interstitial inflammation.15 Although XLHN dogs experience severe deterioration in kidney function and likely represent an extreme subset of dogs with CKD progression, they were an available population serving as a reproducible model of progressive CKD.
Although inverse biomarker slopes of progressive CKD dogs could be understood using well-characterized canine models, such models do not exist for stable CKD. The HD dogs were considered a relevant comparator group because longitudinal serum CREA and SDMA measurements of this population likely reflect stable kidney function over time, and inverse slope analysis could serve as a useful surrogate. Comparisons between XLHN dogs and HDs could provide valuable insight into the differences between dogs with stable kidney dysfunction and dogs with progressively worsening kidney function. The use of established models of rapid CKD progression and known HD constrained patient selection to expected clinical extremes, permitting focus solely on differences in kidney biomarker expression between the 2 populations. Future studies would be needed to characterize inverse slopes for dogs with naturally occurring CKD of different IRIS stages. However in practice, determinations regarding the progression of CKD should be made with the entire clinical picture in mind (ie, physical examination, patient history, and other laboratory findings).
The clear demarcation in inverse biomarker slopes between the 2 cohorts provides an initial means to distinguish between stable kidney function in HD and kidney function that deteriorates over time. These distinctions likely can be applied to distinguish between stable and progressive CKD for reasons previously mentioned. As predicted, CREA−1 and SDMA−1 slopes of HD dogs both were indistinguishable from zero, suggesting stability of kidney function in this cohort over the duration of the study period. This observation was in marked contrast to the negative CREA−1 and SDMA−1 slopes for the XLHN cohort, characteristic of the rapidly progressive CKD in these dogs. Although several options were available for setting a slope cutoff for stable kidney function, the minimum slope observed in the HD population was selected as the most conservative measure by which to determine the cutoff. This guideline permits dogs with biomarker results that decrease minimally over time to also be considered to have stable CKD. The quantitative and objective assessment provided by our study could provide clarity to the subjective and non-standardized definitions currently proposed for progressive CKD.
Slope assessment of inverse serum CREA or SDMA provides a quantitative matrix of the rate and direction of change in kidney function not provided by conventional sequential measurement. Slope assessment of inverse serum CREA or SDMA results also transforms the characteristic hyperbolic changes in kidney function to a more intuitive linear change that directly reflects changes in GFR.
Although both the CREA−1 and SDMA−1 slope cutoffs are presented here, the potential sensitivities or advantages of CREA−1 vs SDMA−1 slope assessment for the earliest detection of CKD progression have not been determined. Two recent publications, 1 with 2240 dogs with persistently increased CREA19 and 1 with 8088 dogs with persistently increased SDMA,20 suggest decreased kidney excretory function could be detected earlier by monitoring of SDMA rather than CREA in many dogs. Serum SDMA concentration also has been shown to detect smaller impairments in GFR than CREA.2, 21 In contrast to these findings, in the XLHN cohort initial changes in SDMA lagged behind initial changes in CREA. Creatinine has been shown to increase with age in puppies consistent with the lower initial CREA measurement in the XLHN puppy cohort compared to adult HD.2, 22 This situation confounds the interpretation of the initial increases in CREA observed in XLHN puppies whereas initial SDMA results are comparatively stable. To further evaluate the hypothesis that the initial increases in inverse CREA slopes in the XLHN dogs were impacted by factors other than kidney dysfunction, the inverse CREA and inverse SDMA slopes of 17 unaffected littermates from the same colony dogs at Texas A&M University were evaluated. This additional evaluation suggested that the inverse CREA slopes in XLHN-affected puppies are at least in part impacted by factors other than kidney dysfunction, because inverse CREA slopes are also below the CREA-based stable vs progressive cutoff in unaffected littermates in the absence of genetically-driven CKD. Although a more extensive evaluation of factors affecting increasing CREA in healthy puppies is outside the scope of our study, a potential contributing factor could be increasing lean body mass in growing puppies. Generally, CKD is more commonly recognized in adult dogs where CREA has been shown to decrease with decreases in lean body mass associated with CKD.23 Because SDMA is independent of aging and muscle mass, SDMA and SDMA−1 biomarker progression plots might more closely reflect the onset of decreasing GFR caused by CKD. The early increase in CREA in puppies during growth may have led to overestimates in the rate of CKD progression in XLHN dogs, leading to more negative inverse biomarker slopes. Because SDMA is not affected by the growth of puppies, the use of SDMA−1 instead of CREA−1 for determining stable or progressive CKD may help mitigate this bias in growing dogs. Understanding if CKD is stable or progressive, especially early in the disease process, increases opportunities for timely therapeutic intervention and improved outcomes.7
Lower nephron endowment in dogs than in humans also may obligate the use of a more sensitive kidney biomarker or biomarker transformation capable of earlier detection of stable or progressive CKD. In humans, the number of nephrons can vary 10-fold (200 000 to 2 million) per kidney24-26 and has been shown to be of particular relevance as a factor in the development of CKD.25 In dogs, nephron endowment is lower, especially for certain breeds (eg, 445 000-589 000 nephrons per kidney in beagles).27, 28 Lower overall nephron number means fewer nephrons can be lost before filtration capacity is compromised. In both humans and dogs, a lower nephron number also is associated with compensatory nephron hypertrophy and increased single nephron GFR which is a risk factor for nephron injury.29
The post-hoc CV analysis was conducted to further explore the observed variability in SDMA−1 compared to CREA−1 in the inverse biomarker progression plots in adult HD. One hypothesis for the occurrence of larger CVs for SDMA and SDMA−1 compared to those for CREA and CREA−1 in the HD cohort is that the increased variability may be impacted by increased sensitivity of SDMA to smaller physiological fluctuations. Creatinine has a large volume of distribution and is assumed to flow freely throughout total body water, delaying detection of changes in GFR in adult humans.30 In contrast, SDMA movement across cell membranes is dependent on cationic amino acid transporters and thus it has a smaller volume of distribution but also is subject to substrate competition for these transporters in humans.31, 32 A smaller volume of distribution is preferable when measuring a surrogate marker of GFR, because the unfiltered analyte has less volume to expand into and is less dependent on total body water.30 Furthermore, the extent to which CREA or SDMA distribution volume might meaningfully influence inverse biomarker slope assessments that span weeks to months between observations is unknown. Serum SDMA also is measured at a concentration an order of magnitude lower than CREA (ie, in μg/dL rather than mg/dL for CREA) and thus smaller changes can be objectively detected. Another factor is that breed and body weight impact circulating analyte concentrations in dogs.33 Comprehensive studies would be needed in dogs to elucidate the relative contributions of factors such as growth, cell turnover, generation, metabolic rate, signalment, volume of distribution, and excretion to overall analyte variability and responsiveness to changes in GFR in different settings. Alternatively, the higher variability observed in SDMA may be attributed to differences in analytical or biological variability between SDMA and CREA.
Limitations of our study include the age difference between the HD and XLHN dogs. Affected XLHN dogs typically have only a 1-year lifespan, over which they experience progressive CKD, and thus they were necessarily younger than the HD group. One strength of comparing known models of disease with a relevant healthy population from a previous longitudinal study is the reduction, refinement, and replacement of animals in clinical studies.34 Conversely, our study is subject to potential selection bias because of sourcing the longitudinal data from 2 different study designs. In the case of the HD study, the study was designed for observation and evaluation of vector-borne exposure. This design unlikely affected the CREA−1 and SDMA−1 slopes because HD dogs maintained stable kidney function markers and were evaluated and assessed as healthy at each sampling interval. An additional study limitation is that different methodologies for CREA measurements were used in the HD and XLHN cohorts. However, cohort-specific methodology differences for CREA measurements would not have affected the CREA−1 slope cutoff as it was determined in the HD cohort. An established criticism of the XLHN model is the aggressive progression of CKD that may not reflect progressive CKD associated with more common etiologies. As a result of the rapid progression, we anticipate the CREA−1 and SDMA−1 slopes for these XLHN dogs will be steeper than expected for a less aggressive CKD cohort. This possibility could be evaluated in future prospective studies of CKD progression with etiologies other than XLHN. Future studies testing the slope cutoff in other naturally occurring CKD populations are necessary to determine the minimum progression rate that distinguishes between various degrees of stable and progressive CKD. In addition, future studies with more frequent sampling also could allow for further exploration of different patterns of CKD progression.
In conclusion, our study assessed the quantitative utility of SDMA−1 and CREA−1 slopes as a diagnostic tool in the evaluation of early-stage CKD. Quantitative slope cutoffs for SDMA−1 (−0.0007 [μg/dL]−1/week) and CREA−1 (−0.0117 [mg/dL]−1/week) were derived mathematically based on comparisons between well-characterized HD and dogs with progressive CKD caused by XLHN. The cutoffs could serve as initial guidelines to characterize CKD in dogs with naturally occurring CKD. Risk factors for CKD progression and their amelioration are insufficiently understood in humans as well as in dogs.35 Identification of the risks, mediators, and management of progressive CKD requires standardized criteria to define CKD progression. The CREA−1 and SDMA−1 slopes provide a quantifiable standard to characterize risk factors for progression and to identify evidence-based approaches for management.
ACKNOWLEDGMENT
Funding for the study was provided by IDEXX Laboratories, Inc. The authors acknowledge Dr. George Lees for his contributions to the canine XLHN model.
CONFLICT OF INTEREST DECLARATION
G. Farace, D. Szlosek, Z. Ouyang, S. Peterson, M. Beall, and M. Yerramilli are employed by and have stock or stock options with IDEXX Laboratories, Inc. L. D. Cowgill, G. Segev, S. Vaden, S. Ross, C. Dufayet, L. A. Cohn, M. Nabity, and D. Polzin have received travel reimbursement and honoraria from IDEXX Laboratories, Inc. within the past 5 years. Shelly Vaden serves as Associate Editor for the Journal of Veterinary Internal Medicine. She was not involved in review of this manuscript.
OFF-LABEL ANTIMICROBIAL DECLARATION
Authors declare no off-label use of antimicrobials.
INSTITUTIONAL ANIMAL CARE AND USE COMMITTEE (IACUC) OR OTHER APPROVAL DECLARATION
University of Missouri IACUC approval, and Texas A&M University IACUC approval.
HUMAN ETHICS APPROVAL DECLARATION
Authors declare human ethics approval was not needed for this study.


