Altered fibrin network structure and fibrinolysis in intensive care unit patients with COVID-19, not entirely explaining the increased risk of thrombosis
Manuscript Handled by: Tetsumei Urano
Final decision: Tetsumei Urano, 16 March 2022
Funding information
This work was supported by the Netherlands Thrombosis Foundation (Grant/Award Number: 2020_A) and The Netherlands Organization for Health Research and Development (Grant/Award Number: 10430012010004).
Abstract
Background
Severe acute respiratory syndrome coronavirus 2 infection is associated with an increased incidence of thrombosis.
Objectives
By studying the fibrin network structure of coronavirus disease 2019 (COVID-19) patients, we aimed to unravel pathophysiological mechanisms that contribute to this increased risk of thrombosis. This may contribute to optimal prevention and treatment of COVID-19 related thrombosis.
Patients/Methods
In this case-control study, we collected plasma samples from intensive care unit (ICU) patients with COVID-19, with and without confirmed thrombosis, between April and December 2020. Additionally, we collected plasma from COVID-19 patients admitted to general wards without thrombosis, from ICU patients with pneumococcal infection, and from healthy controls. Fibrin fiber diameters and fibrin network density were quantified in plasma clots imaged with stimulated emission depletion microscopy and confocal microscopy. Finally, we determined the sensitivity to fibrinolysis.
Results
COVID-19 ICU patients (n = 37) and ICU patients with pneumococcal disease (n = 7) showed significantly higher fibrin densities and longer plasma clot lysis times than healthy controls (n = 7). No differences were observed between COVID-19 ICU patients with and without thrombosis, or ICU patients with pneumococcal infection. At a second time point, after diagnosis of thrombosis or at a similar time point in patients without thrombosis, we observed thicker fibers and longer lysis times in COVID-19 ICU patients with thrombosis (n = 19) than in COVID-19 ICU patients without thrombosis (n = 18).
Conclusions
Our results suggest that severe COVID-19 is associated with a changed fibrin network structure and decreased susceptibility to fibrinolysis. Because these changes were not exclusive to COVID-19 patients, they may not explain the increased thrombosis risk.
Essentials
- COVID-19 is associated with an increased risk of thrombosis, especially in ICU patients.
- Fibrin network in COVID-19 ICU patients is denser and less prone to lysis than healthy controls.
- Fibrin network structure is similar in COVID-19 ICU and pneumococcal disease ICU patients.
- A changed fibrin network structure cannot fully explain the increased risk of thrombosis.
1 INTRODUCTION
Severe acute respiratory syndrome coronavirus 2 (SARS-CoV-2) is the cause of coronavirus disease 2019 (COVID-19), currently causing a global pandemic. SARS-CoV-2 mainly targets the human respiratory tract, causing flulike symptoms ranging from coughing to acute respiratory distress syndrome, requiring mechanical ventilation. Furthermore, COVID-19 patients show an increased risk of thrombotic events.1, 2 The incidence of these thrombotic events in COVID-19 intensive care unit (ICU) patients is higher than in ICU patients in general or in ICU patients with influenza.3, 4 This observation suggests that besides ICU admission, additional prothrombotic factors must play a role in the increased incidence of thrombotic complications in COVID-19 patients.
Characteristics of thrombi are largely influenced by properties of the fibrin network (e.g., fiber thickness, fiber density). The fibrin network properties are determined by many factors, such as variations in the fibrinogen molecule, fibrinogen concentration, or environmental factors such as inflammation.5, 6 Fibrinolysis, the timely removal of fibrin, is largely affected by the structure of the fibrin network7 and the level of fibrinolysis inhibitors, such as plasminogen activator inhibitor 1 (PAI-1).8 Therefore, an altered fibrin network structure (denser, prothrombotic) and decreased susceptibility to fibrinolysis could contribute to the increased risk of thrombosis in COVID-19 patients. By studying the fibrin network structure and fibrinolysis of plasma clots from COVID-19 patients, we aimed to unravel pathophysiological mechanisms that contribute to this increased risk of thrombosis. This knowledge may contribute to optimal prevention and treatment of COVID-19 related thrombosis.
2 PATIENTS AND METHODS
2.1 Study design and patient population
This study was a case-control study conducted in the Erasmus Medical Center in Rotterdam, the Netherlands, as part of The Dutch COVID & Thrombosis Coalition.9 Between April 2020 and December 2020, we collected plasma samples of COVID-19 patients admitted to the ICU. We included patients with and without a diagnosis of thrombosis during their stay at the ICU, confirmed using computed tomography pulmonary angiography or compression ultrasound (see Supplemental Methods for details). Samples were collected before and after diagnosis of thrombosis or at similar time points in ICU patients without confirmed thrombosis. Additionally, we collected plasma from COVID-19 patients admitted to general wards who did not have thrombosis confirmed by computed tomography pulmonary angiography, SARS-CoV-2–negative ICU patients with pneumococcal infection, and healthy controls.10 ICU patients with pneumococcal infection were confirmed by positive blood cultures, and were without clinical suspicion of thrombosis. Study protocols were in accordance with the Declaration of Helsinki and were approved by the Medical Ethics Committee of Erasmus MC (healthy controls: MEC-2004-251; ICU patients with pneumococcal infection: MEC-2017-417; COVID-19 ward and ICU patients: METC-2020-0758). We obtained written informed consent from each healthy control and ICU patient with pneumococcal infection. An opt-out procedure was in place for the COVID-19 ward and ICU patients.
2.2 Laboratory measurements
Blood from all subjects was collected into 3.2% trisodium citrate tubes (9:1 v/v, Becton Dickinson) and centrifuged 15 min at 2500g at room temperature, followed by 20 000g for 10 min. The obtained platelet-poor plasma was stored in aliquots at −80°C until thawed at 37°C immediately before use. Fibrinogen levels were measured using the Clauss assay (Thrombin Reagent, Siemens Healthineers), factor VIII (FVIII) levels using a one-stage clotting assay and FXIII levels with a chromogenic assay using the Berichrom FXIII kit (Siemens Healthineers). In addition, levels of D-dimer (Siemens Healthineers) and anti-Xa (Werfen) were routinely measured. All parameters were measured on the Sysmex CS5100 coagulation analyzer (Siemens Healthcare Diagnostics B.V.). Other relevant parameters (e.g., C-reactive protein) were routinely measured. PAI-1 levels were measured using the human Serpin E1/PAI-1 DuoSet ELISA kit (DY1786, R&D Systems) according to the protocol provided by the manufacturers, with some minor changes in the volumes of samples, detection antibody, and streptavidin-horseradish peroxidase (50 µl instead of 100 μl). Values above the standard of the ELISA were given the maximum value of the standard (40 ng/ml).
2.3 Clot formation and image analysis
To study the properties of the fibrin network, clots were made from citrated platelet-poor plasma using 1 U/ml thrombin (T7009, Sigma Aldrich) and 17 mM CaCl2 (all final concentrations) in the presence of 0.1 mg/ml AF488-labeled fibrinogen (F13191, Thermo Fisher Scientific). The mixture was incubated for 1.5 h at room temperature in a humid environment and fixated in 4% paraformaldehyde. The clots were imaged using the Leica TCS SP8 microscope (Leica Microsystems). Images for the quantification of fibrin fiber diameters were recorded using time-gated stimulated emission depletion (STED) microscopy with a Leica HC PL APO CS2 86x/1.20 water immersion objective and a pixel size of 26.4 nm. To measure fibrin density, Z-stacks of a larger field of view were recorded using confocal microscopy with a LEICA HC PL APO CS2 40x/1.30 oil immersion objective and a pixel size of 67.6 nm. Fibrin fiber diameters were determined in STED images using the Local Thickness analysis in ImageJ11-13 and fibrin network density was measured as percentage of area above an automatic threshold determined using the Otsu method in Z-stacks recorded by confocal microscopy (see Supplemental Methods for details).
2.4 Global fibrinolysis assay
Plasma clot lysis time was measured to investigate the susceptibility of plasma clots to fibrinolysis, as described in Talens et al.14 In short, platelet-poor plasma was mixed with tissue factor, CaCl2, tissue type plasminogen activator, and phospholipids. Clot turbidity was measured at 405 nm after which clot lysis times were determined using the clot lysis analysis app as described by Longstaff et al.15 In addition, the difference between the maximum absorbance and baseline absorbance was measured (turbidity change).
2.5 Statistical analysis
Normally distributed data were shown as mean ± standard deviation, not-normally distributed data as median [25th–75th percentile] and categorical data as n (%). To test for differences between multiple groups, one-way ANOVA (normally distributed data), Kruskal-Wallis test (not-normally distributed data), or χ2 (categorical data) was used with post hoc Tukey tests. Changes between COVID-19 ICU patients with and without confirmed thrombosis at the second time point were assessed using independent Student t-test (normally distributed data) or Mann-Whitney U test (not-normally distributed data). Changes in variables over time were evaluated using the paired Student t-test (normally distributed data) or Wilcoxon signed-rank test (not-normally distributed data). One-way analysis of covariance was used to assess the effect of COVID-19 disease state (independent variable) on clot characteristics (dependent variables) while adjusting for fibrinogen level. Not-normally distributed variables were log-transformed before using them as dependent variable in the one-way analysis of covariance. We used pairwise deletion in case of missing data. Statistical analyses were performed using IBM SPSS Statistics v25 (IBM) and GraphPad Prism version 8.2.1 (GraphPad Software).
3 RESULTS
3.1 Baseline patient characteristics
Patient characteristics at the time point of the first available sample after admission are shown in Table 1. Of the 19 COVID-19 ICU patients with confirmed thrombosis, 16 had pulmonary thrombosis, 1 deep venous thrombosis, 1 pulmonary thrombosis in combination with deep venous thrombosis, and 1 jugular vein thrombosis. The diagnosis of thrombosis in the COVID-19 ICU patients was made after a median of 10 [6-17] days on the ICU.
| - | Healthy controls (n = 7) | ICU patients with pneumococcal infection (n = 7) | COVID-19 ward patients (n = 10) | COVID-19 ICU without thrombosis (n = 18) | COVID-19 ICU with thrombosis (n = 19) | p-value |
|---|---|---|---|---|---|---|
| Age (years) (mean ± SD) | 57.0 ± 4.7 | 58.7 ± 9.7 | 60.2 ± 10.6 | 56.5 ± 15.8 | 57.8 ± 14.9 | .97a |
| Male (n, %) | 2 (29%) | 3 (43%) | 5 (50%) | 12 (67%) | 13 (68%) | .32b |
| BMI (mean ± SD) | 23.2 ± 2.1 | 27.1 ± 5.9 | 30.8 ± 6.5 | 30.9 ± 8.0c | 29.8 ± 4.8 | .06a |
| Day at ICU (days) (median [25th–75th percentile]) | - | 0 [0-0] | - | 5 [3-8]d | 2 [1-6]d | <.01e |
| Anticoagulation (n, %) | - | - | - | - | - | <.01b |
| None | 7 (100%) | 0 (0%) | 0 (0%) | 0 (0%) | 0 (0%) | - |
| Standard | 0 (0%) | 6 (86%) | 10 (100%) | 6 (33%) | 2 (11%) | - |
| Intermediate | 0 (0%) | 0 (0%) | 0 (0%) | 10 (56%) | 14 (74%) | - |
| Therapeutic | 0 (0%) | 1 (14%) | 0 (0%) | 2 (11%) | 3 (16%) | - |
| Anti-Xa (U/ml) (median [25th–75th percentile]) | <0.10 | 0.26 ± 0.24 | 0.17 ± 0.12 | 0.37 ± 0.22c | 0.54 ± 0.28d, f, c | <.01a |
| Corticosteroids (n, %) | - | 2 (29%) | 7 (70%) | 11 (61%) | 10 (53%) | .02b |
| Mortality (n, %) | 0 (0%) | 0 (0%) | 0 (0%) | 1 (6%) | 4 (21%) | .36b |
| Laboratory measurements | - | - | - | - | - | - |
| CRP (mg/L) (median [25th–75th percentile]) | NA | 320 [287-509]f | 15 [12-45] | 105 [69-157]f, d | 172 [88-240]f | <.01a |
| Fibrinogen (g/L) (mean ± SD) | 2.9 ± 0.5 | 8.4 ± 2.7f, c | 3.6 ± 0.6 | 6.0 ± 1.6f, c | 6.4 ± 2.5f, c | <.01a |
| D-dimer (mg/L) (median [25th–75th percentile]) | 0.21 [0.19-0.28] | 1.57 [1.03-6.43]f, c | 0.41 [0.26-0.75] | 1.02 [0.75-2.07]c | 1.35 [0.85-3.26]f, c | <.01e |
| FVIII (U/ml) (mean ± SD) | 0.81 ± 0.27 | 2.12 ± 1.32 | 2.61 ± 1.12c | 3.39 ± 1.20c | 3.07 ± 1.17c | <.01a |
| FXIII (U/ml) (mean ± SD) | 1.32 ± 0.19 | 0.72 ± 0.58f, c | 1.36 ± 0.24 | 0.85 ± 0.25f, c | 0.95 ± 0.27f | <.01a |
| PAI−1 (ng/ml) (median [25th–75th percentile]) | <0.3 | 19.0 [3.6-30.8]c | 3.5 [2.7-4.8] | 6.5 [4.5-8.0]c | 10.2 [4.5-32.3]f, c | <.01e |
- Abbreviations: BMI, body mass index; CRP, C-reactive protein; ICU, intensive care unit; PAI-1, plasminogen activator inhibitor 1.
- a One-way ANOVA.
- b Fisher exact test.
- c Significantly different from healthy controls.
- d Significantly different from ICU patients with pneumococcal infection.
- e Kruskal-Wallis test.
- f Significantly different from coronavirus disease 2019 ward patients.
3.2 Fibrin network structure and fibrinolysis at the first time point
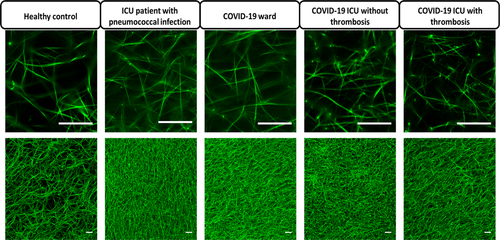
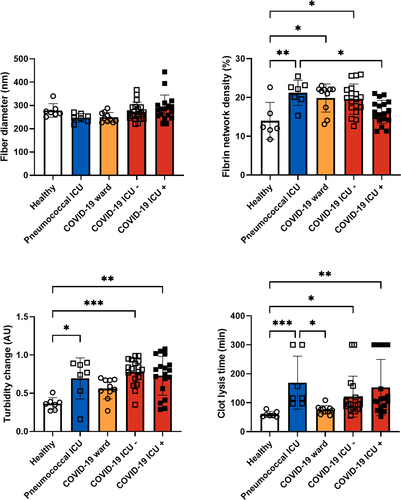
Representative STED and confocal images of clots prepared from plasma obtained at the first time point of the different groups are shown in Figure 1. Fiber diameter was similar in the different groups (Figure 2). Fibrin network density was significantly higher in ICU patients with pneumococcal infection, COVID-19 ward patients, and COVID-19 ICU patients without thrombosis compared with healthy controls. Fibrin network density was significantly lower in COVID-19 ICU patients with thrombosis than in ICU patients with pneumococcal infection (Figure 2). Turbidity change measured in the fibrinolysis assay was significantly higher in all ICU patient groups than in healthy controls (Figure 2). Adjustment for fibrinogen levels in the statistical analyses did not change these results (Table S1). Clot lysis time was significantly longer in COVID-19 ICU patients with and without thrombosis and ICU patients with pneumococcal infection than in healthy controls, regardless of fibrinogen levels (Figure 2 and Table S1). Interestingly, in the clot lysis assay, no fibrinolysis was observed in 26% (5/19) of COVID-19 ICU patients with confirmed thrombosis versus 11% (2/18) of COVID-19 ICU patients without confirmed thrombosis. This absence of fibrinolysis also occurred in 29% (2/7) of ICU patients with pneumococcal infection but was not observed in clots from healthy controls and COVID-19 ward patients. Patients with this absence of fibrinolysis had significantly higher levels of PAI-1 (38.5 [9.7-40.0] ng/ml) than patients who did show fibrinolysis within 300 min (5.0 [2.4-7.6] ng/ml, p < .01). Overall, clot lysis times were positively correlated with PAI-1 levels (Spearman correlation coefficient 0.725, p < .01) (Table S2). Parameters measured using microscopy did not correlate well with parameters measured in the fibrinolysis assay. Because we used thrombin and undiluted plasma in microscopy and tissue factor and two-fold diluted plasma in the fibrinolysis assay, the lack of correlations might be caused by the different involvement of the coagulation cascade.


3.3 COVID-19 ICU patients with and without thrombosis
In plasma samples collected at the first time point, we did not observe any significant differences in levels of coagulation factors between COVID-19 ICU patients who did and did not develop thrombosis. In plasma samples collected after diagnosis of thrombosis (or at similar time points in patients without confirmed thrombosis), we observed significantly higher levels of fibrinogen, D-dimer, and PAI-1 in patients with confirmed thrombosis than in patients without confirmed thrombosis (Table S3). Anti-Xa levels were significantly higher in patients with confirmed thrombosis than in patients without confirmed thrombosis, reflecting anticoagulant treatment.
3.4 Fibrin network structure and fibrinolysis after diagnosis of thrombosis in COVID-19 ICU patients
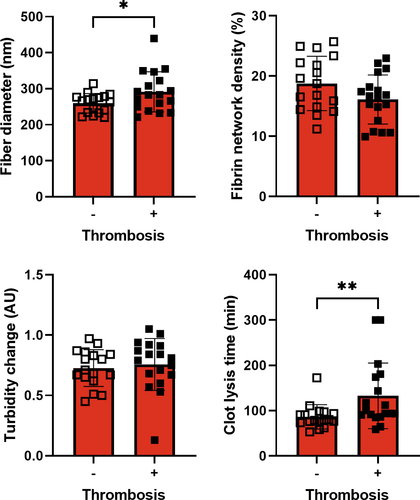
When comparing clots at the second time point, we observed significantly thicker fibers and longer clot lysis times in COVID-19 ICU patients with thrombosis than in COVID-19 ICU patients without thrombosis (Figure 3), even after adjustment for fibrinogen. Moreover, fibrin network density was significantly lower in patients with thrombosis when adjusting for fibrinogen levels. In 11% (2/18) of patients with thrombosis, no fibrinolysis was observed in 300 min, whereas this absence of fibrinolysis was not observed in patients without thrombosis at the second time point. These differences in fiber thickness and clot lysis time remained significant after adjustment for fibrinogen.

3.5 Changes in FVIII levels and fibrinolysis in COVID-19 ICU patients over time
FVIII levels significantly increased over time in COVID-19 ICU patients with thrombosis (Table S3). Clot lysis time significantly decreased over time in patients without confirmed thrombosis. There were no other significant changes in coagulation factors or fibrin network characteristics over time.
4 DISCUSSION
Our study revealed that fibrin network structure and susceptibility to lysis were altered in COVID-19 ward and ICU patients compared with healthy controls. A denser fibrin network and decreased susceptibility to fibrinolysis are found in patients with thrombotic disorders7 and could therefore contribute to the increased risk of thrombosis in COVID-19 patients. However, no significant differences in fibrin structure and fibrinolysis were seen in COVID-19 ICU patients compared with ICU patients with pneumococcal infection without COVID-19. These findings suggest that the observed changes in fibrin network structure and susceptibility to lysis are not caused explicitly by SARS-CoV-2 but might be a more common observation in patients with severe infectious disease involving a high immune response. Therefore, our study does not explain the reported increased risk of thrombosis in COVID-19 ICU patients compared with other ICU patients,3, 4 but additional pathophysiological mechanisms specific to COVID-19 must be present.16 In another recent study, clots of critically ill COVID-19 patients were shown to be denser and more resistant to fibrinolysis compared with clots from influenza patients with acute respiratory distress syndrome.17 However, these influenza patients had lower fibrinogen levels than the COVID-19 patients, which could explain why differences were observed in this study. In addition, Wygrecka et al. activated the contact pathway in their experiments, whereas we used thrombin or tissue factor, which could also explain the different findings.
At the first time point in our study, fibrin network structure and fibrinolysis of plasma clots from COVID-19 ICU patients with thrombosis were not significantly different from COVID-19 ICU patients without confirmed thrombosis. However, the development of thrombosis in COVID-19 patients is probably not binary. It is expected that most, if not all, severe COVID-19 patients develop (micro)thrombi to some degree, which are not always detected.18 This might explain why we did not see large differences between COVID-19 ICU patients with and without confirmed thrombosis at the time point before thrombosis. In contrast, we saw thicker fibers and lower fibrin density in plasma clots from COVID-19 ICU patients after diagnosis of thrombosis than in clots from patients without confirmed thrombosis at similar time points. These differences in fibrin network structure are described as antithrombotic.19 They can possibly be explained by the increased doses of anticoagulation in the patients with thrombosis, which are shown to have antithrombotic effects on the fibrin network structure.20-22 Interestingly, despite these high doses of anticoagulation, plasma clots from patients with thrombosis still showed reduced susceptibility to fibrinolysis compared with COVID-19 ICU patients without thrombosis on the second time point. Therefore, factors other than the changed fibrin network structure must be present, explaining the decreased susceptibility to fibrinolysis, such as fibrinolysis inhibitors.23 Indeed, we observed higher PAI-1 levels in patients with thrombosis than in patients without thrombosis at the second time point. Increased activation of the coagulation cascade or inhibition of fibrinolysis in COVID-19 ICU patients with thrombosis compared with COVID-19 ICU patients without thrombosis could therefore explain the differences in fibrin network structure and fibrinolysis.24
4.1 Strengths and limitations
A strength of this study is that we used superresolution imaging and automated quantification to investigate fiber diameter and other structural properties of the fibrin network. The study also has some limitations. The small number of patients per group limited our options for statistical analyses, which would have been beneficial considering the heterogeneity within the groups in for example medication use, disease duration, and ICU length of stay. Furthermore, our ICU control patients had a bacterial infection instead of a viral infection, such as SARS-CoV-2. Still, our control group with pneumococcal infection was homogenous and showed symptoms similar to COVID-19 patients. Another potential important difference is the time of blood sampling. For the ICU patients with pneumococcal infection, blood samples were obtained on admission to the ICU. For the COVID-19 ICU patients, the first available blood sample after admission was collected, but this was in most cases not the day of admission. Also, it is important to note that even though there was no clinical suspicion of thrombosis in the ICU patients with pneumococcal infection, we cannot entirely exclude the possibility that thrombosis might have developed. Finally, we used platelet-poor plasma in our study. It should be noted that cells, such as red blood cells and platelets, have considerable effects on thrombus properties and may also contribute to thrombosis in COVID-19 patients.
5 CONCLUSIONS
Our results suggest that SARS-CoV-2 infection is associated with an altered fibrin network structure and decreased clot susceptibility to fibrinolysis. Because these changes were not exclusive to COVID-19 patients, they might not entirely explain the increased thrombosis risk observed in COVID-19 patients.
ACKNOWLEDGMENTS
The authors thank Debby Priem-Visser, Aarazo Barakzie, and the technicians of the hemostasis laboratory for their excellent technical assistance. Furthermore, the authors thank all contributors from the Dutch COVID & Thrombosis Coalition (Appendix S1) for providing the framework for the current study.
CONFLICT OF INTEREST
J.J.d.V., C.V., L.G., J.A.S., N.D.v.K., C.M., H.I.B., E.C.M.v.G., M.G., J.P.C.v.d.A., H.E., D.C.R., and M.P.M.d.M. declare to have no conflicts of interest. J.R.M. reports consulting fees and lecture honoraria from Boehringer Ingelheim and lecture honoraria from Novartis and Roche, all outside the submitted work. M.J.H.A.K. has received unrestricted grants paid to the department for research outside this work from Bayer and Daiichi Sankyo and has received a speaker's fee paid to the department from Bayer.
AUTHOR CONTRIBUTIONS
Judith J. de Vries: Conceptualization, investigation, formal analysis, visualization, writing – original Draft. Chantal Visser: Conceptualization, investigation, writing – original draft. Lotte Geers: Investigation, writing – original draft. Johan A. Slotman: Methodology, software, writing – review & editing. Nadine D. van Kleef: Investigation, writing – review & editing. Coen Maas: Methodology, resources, writing – review & editing. Hannelore I. Bax: Resources, writing – review & editing. Jelle R. Miedema: Resources, writing – review & editing. Eric C. M. van Gorp: Conceptualization, writing – review & editing. Marco Goeijenbier: Resources, writing – review & editing. Johannes P. C. van den Akker: Resources, writing – review & editing. Henrik Endeman: Conceptualization, resources, writing – review & editing. Dingeman C. Rijken: Methodology, supervision, writing – review & editing. Marieke J. H. A. Kruip: Conceptualization, resources, writing – review & editing, supervision, funding acquisition. Moniek P. M. de Maat: Conceptualization, writing – review & editing, supervision.


