Morphology of Gambierdiscus scabrosus sp. nov. (Gonyaulacales): a new epiphytic toxic dinoflagellate from coastal areas of Japan
Abstract
A new epiphytic dinoflagellate is described, G ambierdiscus scabrosus sp. nov., from tidal pools and rocky shores along the coastal areas of Japan. Cells are 63.2 ± 5.7 μm in depth, 58.2 ± 5.7 μm in width, and 37.3 ± 3.5 μm in length. The plate formula of G . scabrosus is Po, 4′, 0a, 6′′, 6c, ?s, 5′′′, 0p, and 2′′′′. Morphologically, G . scabrosus resembles G . belizeanus as follows: anterioposteriorly compressed cell shape, narrow 2′′′′ plate, and areolated surface. Despite this similarity, the cells of G . scabrosus can be distinguishable by the presence of the asymmetric shaped 3′′ plate and the rectangular shaped 2′ plate.
Abbreviations
-
- CFP
-
- ciguatera fish poisoning
-
- DAPI
-
- 4,6-diamidino-2-phenylindole
-
- LSU rDNA
-
- large subunit rDNA
-
- SSU rDNA
-
- small subunit rDNA
Ciguatera fish poisoning (CFP) is one of the most significant marine food-borne illnesses caused by eating reef fish and is endemic throughout the tropical and subtropical Pacific, the Indian Ocean, and the tropical Caribbean Sea (Ragelis 1984, Bagnis 1993, Yasumoto and Satake 1996, Fleming et al. 1998, Lehane and Lewis 2000, Chinain et al. 2010, Tester et al. 2010, 2013). In recent years, CFP incidents have increasingly been reported not only from the subtropical area of Japan, but also from the temperate area (Taniyama 2008, Ishikawa and Kurashima 2010, Oshiro et al. 2010, 2011, Toda et al. 2012).
In the late 1970s, a marine epiphytic dinoflagellate was discovered and identified as a possible producer of the toxins responsible for CFP (Yasumoto et al. 1977), and later described as Gambierdiscus toxicus Adachi and Fukuyo by morphological observations using light microscopy (LM) and scanning electron microscopy (SEM) (Adachi and Fukuyo 1979). Routine identification of Gambierdiscus species using LM and SEM is difficult even for trained taxonomists because species descriptions are often based on subtle differences in the thecal plate morphology (Adachi and Fukuyo 1979, Faust 1995, Holmes 1998, Chinain et al. 1999, Richlen et al. 2008, Litaker et al. 2009, Fraga et al. 2011, Vandersea et al. 2012) that are mostly quantitative and largely overlapping. Nevertheless, several morphological characteristics were proposed as useful diagnostic characteristics for distinguishing species of Gambierdiscus (Faust 1995, Holmes 1998, Chinain et al. 1999, Litaker et al. 2009, Fraga et al. 2011), in that currently 11 valid species exist (G. toxicus, Adachi and Fukuyo, 1979; G. belizeanus, Faust, 1995; G. yasumotoi, Holmes, 1998; G. pacificus, G. australes, and G. polynesiensis, Chinain et al., 1999; G. caribaeus, G. carolinianus, G. carpenteri, and G. ruetzleri, Litaker et al., 2009; and G. excentricus, Fraga et al., 2011) and each species was recovered as a robust clade in phylogenetic analyses based on the nuclear-encoded ribosomal RNA gene (rDNA) (Chinain et al. 1999, Litaker et al. 2009, Fraga et al. 2011).
In Japan over the past few decades, several investigations revealed that Gambierdiscus spp. are widely distributed from subtropical to temperate areas (Hara and Horiguchi 1982, Koike et al. 1991, Fukuyo et al. 2002, Ishikawa and Kurashima 2010, Kuno et al. 2010, Omura et al. 2010, Hatayama et al. 2011, Nishimura et al. 2013). In this article, we describe a new species of Gambierdiscus, G. scabrosus, which was reported as Gambierdiscus sp. type 1 in our previous paper (Nishimura et al. 2013) and resembles G. belizeanus in gross morphology, but differs in the morphology of some thecal plates and in the phylogeny. Taxonomic discussion of Gambierdiscus species is also given.
Materials and Methods
Source of specimens and culture conditions
Clonal strains of Gambierdiscus scabrosus sp. nov. from the southern part of Japan were established between 2007 and 2010 (Table S1 in the Supporting Information). All sampling sites were situated in shallow waters from 0 to 3 m deep. Two clonal strains of G. belizeanus (CCMP399 and CCMP401) were obtained as live strains from the National Center for Marine Algae and Microbiota (NCMA; formerly the CCMP, West Boothbay Harbor, ME, USA). All the clonal strains were maintained with IMK/2, namely, half concentration of Daigo IMK (Nihon Pharmaceutical, Tokyo, Japan) medium using GF/F-filtered sea water (salinity 31 ± 1) in polypropylene-capped test tubes (25 × 150 mm) with a flat bottom (Maruemu, Osaka, Japan) containing 20 mL of medium at 25°C, under 100 μmol photons · m−2 · s−1 from cool-white tubes with a 12:12 h L:D photoperiod (Nishimura et al. 2013). Cells of G. scabrosus (hereafter, environmental G. scabrosus) were isolated from a macroalga substrata, Gelidium elegans collected from Kutsu (Susaki City, Kochi, Japan; 33°23′ 38 N, 133°20′ 29 E) on November 16th, 2011, using a micropipette under an inverted microscope IX-70 (Olympus, Tokyo, Japan).
Light microscopy
LM observations were carried out under an inverted microscope IX-70 (Olympus) with bright field optics. The cultured cells during the exponential growth phase of G. scabrosus, the environmental cells of G. scabrosus and the cultured cells during the exponential growth phase of G. belizeanus were observed alive or fixed with glutaraldehyde (final concentration of 4% in sea water) (Faust 1995). After 1 h at room temperature, the specimens were rinsed with dH2O twice. Concentrated cells (25 μL) were placed on a microscope slide and then the cells were overlaid with a coverslip. Microphotographs were taken with a Moticam2000 (Shimadzu Rika, Tokyo, Japan).
To identify the plate pattern, LM observations using calcofluor staining were carried out under an epifluorescence microscope BH-2 (Olympus) with UV light for three strains (G. scabrosus strain KW070922_1, G. belizeanus strain CCMP399 and strain CCMP401). Concentrated cells (25 μL) treated as above were placed on a microscope slide and then 1 μL of calcofluor stock solution (1 mg · mL−1) of Fluorescent Brightener 28 (Sigma, St Louis, MO, USA) was added to the slide. The cells were overlain with a coverslip and observed using a U excitation filter cube unit (BH2-DMU; Olympus) with an excitation filter (UG-1; Olympus). The cells were dissected, or squashed by gently pressing the cover slip over them. Microphotographs were taken with a WAT-231S2 (Watec, Yamagata, Japan). When the depth of field was not enough to have the whole object in focus, several pictures were taken at different foci and were then merged using CombineZM (Alan Hadley, UK, www.hadleyweb.pwp.blueyonder.co.uk/).
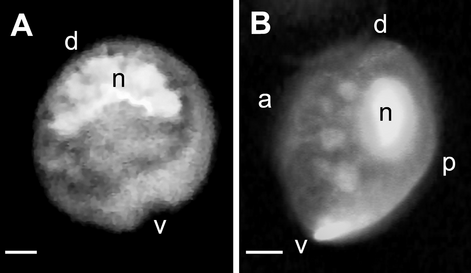
To identify the shape and location of the nucleus, cultured cells were stained with 4,6-diamidino-2-phenylindole (DAPI) as follows: Culture (3 mL) was fixed with glutaraldehyde (final concentration of 4% in sea water; Faust 1995). After 1 h at room temperature, the specimens were stained with 0.3 mL of DAPI solution (10 μg · mL−1) over 15 min. The cells were also observed with an epifluorescence microscope BH-2 (Olympus) with UV light using a U excitation filter cube unit (BH2-DMU; Olympus) with an excitation filter (UG-1; Olympus). Microphotographs were taken with a WAT-231S2 (Watec).
Scanning electron microscopy
Thecal morphology and plate tabulation were examined with SEM. The cultured and environmental cells that were used for the LM observations were fixed with glutaraldehyde (final concentration of 4% in sea water) (Faust 1995). After 1 h at room temperature, the specimens were rinsed with distilled water several times, sonicated using a US-5 ultrasonic cleaner (AS ONE, Osaka, Japan) for 3 min to remove bacterial substances attached to the cell surface, and dehydrated with an ethanol series (70%, 90%, and 99.5% ×2). Specimens (50–100 μL) were mounted onto SEM stubs directly and dried by hot plate, then coated with Pt using a JFC-1600 Auto Fine Coater (JEOL, Tokyo, Japan). SEM JSM-6500F (JEOL) was used at accelerating voltages of 5 kV.
Size measurement
In this study, a modified Kofoid tabulation system (Kofoid 1909) as described in Basada et al. (1982) was adopted to name the plates thereby allowing comparisons with other genera of Gonyaulacales, with the plate formula being Po, 4′, 0a, 6′′, 6c, ?s, 5′′′, 0p, and 2′′′′. In order to make possible the comparisons with previous literatures adopting Kofoid tabulation system for Gambierdiscus (e.g., Faust 1995, Chinain et al. 1999, Litaker et al. 2009), the names for each plate are as follows: Po (Po in Kofoid tabulation system), 1′ (1′′), 2′ (2′), 3′ (3′), 4′ (1′), 1′′ (2′′), 2′′ (3′′), 3′′ (4′′), 4′′ (5′′), 5′′ (6′′), 6′′ (7′′), 1′′′ (1′′′), 2′′′ (2′′′), 3′′′ (3′′′), 4′′′ (4′′′), 5′′′ (5′′′), 1′′′′ (1′′′′), 2′′′′ (1p), and S.p. (2′′′′).
Cell size and the thecal plates for each microphotograph were measured using an ImageJ 1.42q (Wayne Rasband, National Institutes of Health, USA). For LM with bright field optics, the size of 55 or 58 cells each of 10 clonal strains during the exponential growth phase of G. scabrosus, 14 cells of environmental G. scabrosus, and 68 or 70 cells of two clonal strains during the exponential growth phase of G. belizeanus was measured. For LM with UV light using calcofluor staining, the size of 81 cells of G. scabrosus clonal strain KW070922_1 during the exponential growth phase, and 61 or 87 cells of two clonal strains during the exponential growth phase of G. belizeanus was measured respectively. For SEM, the size of 18–38 cells each of 18 clonal strains during the exponential growth phase of G. scabrosus, 13 cells of environmental G. scabrosus, and 36 or 37 cells of clonal strains during the exponential growth phase of G. belizeanus was measured.
In this study, we measured the morphological characteristics as above and calculated the ratio of cell size and plate suture length as follows: for cell size using LM and SEM, depth (D: measured along the dorsal-ventral axis), width (W: measured along the lateral [right-left] axis), length (L: measured along the apical-antapical axis), ratio of D to W and ratio of L to W; for the epitheca using SEM, length (L), width (W), and ratio of L to W of apical pore plate (Po), number and diameter of pores in Po; for the epitheca using LM and SEM, the ratio of 2′/3′ to 2′/4′ plate suture length, the ratio of 2′/1′′ to 2′/3′′ plate suture length, and the ratio of 3′′/2′′ to 3′′/4′′ plate suture length; and for the hypotheca using LM and SEM, length (L: measured along the dorsal-ventral axis), width (W: measured along lateral [right-left] axis) and ratio of L to W of the 2′′′′ plate. For these measurements and examinations, only LM and SEM microphotographs showing the full shape and size of each plate (that is, viewed from directly above) were used. In particular, for each plate measurement of calcofluor stained cells, the cells were dissected or squashed.
Statistical analyses were assessed using Ekuseru-Toukei 2012 (SSRI, Tokyo, Japan) on the 2′ plate (ratio of 2′/1′′ to 2′/3′′ plate suture length) and the 3′′ plate (ratio of 3′′/2′′ to 3′′/4′′ plate suture length). We performed non-parametric analyses on all of the data sets, since these were not normal distribution. For LM data sets, the Mann–Whitney U-test was used to assess the cultured cells of G. scabrosus and those of G. belizeanus. For SEM data sets, the Steel-Dwass test was used to assess the cultured cells of G. scabrosus, environmental cells of G. scabrosus and cultured cells of G. belizeanus.
Results
Gambierdiscus scabrosus T. Nishim., Shin. Sato & M. Adachi sp. nov. (Figs. 1-5).
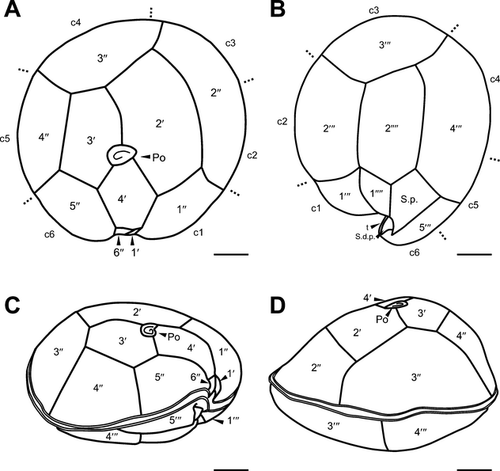
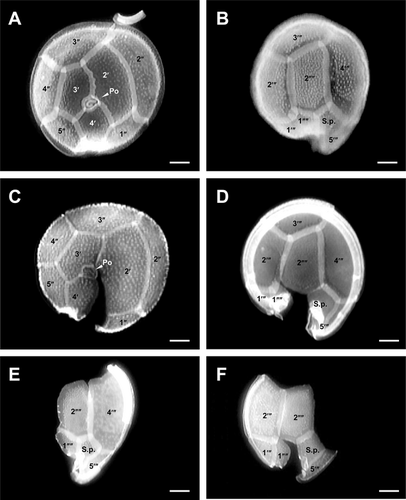
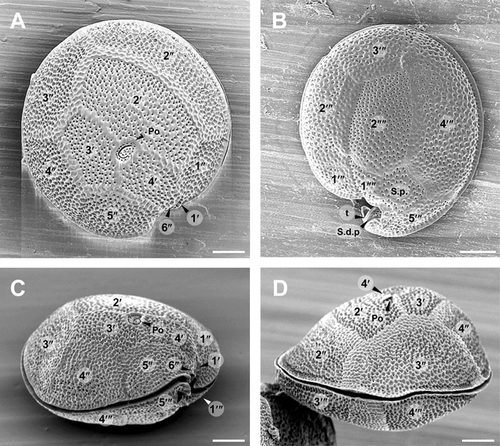
Diagnosis: Cells of G. scabrosus are photosynthetic, anterioposteriorly compressed, depth 63.2 ± 5.7 μm, width 58.2 ± 5.7 μm, and length 37.3 ± 3.5 μm. Cell lenticular, round to ellipsoid in apical view. The thecal surface is areolated. Thecal pores are numerous, round with a smooth edge. Flagella 2. Plate formula is Po, 4′, 0a, 6′′, 6c, ?s, 5′′′, 0p, and 2′′′′. In epitheca, the apical pore plate is elliptical, with about 29 pores and a large fishhook-shaped opening. The 2′ plate is the largest of apicals and is rectangular, the 3′ plate is median and is pentagonal, and the 4′ plate is small and is hexagonal. The 1′ plate is the smallest of apicals. The 2′′ and 3′′ plates are large, the 1′′, 4′′, and 5′′ plates are intermediate, and the 6′′ plate is minuscule, lying adjacent to the sulcus and posterior to the 4′ plate. The 3′′ plate is asymmetrical. The cingulum is narrow and deeply excavated. The sulcus is deep and pouchlike. In hypotheca, the 1′′′ and 5′′′ plates are small, the 2′′′ and 3′′′ plates are intermediate, and the 4′′′ plate is the largest of postcingulars. The 2′′′′ plate is intermediate, narrow, and pentagonal. The 1′′′′ plate and posterior sulcal plate (S.p.) are small. The nucleus is located on the dorsal side in hypotheca and is U-shaped with points towards the ventral side.
Holotype: A permanent slide TNS-AL-56993sa in TNS (Department of Botany, National Museum of Nature and Science, Japan) mounted from clonal strain KW070922_1 collected on September 22nd, 2007, as an epiphyte on macroalga in Kashiwa-jima Island, Otsuki, Kochi, Japan, kept in LAQUES (Laboratory of Aquatic Environmental Science, Kochi University, Japan).
Isotypes: A SEM stub (TNS-AL-56993ss) and glutaraldehyde fixed cells in a tube (TNS-AL-56993m) from clonal strain KW070922_1.
Type locality: Kashiwa-jima Island, Otsuki, Kochi, Japan (32°46′ 22 N, 132°37′ 31 E).
Etymology: The epithet refers to the areolated surface (rough surface) of the thecal plates. Latin, scabrosus (= rough).
Distribution: This species is distributed from the subtropical to the temperate areas around Japan, Pacific, from Touzato, Ishigaki Island, Ishigaki City, Okinawa, Japan (24°26′ 40 N, 124°15′ 27 E) to Itsumo, Kushimoto, Wakayama, Japan (33°27′ 10 N, 135°47′ 34 E).
Remarks: DNA sequences obtained from our clonal strains of G. scabrosus (Gambierdiscus sp. type 1 as shown in Nishimura et al. 2013) have been deposited in GenBank as follows: SSU rDNA (AB764229–AB764276, AB605799–AB605801, AB605806–AB605807, AB605811–AB605812) and LSU rDNA D8–D10 (AB765908–AB765912) (Nishimura et al. 2013). Clonal strain KW070922_1 (an authentic strain of G. scabrosus) have been barcoded in GenBank as follows: SSU rDNA (AB764244–AB764248) and LSU rDNA D8-D10 (AB765908–AB765909). Based on sequence similarity, two GenBank entries, AB499535 and AB499536, obtained from two strains that were annotated provisionally as Gambierdiscus sp. type 1 by Kuno et al. (2010) and might also be the SSU rDNA of G. scabrosus, and the ITS region have been deposited (AB499572–AB499605). Phylogenetic analyses for SSU rDNA and LSU rDNA D8–D10 of the Gambierdiscus species revealed that G. scabrosus was clearly separated from other Gambierdiscus species including G. belizeanus and received high nodal support (Nishimura et al. 2013). The genetic distance analyses (using uncorrected genetic distance) revealed that both genes of G. scabrosus showed species level genetic divergence from other Gambierdiscus species (Nishimura et al. 2013). In particular, the genetic distance (p distance) between the SSU rDNA of G. scabrosus and that of G. belizeanus was 0.050, which was larger than that of the pair G. yasumotoi vs. G. ruetzleri (0.004), which was the minimum value at interspecies level within the genus Gambierdiscus (Nishimura et al. 2013). Furthermore, the genetic distance between the SSU rDNA of G. scabrosus and G. belizeanus was larger than the minimum p distances at interspecies level of other protists, for example, dinoflagellate Peridinium (among 9 species, 0.013), diatom Cyclotella (among 6 species, 0.004), and diatom Discostella (among 4 species, 0.010) (Nishimura et al. 2013).
Mouse bioassay revealed that G. scabrosus showed both dichloromethane soluble fraction (a fraction expected to contain CTXs) toxicity and aqueous methanol soluble fraction (a fraction expected to contain MTXs) toxicity (Nishimura et al. 2013).
Morphology of G. scabrosus
In this study, we observed morphological characters for cultured cells of clonal strains of G. scabrosus (n = 10 and 18 strains for LM and SEM respectively) as well as environmental cells of G. scabrosus (n = 14 and 13 cells for LM and SEM respectively). The results of the observations showed that the morphological characters of the cultured cells of G. scabrosus (Table 1) were almost the same as those of the environmental cells of G. scabrosus (Table 1), with the exception that the cultured cells were slightly smaller than the environmental cells in both the LM and SEM observations (Table 1). Therefore, we used the results of the cultured cells, which were maintained using IMK/2 medium, for a description of the morphology of G. scabrosus. Details of the morphological observations and measurements of the cultured and environmental cells of G. scabrosus are summarized in Table 1 and Table S2 in the Supporting Information.
| Morphological characteristic | LM | SEM | |||||||
|---|---|---|---|---|---|---|---|---|---|
| G. scabrosus | Environmental G. scabrosus | G. belizeanus | G. belizeanus a | G. scabrosus | Environmental G. scabrosus | G. belizeanus | G. belizeanus a | ||
| Cell size | Depth (D) (μm)b | 63.2 (5.7) | 65.5 (4.9) | 61.7 (3.1)c | 61.0 (6.0) | 62.5 (5.4) | 67.4 (6.1) | 63 (2.2)k , l | 66.6 (4.7) |
| Width (W) (μm) | 58.2 (5.7) | 58.0 (5.0) | 60.0 (4.5)d | 57.2 (5.2) | 58.2 (5.5) | 61.6 (4.3) | 58 (2.5)k , l | 59.5 (5.1) | |
| Length (L) (μm) | 37.3 (3.5) | 40.7 (NA) | 48.1 (4.2)e | 38.7 (4.3) | 36.6 (4.2) | NA | NA | 40.1 (3.9) | |
| Ratio of D to W | 1.09 (0.07) | 1.13 (0.05) | NA | 1.07 (0.08) | 1.08 (0.06) | 1.10 (0.07) | 1.03 (NA)f | 1.12 (0.05) | |
| Ratio of L to W | 0.64 (0.02) | 0.70 (NA) | 0.80 (NA)f | 0.68 (0.01) | 0.64 (0.05) | NA | NA | 0.67 (0.04) | |
| Apical pore plate (Po) | Ratio of 2′/3′ to 2′/4′ plate suture length | 1.26 (0.13) | NA | 1.21 (NA)g | 1.50 (0.31) | 1.48 (0.30) | 1.51 (0.23) | NA | 1.46 (0.22) |
| Length (L) (μm) | NA | NA | NA | NA | 6.3 (0.6) | 6.5 (0.4) | 6.1 (0.4)k, 5.38 (0.4)l | 6.4 (0.4) | |
| Width (W) (μm) | NA | NA | NA | NA | 4.4 (0.6) | 4.1 (0.4) | 3.9 (0.4)k , l | 4.5 (0.5) | |
| Ratio of L to W | NA | NA | NA | NA | 1.46 (0.20) | 1.62 (0.18) | 1.56 (NA)k, 1.38 (NA)l | 1.43 (0.17) | |
| Pores in Po | Number | NA | NA | NA | NA | 29 (3.7) | 31 (3.7) | 28 (1.5)k, 19 (5.7)l | 17 (2.6) |
| Diameter (μm) | NA | NA | NA | NA | 0.36 (0.05) | 0.36 (0.03) | 0.22 (0.03)k, 0.35 (0.03)l | 0.41 (0.05) | |
| 2′ plate | Shape | Rectangular | NA | Hatcheth | Hatchet | Rectangular | Rectangular | NA | Hatchet |
| Ratio of 2′/1″ to 2′/3″ plate suture length | 0.85 (0.16)* | NA | 0.64 (0.14)i | 0.66 (0.08)* | 0.75 (0.12)** | 0.73 (0.09)** | NA | 0.61 (0.11)** | |
| 3″ plate | Shape | Asymmetry | NA | Symmetry | Symmetry | Asymmetry | Asymmetry | NA | Symmetry |
| Ratio of 3″/2″ to 3″/4″ plate suture length | 0.70 (0.12)* | NA | 0.92 (NA)g | 1.01 (0.18)* | 0.75 (0.18)** | 0.67 (0.25)** | NA | 0.98 (0.17)** | |
| 2′′′′ plate | Shape | Narrow | NA | Narrowh | Narrow | Narrow | Narrow | Narrowh | Narrow |
| Length (L) (μm) | 36.1 (4.9) | NA | 38.01 (3.48)j | 33.0 (3.5) | 32.5 (3.1) | 34.0 (0.6) | 22.7 (2.3)k, 22 (2.3)l | 31.3 (2.9) | |
| Width (W) (μm) | 20.8 (2.7) | NA | NA | 17.8 (2.4) | 15.1 (2.0) | 15.6 (0.8) | 12 (2.1)k , l | 13.3 (1.4) | |
| Ratio of L to W | 1.74 (0.21) | NA | NA | 1.88 (0.21) | 2.18 (0.32) | 2.18 (0.15) | 1.88 (NA)k, 1.83 (NA)l | 2.37 (0.20) | |
- Values in parentheses are ± SD. NA: data not available. *Significant differences were obtained between cultured cells of G. scabrosus and those of G. belizeanus (Mann–Whitney U-test, P < 0.01). **Significant differences were obtained between cultured cells of G. scabrosus and those of G. belizeanus (Steel-Dwass test, P < 0.01), and between environmental cells of G. scabrosus and cultured cells of G. belizeanus (Steel-Dwass test, P < 0.05).
- a Data determined in this study (G. belizeanus strains CCMP399 and CCMP401).
- b Faust 1995 and Chinain et al. (1999) considered as “long” and “length” in their articles respectively.
- c Data taken from table 3 in Litaker et al. (2009).
- d Data taken from table 4 in Litaker et al. (2009).
- e Data taken from table 5 in Litaker et al. (2009).
- f Data taken from table 6 in Litaker et al. (2009).
- g Data measured from fig. 68 in Litaker et al. (2009).
- h Data taken from Litaker et al. (2009).
- i Data taken from table 7 in Litaker et al. (2009).
- j Data taken from table 11 in Litaker et al. (2009).
- k Data taken from table 1 in Chinain et al. (1999).
- l Data taken from table 2 in Litaker et al. (2009).
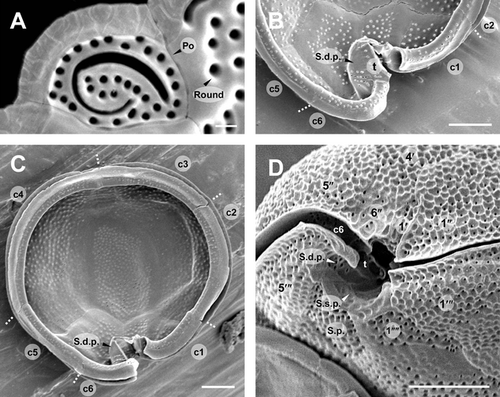
The cells of G. scabrosus are photosynthetic, anterioposteriorly compressed, lenticular, and round to ellipsoid in apical view (Figs. 1-3). The cells are symmetrical to slightly asymmetrical in dorsal view (Figs. 1D and 3D). The thecal surface is areolated (Fig. 3). The thecal pores of the cell are numerous (Fig. 3, A and B) and round with a smooth edge (Fig. 4A). There are two flagella. The plate formula is Po, 4′, 0a, 6′′, 6c, ?s, 5′′′, 0p, and 2′′′′ (Fig. 1). The nucleus is located on the dorsal side in the hypotheca and is U-shaped with points towards the ventral side (Fig. 5).
As measured by LM, the cultured cells of G. scabrosus have depth (D) 63.2 ± 5.7 μm, width (W) 58.2 ± 5.7 μm, length (L) 37.3 ± 3.5 μm, ratio of D to W 1.09 ± 0.07, and ratio of L to W 0.64 ± 0.02 (Table 1).
The epitheca of G. scabrosus consists of 11 plates: apical pore plate (Po), four apical plates, and six precingular plates (Figs. 1A and 3A). The Po is not centrally located, being displaced slightly toward the right ventral section of the epitheca. It exhibits a ratio of 2′/3′ to 2′/4′ suture length 1.26 ± 0.13 as measured by LM (Table 1 and Fig. 1A). The Po is ellipsoid with a ratio of length (L) to width (W) 1.46 ± 0.20 as measured by SEM (Table 1 and Fig. 4A). The Po has a large fishhook-shaped apical opening surrounded by rows of evenly distributed pores with a diameter of 0.36 ± 0.05 μm as measured by SEM (Table 1 and Fig. 4A). The number of pores in Po is 29 ± 3.7 as measured by SEM (Table 1). Of the four apical plates, the 2′ plate is the largest of apicals and is rectangular with a ratio of 2′/1′′ to 2′/3′′ plate suture length 0.85 ± 0.16 as measured by LM (Table 1 and Fig. 1A). The 3′ plate is median and is pentagonal, and the 4′ plate is smaller than the 3′ plate and is hexagonal (Figs. 1A, 2A and 3A). The 1′ plate is the smallest of apicals (Figs. 1A and 3A). Of the six precingular plates, the quadrangular 2′′ and 3′′ plates are large, the quadrangular 1′′, 4′′ and pentagonal 5′′ plates are intermediate, and the trapezium-shaped 6′′ plate is minuscule, lying adjacent with the 1′ plate to the sulcus and posterior to the 4′ plate (Figs. 1A and 3A). The 3′′ plate is asymmetrical with a ratio of 3′′/2′′ to 3′′/4′′ plate suture length 0.70 ± 0.12 as measured by LM (Table 1 and Fig. 1A).
The cingulum of G. scabrosus is narrow, deeply excavated, and consists of six narrow plates (c1 to c6) with a membrane list (Fig. 4C). The cingulum extends into the sulcus (Fig. 4, B and C). The sulcus of G. scabrosus is deep, pouchlike, and the posterior sulcal plate (S.p.) is out of it forming part of the hypotheca. The sulcus forms a two-chambered hollow divided by the transition plate (t; Fig. 4, B and D). The lower sulcal chamber includes the sulcal right posterior plate (S.d.p.) and sulcal left posterior plate (S.s.p.) (Fig. 4, C and D). It was not possible to analyze all the sulcal plates.
The hypotheca of G. scabrosus consists of eight plates: five postcingular plates and two antapical plates in addition to S.p. which is out of the sulcus (Figs. 1B; 2B; and 3B). Of the five postcingular plates, the triangular 1′′′ and the pentagonal 5′′′ plates are small (Figs. 1B and 3B). The quadrangular 2′′′ and the quadrangular 3′′′ plates are median in size, and the pentagonal 4′′′ plate is the largest of postcingulars (Figs. 1B; 2B; and 3B). Of the two antapical plates, the quadrangular 1′′′′ plate is small, lying parallel with the 2′′′′ plate at the dorsoventral axis (Figs. 1B; 2B; and 3B). The 2′′′′ plate is intermediate, narrow, asymmetrical, and pentagonal (Table 1; Figs. 1B; 2, B, D, E, F; and 3B). The ratio of length (L) to width (W) of the 2′′′′ plate is 1.74 ± 0.21 and 2.18 ± 0.32 as measured by LM and SEM respectively (Table 1). The dorsal corner of the 2′′′′ plate is acutely angled with respect to the dorsoventral axis of the cell (Figs. 1B; 2B; and 3B). The forked S.p. is small and is larger than the 1′′′′ plate (Figs. 1B; 2B; and 3B).
Ecology and behavior of G. scabrosus
G. scabrosus cells were found on macroalgae collected from tidal pools and rocky shores in Japanese coastal areas. G. scabrosus coexisted with other Gambierdiscus and other epiphytic dinoflagellates such as Ostreopsis, Coolia, Prorocentrum, and Amphidinium. At the collection sites, the sea surface temperature ranged from 21.1°C to 32.4°C and salinity was between 29.2 and 33.0 during summer and autumn when the G. scabrosus cells were collected (Nishimura et al. 2013). In our culture medium, the G. scabrosus cells often swam during the lag and exponential phase, whereas in the stationary phase the cells were sessile and sporadically showed striking motions. The motions were the beating of the longitudinal flagellum and the undulating motion of the transverse flagellum. Two sibling cells usually appeared close to one another or attached to each other after a cell division. G. scabrosus is apparently positively phototonic as cells tend to grow on the brighter side of a test tube where a light source was located in the culture chamber.
Similarities and differences of morphological character between G. scabrosus and G. belizeanus
The results of morphological observations by means of LM and SEM showed that G. scabrosus and G. belizeanus shared the following morphological characters: anterioposteriorly compressed cell outline (Figs. 1, C and D; 3, C and D; and 6), narrow and pentagonal 2′′′′ plate (Figs. 1B; 2B; 3B; and 6), and areolated thecal surface (Figs. 3 and 6). The cell size ranges in G. scabrosus and G. belizeanus largely overlapped (Table 1 and Table S2).
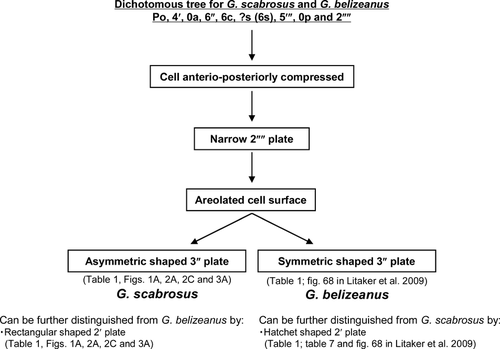
G. scabrosus, however, could be distinguished from G. belizeanus by the shape of the 3′′ plate (asymmetric vs. symmetric in G. scabrosus vs. G. belizeanus, Table 1; Figs. 1A; 2, A and C; 3A; and 6), and the shape of the 2′ plate (rectangular vs. hatchet in G. scabrosus vs. G. belizeanus, Table 1; Figs. 1A; 2, A and C; 3A; and 6). For both the morphological character of the 3′′ plate (ratio of 3′′/2′′ to 3′′/4′′ plate suture length) and the 2′ plate (ratio of 2′/1′′ to 2′/3′′ plate suture length), significant differences were obtained between G. scabrosus and G. belizeanus as follows: as measured by LM, significant differences were obtained between cultured G. scabrosus and cultured G. belizeanus (Table 1, Mann–Whitney U-test, P < 0.01). As measured by SEM, significant differences were obtained between cultured G. scabrosus and cultured G. belizeanus (Table 1, Steel-Dwass test, P < 0.01), and between environmental G. scabrosus and cultured G. belizeanus (Table 1, Steel-Dwass test, P < 0.05), whereas significant differences were not obtained between cultured G. scabrosus and environmental G. scabrosus (Steel-Dwass test, P > 0.05).
Discussion
Microscopic identification of the Gambierdiscus species is often problematic as the morphological differences are mostly subtle and the quantitative characters (for example, plate dimension) largely overlap among species (Litaker et al. 2009). Thus, in most cases, cells need to be examined from different angles and the plate arrangement must ideally be observed with SEM and calcofluor staining (Litaker et al. 2009). What makes the reliable microscopic identification of Gambierdiscus more tricky is that multiple (up to four) species coexist on a single macroalgae (Vandersea et al. 2012). This means that unequivocal identification of the Gambierdiscus species from environmental samples solely by LM is nearly impossible. In this study, we examined the morphological characteristics based on cultured cells as well as cells collected from fields (that is, environmental cells), where coexistence of the two species/phylotypes (G. scabrosus and Gambierdiscus sp. type 2) has been documented with a qPCR assay (Nishimura, unpubl.). Distinct size differences between the two coexisting species/phylotypes allowed us to make an unequivocal identification, and a comparative observation based on cultured and environmental cells was possible. As a result, we confirmed that most of the morphological characters of the two specimens (cultured and environmental cells of G. scabrosus) were almost the same, with only a slight difference in cell sizes, namely, depth, width, and length. Therefore, we believe that the effect of culturing on our measurements was negligible in this study.
Litaker et al. (2009) proposed the useful diagnostic characteristics at the rank of species of Gambierdiscus, namely, the 2′′′′ plate (considered as 1p plate in Faust 1995, Chinain et al. 1999, and Litaker et al. 2009) and 2′ plate in the hypotheca and the epitheca respectively. The 2′′′′ plates in the hypotheca of G. australes, G. belizeanus, G. pacificus, and G. scabrosus are narrow, whereas those of G. caribaeus, G. carolinianus, G. carpenteri, G. polynesiensis, and G. toxicus are broad. Two groups, narrow and broad 2′′′′ plate, could also be discriminated by plate morphometry, that is, the ratio of L to W of the 2′′′′ plate is on average 2.15 in the narrow group (1.83: G. belizeanus, 2.00: G. australes, 2.18: G. scabrosus, and 2.57: G. pacificus as measured by SEM (Table 1; table 2 in Litaker et al. 2009), whereas the ratio is 1.48 on average in the broad group (1.26: G. caribaeus, 1.38: G. polynesiensis, 1.51: G. toxicus, 1.60: G. carpenteri, and 1.65: G. carolinianus as measured by SEM (table 2 in Litaker et al. 2009). The 2′ plates in the epitheca of G. toxicus, G. pacificus, G. carolinianus, and G. belizeanus are hatchet shaped, whereas that of G. australes, G. caribaeus, G. carpenteri, and G. scabrosus are rectangular shaped. Two groups, hatchet and rectangular, could also be discriminated by plate morphometry, that is, the ratio of the plate border of the 2′ plate with respect to the 1′′ plate (considered as 2′′ plate in Faust 1995, Chinain et al. 1999, and Litaker et al. 2009) and 3′′ plate (considered as 4′′ plate in Faust 1995, Chinain et al. 1999, and Litaker et al. 2009) is on average 0.54 in the hatchet group (0.36: G. pacificus, 0.63: G. carolinianus, and 0.64: G. belizeanus as measured by LM (table 7 in Litaker et al. 2009), whereas the ratio is 0.85 on average in the rectangular group (0.69: G. australes, 0.85: G. scabrosus, 0.91: G. caribaeus, and 0.93: G. carpenteri as measured by LM (Table 1; table 7 in Litaker et al. 2009).
In the epitheca, Litaker et al. (2009) proposed that the 3′′ plate (considered as 4′′ plate in Faust 1995, Chinain et al. 1999, and Litaker et al. 2009) was also the useful diagnostic characteristic between G. caribaeus and G. carpenteri, namely, the shape of the 3′′ plate of the former is symmetric, whereas that of the later is asymmetric (fig. 10 in Litaker et al. 2009). In the cases of G. scabrosus and G. belizeanus, the two species could also be discriminated by plate morphometry of the 3′′ plate, that is, the ratios of the plate border of the 3′′ plate with respect to the 2′′ and 4′′ plates for G. scabrosus is 0.70 (asymmetric), whereas the ratios for G. belizeanus is 1.01 (symmetric) as measured by LM.
In our previous study (Nishimura et al. 2013), phylogenetic positions of the SSU rDNA and the LSU rDNA D8–D10 of G. scabrosus (Gambierdiscus sp. type 1 as shown in Nishimura et al. 2013) were confirmed by phylogenetic analyses using Bayesian inference (BI) and maximum likelihood (ML). As a consequence, both trees, namely, the BI tree and ML tree, revealed that all the G. scabrosus sequences fell into a distinct clade that was clearly separated from other Gambierdiscus species including G. belizeanus (Nishimura et al. 2013). The G. scabrosus clade also received high nodal support (Nishimura et al. 2013). In addition, genetic distance analyses of both genes among G. scabrosus and other Gambierdiscus species revealed that both genes of G. scabrosus showed species level genetic divergence from other Gambierdiscus species including G. belizeanus (Nishimura et al. 2013). As a whole, both the morphological characters and the phylogenetic characters of G. scabrosus support G. scabrosus as a distinct species.
We thank T. Matsuzaki and Y. Yamamoto of Kochi University for allowing us to access their facilities and technical help for SEM. We thank O. Oku, MicroWorldServices, for his technical help for LM. We are grateful to T. Ikegami, T. Nakamura, N. Oka, K. Tose, and K. Uehara for collecting macroalgal samples. We thank N. Suzuki from Tohoku University and A. Tuji from the National Museum of Nature and Science for their useful comments on making a permanent slide. We are grateful to anonymous reviewers to improve the quality of our manuscript. This study was partly supported by a Grant-in-Aid from the Food Safety Commission, Japan (no. 0904).


