Temporal Dynamics of Tomato Severe Rugose Virus and Bemisia tabaci in Tomato Fields in São Paulo, Brazil
Abstract
Temporal progress of a begomovirus disease in tomato fields and the abundance of its whitefly vector, Bemisia tabaci biotype B, were evaluated during three consecutive tomato plantings in the municipality of Sumaré, state of São Paulo, Brazil, in 2006 and 2007. The incidence of symptomatic plants and the number of adult whiteflies were weekly monitored on experimental plots randomly chosen in tomato commercial fields. Tomato severe rugose virus (ToSRV) was identified as the causal agent of the disease, and its relationships with other Brazilian begomoviruses was confirmed by partial and complete nucleotide sequencing of the viral genome. The disease temporal progress was analysed by fitting different models to disease incidence. The monomolecular model showed the best fit, which is consistent with a predominant role of primary spread in the epidemiology of ToSRV. A higher number of adult whiteflies were observed at the borders of the plots, also suggesting primary spread of ToSRV from external sources of inoculum, which might be represented by weeds and volunteer tomato-infected plants. In Brazil, since 2004, there is a legislative measure that mandates, for some regions of processing tomato plantings, a 2-month crop-free period during the year. Based on our results, we suggest the extension of this measure to all tomato-producing regions, including fresh market tomato. We also suggest that growers emphasize the elimination of old plants from harvested fields that can serve as virus reservoirs several weeks prior to new plantings and weeds nearby the fields to limit the primary spread of ToSRV.
Introduction
Begomoviruses (Geminiviridae family) are characterized by a single-stranded DNA genome consisting of either one or two circular components encapsulated in icosahedral particles. They are transmitted by the whitefly Bemisia tabaci (Homoptera: Aleyrodidae) to dicotyledonous plants in a persistent, circulative manner (Brown et al. 2012; Bragard et al. 2013). Begomoviruses are considered a major virus group of vegetable pathogens in the tropics and subtropics of the Western Hemisphere, where they have caused important losses in many crops such as bean (Phaseolus vulgaris), soyabean (Glycine max), cassava (Manihot esculenta) and tomato (Solanum lycopersicum) (Polston and Anderson 1997).
The first report of begomovirus-infecting tomato crops occurred in São Paulo state in 1960 (Flores et al. 1960) and the virus was named as Tomato golden mosaic virus (TGMV) (Matyis et al. 1975). However, the economic loss was too small at that time, probably due to the endemic occurrence of the disease. Until the early 1990s, the tomato crops were free of epidemics caused by begomoviruses, as the only whitefly present in the country was the A biotype of B. tabaci, which rarely colonizes tomato plants (Ambrozevicius et al. 2002). In 1991, however, the B biotype of B. tabaci was first observed on poinsettia (Euphorbia pulcherrima) and chrysanthemum (Dendranthema grandiflora) plants in Holambra County, São Paulo state (Melo 1992). Since then, population outbreaks of B. tabaci biotype B have been observed in squash (Cucurbita moschata) and tomato fields (Lourenção and Nagai 1994) in São Paulo state, as well as in innumerous tomato-producing regions of the country (França et al. 1996; Lourenção 1997). In addition, many weed species have been reported as natural hosts of begomovirus and B. tabaci biotype B, especially those belonging to the families Malvaceae, Euphorbiaceae, Fabaceae, Capparaceae and Sterculiaceae (Barreto et al. 2013). Consequently, reports of new begomovirus species-infecting tomato plants were increased in Brazil, showing severe yield losses caused by several epidemics in many tomato-producing regions (Faria et al. 1997; Ribeiro et al. 2003; Della Vechia et al. 2007; Fernandes et al. 2008).
In Brazil, Rocha et al. (2013) reported 11 begomovirus species, all of which have been found only in that country, known to infect tomatoes naturally in the field: Tomato golden mosaic virus (TGMV), Tomato rugose mosaic virus (ToRMV), Tomato chlorotic mottle virus (ToCMoV), Tomato yellow spot virus (ToYSV), Tomato severe rugose virus (ToSRV), Tomato common mosaic virus (ToCmMV), Tomato mild mosaic virus (ToMlMV), Tomato yellow vein streak virus (ToYVSV), Tomato interveinal chlorosis virus (ToICV), Tomato mottle leaf curl virus (TMoLCV) and Tomato golden vein virus (TGVV). At least seven additional genetically distinct begomoviruses have been associated with diseases of tomato, but these viruses have not been completely characterized and their role in the aetiology of these diseases remains to be established (Rocha et al. 2013). For the last 5 years, ToSRV has been the prevalent and most important species causing losses in tomato production in Brazil (Fernandes et al. 2008).
Management of begomovirus diseases on tomato crops in Brazil depends mainly on using resistant hybrids cultivars, virus-free seedlings and expensive insecticide spraying for whitefly control. Additionally, there is a legislative measure, applied to some processing tomato-producing regions in Brazil, establishing a 2-month period free of tomato production during the year, to ensure the annual breakage of begomovirus infection cycle.
In last years, higher incidence of ToSRV has been observed in several regions in Brazil. This observation might be associated with the continuous tomato cultivation for long periods in many regions, which might contribute to the maintenance of sources of ToRSV and B. tabaci. In this study, the temporal dynamics of ToSRV and its whitefly vector were monitored during three consecutive tomato plantings in a commercial field in São Paulo state to understand this pathosystem.
Materials and Methods
Experimental design and data collection
Three independent experiments were carried from March to June 2006 (field 1), from August to November 2006 (field 2) and from March to July 2007 (field 3) in the field of fresh market tomato crops of 30 hectares located in Sumaré County (22°49′19′′ south; 47°16′01′′ west; altitude: 583 m), São Paulo state.
Seedlings of tomato cv. Alambra were transplanted to the fields 30 days after germination. Plants were spaced at the interval of 1.5 m × 0.5 m. One week after transplanting, four experimental plots were randomly delimited in each field; plots A×, B× and C× were located at the border of the fields, whereas plots D× were located in the centre of each field (× represents the number of the experimental fields, 1–3). Each plot had 15 lines with 50 plants each, total of 750 plants. Disease incidence was assessed weekly in each plot based on the presence of characteristic symptoms induced by ToSRV.
ToSRV detection and identification
Leaf samples from symptomatic tomato plants were randomly collected during each disease incidence assessment. Total DNA was extracted from each leaf sample using the method described by Dellaporta et al. (1983). PCR amplifications were performed using the universal primers, PAL1v1978 (5′- GCATCTGCAGGCCCACATYGTCTTYCCNGT-3′) and PAR1c496 (5′- AATACTGCAGGGCTTYCTRTACATRGG-3′), which amplify a fragment of 1200 bp, comprising the 5′-region of the rep gene, the entire common region and the 5′-region of the cp gene (Rojas et al. 1993). Specific ToSRV primers, ToSRV1f (5′- AAG GCG ACG TCT TTG GAA GG-3′) and ToSRV2r (5′- CTC AGC GGC CTT GTT ATA TTT-3′), were also used for some samples (Fernandes et al. 2010). PCRs were performed as previously described by Ambrozevicius et al. (2002), and the amplified fragments were visualized by agarose gel electrophoresis (0.9%) stained with Sybr® safe (Invitrogen, Carlsbad, CA, USA) under UV light. Amplicons were directly sequenced at Macrogen, using the primer PAR1c496 (Rojas et al. 1993). Nucleotide sequences were compared with corresponding sequences deposited in the GenBank. To confirm the virus identity, one isolate (Su-14) was randomly chosen for cloning and complete nucleotide sequencing of DNA-A and DNA-B as described by Inoue-Nagata et al. (2004).
Detection of non-begomoviral tomato-infecting viruses
All tomato samples were analysed by plate-trapped antigen (PTA) enzyme-linked immunosorbent assay (ELISA) (Mowat and Dawson 1987) using specific antisera against Tomato spotted wilt virus (TSWV), Tomato chlorotic spot virus (TCSV), Potato leaf roll virus (PLRV) and Pepper yellow mosaic virus (PepYMV). Tissue samples were ground in 0.05 m sodium carbonate buffer (pH 9.6) containing 0.1 m CaCl2. Appropriate negative and positive controls were included in each assay. The resulting absorbance was measured in an ELISA reader Metertech Σ960 (Metertech Inc., Taipei, Taiwan). The reaction was considered positive when the OD405 nm reading exceeded at least three times that of the control (healthy) sample.
Detection of Tomato chlorosis virus (ToCV) was carried out on 15 of 112 leaf samples chosen randomly. Total RNA was extracted for RT-PCR using the HS-11/HS-12 primer pair, which amplifies a fragment of 587 bp from the highly conserved region of the heat-shock protein (HSP-70) homologue gene reported for ToCV. The RT-PCR product was subsequently tested by nested-PCR for detection of ToCV, with specific primers ToC-5/ToC-6 (Dovas et al. 2002). Amplified fragments were visualized by agarose gel electrophoresis as described above.
Temporal analysis


Monitoring whitefly population
The abundance of B. tabaci was determined by capturing adult whiteflies on yellow sticky traps placed inside each plot. Traps, which were replaced weekly, were suspended 50 cm above the soil by wood stakes oriented perpendicular to the plant row. Traps were examined under a stereomicroscope for whitefly identification and quantification. The association between symptomatic plants and number of whiteflies was calculated through Pearson's correlation coefficient (r) (P ≤ 0.05), using the number of whiteflies at tn–15 and the disease incidence at tn, where n corresponds to days after transplanting (DAT), while 15 corresponds to the mean disease incubation period in days.
Results
ToSRV detection and identification
A total of 112 leaf samples were collected from symptomatic plants from the three experimental fields. For all samples, a fragment of 1200 bp was amplified from the extracted DNA using universal primers (Rojas et al. 1993), thereby confirming begomovirus infection. A total of 55 amplicons were directly sequenced, and their nucleotide sequences showed 90–98% identity at the 5′ end of the cp gene with the corresponding nucleotide sequence for ToSRV-[BR:Pi1:To:07] isolate (Accession Number GU358449) (data not shown). This region is the most variable region of the cp gene and has been used in Brazil to evaluate the variability of the entire viral genome (Ambrozevicius et al. 2002; Colariccio et al. 2007). DNA-A and DNA-B of isolate Su-14 contain 2570 nt and 2568 nt, respectively (data not shown). Both DNAs shared 98% nucleotide identity with the corresponding nucleotide sequences of DNA-A and DNA-B of ToSRV-[BR:Pi1:To:07] isolate (Accession Numbers GU358449 and HQ606468), confirming the identity of ToSRV in this study. According to the current guidelines for begomovirus nomenclature (Fauquet et al. 2008), the ToSRV Su-14 isolate was identified as Tomato severe rugose virus, and the acronym was designed as ToSRV-(BR:Su-14:To:07). All leaf samples tested negative for TSWV, TCSV, PLRV and PepYMV in PTA-ELISA. ToCV was not detected in 15 samples analysed by RT-PCR.
Temporal analyses
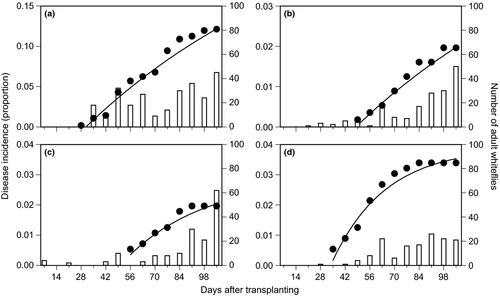
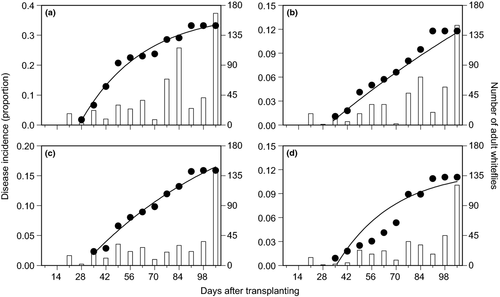
For field 1 (Table 1, Fig. 1), FDI and AUDPC ranged among plots from 1.96 to 12.14% and from 65.62 to 527.45, respectively. Temporal dynamics for field 2 were similar to that of field 1 (Table 1, Fig. 2), although with higher disease incidence, as indicated by the FDI and AUDPC, which ranged among plots from 11.07 to 33.57% and from 441.25 to 1767.49, respectively (Table 1). Disease progress in A1 and A2 plots presented similar epidemiological characteristics, as the presence of waves of infection and times of initial disease (TID) observed at 28 days after transplanting (DAT) (Table 1, Figs 1 and 2). Moreover, for these plots, the highest FDI and AUDPC were reached when compared to others plots (Table 1). For field 3, the first infected plants were detected late in the season, at 56 DAT in plot B3 (Table 1, Fig. 3). Disease incidence was lower than in fields 1 and 2, as indicated by the FDI and AUDPC, which ranged from 0.32 to 0.48% and from 11.20 to 15.12, respectively, among the plots (Table 1).
| Plots | TID | FDI | AUDPC | NWa | r b | Monomolecular modeld | |||
|---|---|---|---|---|---|---|---|---|---|
| b 1 | b 2 | b 3 | R 2 | ||||||
| A1 | 28 | 12.14 | 527.45 | 17.56 | 0.42 | 0.30 (0.15) | 1.25 (0.19) | 0.007 (0.005) | 0.97 |
| B1 | 49 | 1.96 | 65.62 | 10.93 | 0.54 | 0.06 (0.05) | 1.40 (0.49) | 0.007 (0.007) | 0.98 |
| C1 | 35 | 3.39 | 179.37 | 10.06 | 0.45 | 0.029 (0.009) | 3.01 (2.27) | 0.02 (0.01) | 0.95 |
| D1 | 56 | 1.96 | 72.14 | 9.00 | 0.44 | 0.04 (0.003) | 3.04 (0.95) | 0.03 (0.008) | 0.96 |
| A2 | 28 | 33.57 | 1767.49 | 35.56 | 0.30 | 0.38 (0.02) | 2.11 (0.37) | 0.03 (0.005) | 0.98 |
| B2 | 35 | 11.79 | 498.75 | 29.12 | 0.29 | 0.42 (0.39) | 1.16 (0.21) | 0.004 (0.005) | 0.98 |
| C2 | 35 | 15.89 | 723.12 | 23.87 | 0.16 | 0.29 (0.09) | 1.37 (0.25) | 0.011 (0.005) | 0.98 |
| D2 | 35 | 11.07 | 441.25 | 21.18 | 0.44 | 0.12 (0.11) | 2.91 (0.59) | 0.03 (0.004) | 0.93 |
| A3 | 63 | 0.48 | 15.12 | 9.37 | 0.59 | …c | … | … | … |
| B3 | 56 | 0.32 | 13.44 | 10.18 | 0.27 | … | … | … | … |
| C3 | 70 | 0.32 | 11.20 | 10.50 | 0.42 | … | … | … | … |
| D3 | … | … | … | 9.81 | … | … | … | … | … |
- a Mean number of adult whiteflies collected per plot.
- b Pearson's correlation: relationship between the disease incidence and the number of adult whiteflies (NW).
- c Analyses not performed due to low incidence of disease.
- d b1 = estimative of maximum asymptote, b2 = parameter related to initial inoculum and b3 = disease progress rate.


In general, except for the exponential model, all tested models (Gompertz, logistic and monomolecular) fitted well to data, showing high coefficients of determination (R2), which ranged from 0.93 to 0.98 (data not shown). Similarly, in most of the cases, a lack of residual patterns was observed for all three models. Considering these results together, we decided, due to biological considerations (Pfender 1982; Campbell and Madden 1990), to use the monomolecular model to describe the temporal dynamic of ToSRV (Table 1).
Abundance of adult whiteflies
Over time, the number of whiteflies varied for each assessment, plot and field (Figs 1-3). We did not find any significant relationship between the number of adult whiteflies captured in the plots and the disease incidence (Pearson's correlation coefficient r ranged from 0.16 to 0.59, P > 0.05) (Table 1).
Discussion
Over the last 10 years, the incidence of ToSRV has increased in tomato crops in several regions of Brazil (Ribeiro et al. 2003; Zerbini et al. 2005; Fernandes et al. 2008; Gonzáles-Aguilera et al. 2012). In Sumaré, São Paulo state, an important region for the fresh market tomato production, ToSRV has displaced Tomato yellow vein streak virus (ToYVSV), which was the most prevalent begomovirus species a few years ago (Della Vecchia et al. 2007). The present study confirms the prevalence of ToSRV in the region of Sumaré. While the reasons for the displacement of ToYVSV are unknown, they might be related to a higher efficiency of B. tabaci biotype B to transmit ToSRV and the presence of important ToSRV reservoirs in the field (Bezerra-Agasie et al. 2006; Souza-Dias et al. 2008; Barbosa et al. 2009, 2011; Barreto et al. 2013).
In general, we observed an irregular occurrence of the ToSRV among different plots in all three tomato fields. For fields 1 and 2, the beginning of the epidemic (TID) occurred in plots located at the borders of the fields, A1 and A2, respectively. In these plots, the epidemic also reached the highest final incidence (FDI), suggesting external sources of inoculum. The existence of higher number of whiteflies collected in traps associated with shorter TID at the borders of the fields is another evidence of the importance of external sources of inoculum, that is primary spread caused by the immigration of viruliferous whiteflies. The high relevance of primary spread in the epidemiology of begomovirus is known in other tomato pathosystems, such as Tomato mottle virus (TMoV) (Polston et al. 1996), Tomato leaf curl virus (TLCV) (Holt et al. 1999) and Tomato yellow leaf curl virus (TYLCV) (Ioannou 1987; Cohen et al. 1988; Ssekyewa 2006; Sawalha 2013). The same feature was observed for the related pathosystem cassava/African cassava mosaic virus (ACMV), also caused by a begomovirus transmitted by B. tabaci (Fargette et al. 1985, 1990; Lecoustre et al. 1989; Fauquet and Fargette 1990).
Plant pathology textbooks in general consider that the epidemiological role of primary spread is to introduce the pathogen in areas where it is absent; the subsequent development of the epidemic is governed by secondary spread (Gäumann 1950; Agrios 2005). The same view is predominant in modelling plant disease epidemics, in which most epidemics start by introducing few lesions or infected individuals (primary inoculum) instantaneously at time t = 0 (Madden et al. 2007). The reasoning is that, with sufficient time, the secondary infections overshadow the initial events. In this view, primary spread is relegated to a subservient role of the carry-over of inoculum from the previous crop to initiate the first infections and is assumed to be of negligible importance relative to the dominating influence of secondary, plant to plant spread (Gilligan 1994).
As mentioned by Madden et al. (2007), however, it may not be realistic in some cases to assume an instantaneous start of the epidemic. It is possible, for instance, that the primary infections occur over an extended period of time, possibly concurrently with the new (secondary) infections occurring due to spread from individual to individual. A theoretical approach for epidemics in which primary spread occurs over an extended period of time is proposed by Gilligan and Kleczkowski (1997) and Gilligan (2002). Disease progress curves in these cases are less clear-cut compared to the results obtained for strictly polycyclic (logistic type) or monocyclic (monomolecular type) epidemics, but overall the curves are more similar to the monomolecular type (Gilligan 2002). Examples of virus epidemics in which primary spread occurs over an extended period of time include, besides tomato/TYLCV and cassava/ACMV, the thrips-transmitted tospovirus Tomato spotted wilt virus (TSWV) in peanut (Camann et al. 1995), lettuce and pepper (Coutts et al. 2004) and tomato (Puche et al. 1995). In these pathosystems, the temporal dynamics are governed by the primary spread and the secondary spread, if any, has little epidemiological importance.
Results of this research suggest that the same view can fit for ToSRV in tomato. Disease progress curves were better fit to the monomolecular model, a result compatible with a predominant primary spread of the pathogen. In plots with high disease incidence, three waves are discernible, probably caused by immigration of swarms of viruliferous B. tabaci, as already described for tomato/TSWV (Puche et al. 1995). Additionally, in our case, frequent insecticide applications prevented most of secondary spread. However, it is important to mention that similar results were obtained even in experiments with no application of insecticide, in tomato/Tomato leaf curl virus (TLCV) (Roff et al. 2005) and cassava/ACMV (Lecoustre et al. 1989).
The temporal dynamics of several other pathosystems involving tomato begomoviruses and B. tabaci were also better described by the monomolecular model, as shown by TMoV (Polston et al. 1996), Tomato yellow mottle virus (ToYMoV) (Hilje and Stansly 2008), TYLCV (Ioannou and Iordanou 1985; Suwwan et al. 1988; Schuster et al. 2011), TLCV (Roff et al. 2005) and ToYVSV (Della Vecchia et al. 2007). The same model can fit for cassava/ACMV (Fargette and Vié 1994; Fondong et al. 2002) and sweet potato/Sweet potato chlorotic stunt virus (SPCSV) (Byamukama et al. 2004).
Predominance of primary spread appears to be a characteristic of begomovirus epidemics in general, despite the ready transmission from tomato to tomato (Caciagli et al. 1995) and from cassava to cassava (Fauquet and Fargette 1990). This aspect of the epidemiology of begomoviruses deserves more investigation, especially the relationship between plant (or leaf) susceptibility and plant (or leaf) age (Fauquet and Fargette 1990), and the role of different morphs (migratory and trivial) of B. tabaci (Byrne et al. 1996).
The presence and absence of correlation between the disease incidence of tomato begomoviruses and the number of captured whiteflies in vertical yellow sticky traps have been reported in the literature. In general, positive results were obtained in large-scale assessments (Ioannou and Iordanou 1985; Cohen et al. 1988), and negative results were obtained in experimental fields where assessments were performed in small plots (Polston et al. 1996), as was the case for this study. Additionally, in our experiments, frequent insecticide sprays might have blurred the correlation, as well as the fact that we did not differentiate viruliferous from non-viruliferous whiteflies.
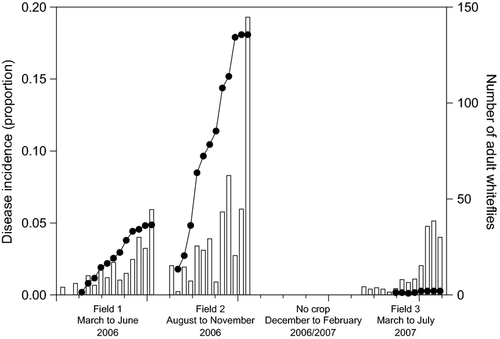
Joint analysis of the ToRSV epidemic over the three successive fields (Fig. 4) suggests that diseased tomato plants in field 1 probably served as important source of inoculum for field 2, as there were a great number of volunteer tomato plants in field 1 by the time field 2 was sown (mid-August 2006). Field 3, on the other side, was sown approximately 90 days (March 2007) after harvesting of field 2. The temporal discontinuity of tomato cultivation between seasons probably contributed to the reduction in whiteflies' population and the disease incidence in field 3 (Fig. 4). The primary sources of inoculum for field 3 probably were weeds that can host ToSRV and B. tabaci. As ToSRV is able to infect several weed species (Bezerra-Agasie et al. 2006; Souza-Dias et al. 2008; Barbosa et al. 2009, 2011), they may serve as primary source of inoculum and vector. In the course of the experiments, leaf samples from Chenopodium album, C. ambrosioides, Nicandra physaloides and Sida urens naturally occurring near to the tomato fields were analysed by PCR and revealed as positive for ToSRV infection (data not shown). Moreover, between 2005 and 2009, Barreto et al. (2013) analysed leaf samples of 27 weed species collected within and near to tomato fields in the District Federal and Goiás state, Brazil, and found that Crotalaria spp., Euphorbia heterophylla, N. physaloides and Sida spp. were infected with ToSRV. Transmission of ToSRV from these weeds to tomato was accomplished, further demonstrating their potential importance as sources of ToSRV in the field. Similarly, in Dominican Republic, Salati et al. (2002) reported the persistence of TYLCV in the field in the absence of tomato and low whitefly population. According to them, this is due to the perennial growth, wide distribution and high population of weeds that might harbour the virus and the vector, particularly before the tomato growth season. These results supported the legislative mandatory 3-month whitefly host-free period (including tomato, common bean, cucurbits, eggplant and pepper) in Dominican Republic (Salati et al. 2002) and 2-month processing tomato-free period in some regions of Brazil (Barreto et al. 2013).

We suggest that a tomato-free period, which is mandatory for processing tomato crops in some regions, should be extended for fresh market tomato crops in all Brazilian regions. We also suggest that growers emphasize the elimination of harvested fields that can serve as virus reservoirs several weeks prior to planting, as well as to reduce weeds nearby the fields to decrease the primary spread of ToSRV. However, achievement of the goal of a better management of ToSRV will require close integration of farmers, agronomists, insecticide industry and government.


