Functional magnetic resonance imaging, deep learning, and Alzheimer's disease: A systematic review
Abstract
Alzheimer's disease (AD) is currently diagnosed using a mixture of psychological tests and clinical observations. However, these diagnoses are not perfect, and additional diagnostic tools (e.g., MRI) can help improve our understanding of AD as well as our ability to detect the disease. Accordingly, a large amount of research has been invested into innovative diagnostic methods for AD. Functional MRI (fMRI) is a form of neuroimaging technology that has been used to diagnose AD; however, fMRI is incredibly noisy, complex, and thus lacks clinical use. Nonetheless, recent innovations in deep learning technology could enable the simplified and streamlined analysis of fMRI. Deep learning is a form of artificial intelligence that uses computer algorithms based on human neural networks to solve complex problems. For example, in fMRI research, deep learning models can automatically denoise images and classify AD by detecting patterns in participants’ brain scans. In this systematic review, we investigate how fMRI (specifically resting-state fMRI) and deep learning methods are used to diagnose AD. In turn, we outline the common deep neural network, preprocessing, and classification methods used in the literature. We also discuss the accuracy, strengths, limitations, and future direction of fMRI deep learning methods. In turn, we aim to summarize the current field for new researchers, suggest specific areas for future research, and highlight the potential of fMRI to aid AD diagnoses.
INTRODUCTION
Alzheimer's disease (AD) is a severe neurological condition often defined by physical deterioration and cognitive decline. There is currently no cure for AD, with the disease usually resulting in death.1 In Australia, AD and other forms of dementia are the second leading cause of death in aging populations.2 However, unlike other prominent causes of death, AD decline occurs over many years.3 In turn, AD has a large individual, social, and economic cost (e.g., health care) that affects everyone.4, 5 There are treatments available that can treat some of the symptoms of AD and temporarily slow the progression of the disease; however, there is currently no treatment that can stop the progression of AD.6 One of the biggest reasons for the dearth of effective treatment is the state of current AD diagnoses. In Australia, AD is commonly diagnosed using psychological tests and clinical observations (eg, interviews and pen-and-paper scales).7 While these diagnostic measures are mostly sufficient for mid-to-late-stage diagnosis, there is a greater need to adopt methods that can complement current strategies and target early-stage AD (eg, MRI, PET).8-10 For example, it is estimated that if AD can be diagnosed at an early stage, individuals can have an improved quality of life through the consistent treatment and management of the disease.11 Accordingly, a large amount of research has been invested into innovative methods to identify early-stage AD and complement current diagnostic methods.
In the literature, there are multiple approaches to diagnosing AD using neuroimaging, traditional biomarkers, and neuropsychological methods.12 Each of these fields has significant strengths and limitations when diagnosing AD. Namely, traditional biomarkers can directly measure AD symptoms (eg, beta-amyloid and tau) but are often invasive and vary in accuracy.13 Further, neuropsychological tests are easily administrable and accessible (clinically friendly) but can be biased to mid-to-late-stage diagnosis. Lastly, neuroimaging methods are noninvasive and highly accurate but are analytically complex. In research, neuroimaging methods are often preferred due to their ability to diagnose AD with high accuracy and aid early diagnoses. For example, MRI is commonly used with statistical models to predict early-stage AD.14 However, as previously noted, neuroimaging methods require complex analyses that require specialist resources. Consequently, there is a critical need to improve neuroimaging methods to aid in AD diagnosis. In this systematic review, we specifically investigate how functional magnetic resonance imaging (fMRI) can be improved for AD diagnoses.
fMRI is a neuroimaging technique that uses measures of cerebral blood flow to image brain activity.15 In AD research, fMRI is predominantly used to image the activation of brain areas and the interactions between brain regions over time. The latter is known as functional connectivity. Previous research has found that resting-state fMRI measures (fMRI performed without a task or stimuli) of functional connectivity can accurately diagnose AD and predict the early stages of the disease.16, 17 For example, studies have found that abnormal functional connectivity of the medial temporal lobe and hippocampus indicates AD.18 Research has also suggested that resting-state fMRI (hereby referred to as just fMRI) can distinguish different forms of dementia and detect early-stage AD. For example, fMRI can classify AD from other forms of dementia by studying different neurological networks.19 In turn, studies have also shown that AD is associated with the default mode network (DMN).20 Unlike more traditional structural imaging measures (eg, MRI brain volume), it is suggested that functional connectivity measures can detect early-stage AD before significant neurodegeneration.21, 22 Accordingly, evidence suggests that fMRI measures can diagnose AD with high accuracy and could assist with clinical diagnoses.
In the literature, traditional fMRI methods commonly follow the three stages of data collection, preprocessing, and analysis. Specifically, studies often collect fMRI data or obtain data from big databases such as OpenfMRI and the Alzheimer's Disease Neuroimaging Initiative (ADNI). fMRI data are then cleaned and preprocessed using statistical techniques such as Fourier analysis and regression. These preprocessing steps are predominantly performed by software packages such as SPM12, FSL, and fMRIPrep.23-25 The specific preprocessing techniques used often depend on the software package and the study's aims. Nonetheless, most, if not all, studies will use preprocessing techniques—such as skull stripping, slice timing correction, motion realignment, and intensity normalization—to clean and transform fMRI data.26 These transformed data are often quantified as time series (a measure of brain activity over time), region of interest (ROI; eg, the analysis of specific voxels), or independent component analysis (ICA; a mixture of time series and ROI spatial maps) measures.27-29 Using these preprocessed data, the final analysis uses common statistical techniques to compare and diagnose groups (eg, ANOVA, t-test, regression). For example, a study by Koch et al.30 classified AD and cognitively normal controls (CN) with an accuracy of 97.2%. For their pipeline, Koch et al. manually collected their data, preprocessed it into time course correlation and ICA measures (using BrainVoyager software), and then analyzed their groups using t-tests. Numerous other studies have also diagnosed AD using fMRI with similar results.31-33
However, fMRI has severe limitations and finds little use compared to MRI and PET neuroimaging methods. For example, fMRI data are incredibly intensive to collect, clean, preprocess, and analyze compared to MRI and PET. Furthermore, fMRI is incredibly messy (eg, low signal-to-noise ratio), requires highly specialized knowledge, is uncommon in big databases, and is often less accurate than other techniques (eg, MRI). Accordingly, fMRI methods are unpopular because they require significant resources, computational power, and technical expertise that are often unjustifiable compared to other techniques (eg, cognitive tests). Thus, it is no surprise that fMRI has historically lacked research and is not used for clinical AD diagnoses. Nonetheless, fMRI does provide a unique perspective on AD, such as measures of brain activity and neuronal networks. As previously discussed, these fMRI measures can detect early-stage AD and could play an important part in combatting the disease. Accordingly, through the drastic improvement of fMRI methods, the unique information from fMRI could be paired with current techniques to provide a more holistic picture of AD and diagnose the disease at an earlier stage.
Recently, it has been suggested that some of the diagnostic limitations of fMRI could be overcome using deep learning techniques. Deep learning models use computer algorithms based on human learning to solve complex problems.34 In the case of fMRI, some studies have shown that typical problems—such as the high computational cost associated with cleaning and analyzing fMRI data—can be overcome using deep learning models.35, 36 For example, Parmar et al.37 created a deep neural network (DNN) model that can semi-autonomously process complex fMRI data (eg, 4-dimensional [4D] data) for AD diagnoses. Unlike prior manual techniques (eg, statistical analyses and machine learning algorithms), deep learning methods are uniquely equipped to process fMRI because they specialize in summarizing (eg, dimensional reduction) and classifying computationally intensive data.38 Moreover, a fully constructed deep learning model is end-to-end and does not require significant oversight or interpretation to diagnose AD. Thus, deep learning algorithms can be trained to process fMRI data and classify AD automatically. Accordingly, deep learning methods could help fMRI complement current diagnostic methods and improve early-stage AD detection.
fMRI is rarely used in AD research, both clinically and experimentally. Working with fMRI is also incredibly complicated and unfriendly. Methods, such as deep learning, can help to improve the viability of fMRI for AD classification. However, these methods are still complicated and lack operationalization. Over the last few years, there has been an increasing number of studies that use deep learning and fMRI methods to classify AD. However, these studies greatly differ in scope, methodology, and accuracy. Accordingly, this article systematically reviews fMRI and deep learning methods for AD classification. There have been some other reviews that have discussed the use of fMRI and deep learning for AD diagnoses;39-41 however, these reviews are often general and, thus, tend to focus on multiple disorders, modalities, and analytical techniques (eg, autism spectrum disorder, structural MRI, machine learning). Accordingly, in this review, we specifically systematically review the resting-state fMRI and deep learning methods that studies used to classify AD. In turn, we outline the field and aim to give new researchers a guide for common methods, techniques, designs, software, and examples of their applications. We hope that through this foundation, researchers will be able to apply, adapt, and innovate fMRI and deep learning methods to help combat AD. We also specifically focus on resting-state fMRI as this method is the most common in AD research and friendly to individuals with neurological disorders (when compared to task-based fMRI).
The remainder of this systematic review and guide is split into six sections that discuss the methods used in this study, the results of our systematic review, fMRI preprocessing methods, classification designs and methods, common DNN, and a concluding discussion. In turn, we explore the following questions: (1) How do studies quantify and preprocess fMRI data for deep learning models; (2) What are the standard approaches to study design and disease classification; and (3) What are the common DNN models used to analyze fMRI for AD diagnoses? We also discuss the strengths, limitations, and future directions of fMRI deep learning methods. Consequently, we aim to give new researchers foundational knowledge and suggest avenues for further research.
METHODS
In this systematic review, we investigate how fMRI and deep learning methods are used to diagnose AD. For our selection criteria, we defined relevant papers as those that used resting-state fMRI data and deep learning methods to classify AD and its prodromal stages (subjective memory complaints [SMC] or mild cognitive impairment [MCI]). We defined deep learning as an artificial intelligence method that uses neuronal networks and combined feature selection and classification techniques. We excluded review articles, non-peer-reviewed works, animal studies, and non-English papers. All articles were sourced from Scopus, PubMed (MEDLINE), and Science Direct in May 2021. We used the following keywords to find relevant papers: (FMRI OR “functional magnetic resonance imaging”) AND Alzheimer's disease AND Deep learning. Initially, we obtained 2362 articles from our searches. However, we were able to reduce our search by filtering out duplicates, reviews, and non-peer-reviewed articles. In turn, we extracted 831 articles for screening. The details of our search can be seen in the Preferred Reporting Items for Systematic Reviews and Meta-Analyses flow diagram in Figure 1. This systematic review was also registered with Prospero, the International prospective register of systematic reviews (ID: CRD42021279283).

The study selection process for our systematic review using the PRISMA flowchart.68
n = participant count. Use of this flowchart is recommended by Preferred Reporting Items for Systematic Reviews and Meta-Analyses (PRISMA) to meet their guidelines for conducting systematic reviews.
All our articles were screened using ASReview.42 ASReview is an artificial intelligence method that systematically selects articles for review using a machine learning algorithm and researcher supervision. For our study, we manually screened a portion of the articles (according to our predefined selection criterion mentioned above) to train ASReview, which then screened the remaining articles. ASReview then ranked and outputted the screened articles in order of applicability to the trained selection criterion. We chose to use ASReview for this systematic review because it can help us avoid bias and automate the review process. However, ASReview is not a bias-free tool and can only help when the selection criteria and a stopping rule are predefined. Before starting our screening with ASReview, we decided that screening would end when 5% of the papers in a row were irrelevant to the review (ie, did not fit the selection criteria above). Accordingly, each abstract was manually read and assessed in comparison to the selection criteria during the supervision stage. In turn, we screened 242 (29%) papers using ASReview before reaching our stopping rule. Out of the 831 papers screened, ASReview found 22 studies that met the selection criteria. These studies were then fully reviewed, and the relevant data (eg, authors, participant count, accuracy, classification methods) were extracted for analysis. It is important to note that studies compute accuracy by comparing model classification results to participants’ diagnosis labels. These labels are defined by clinical diagnoses (eg, ADNI diagnoses participants using psychological tests and clinical assessments). For more information on ASReview, see van de Schoot et al.42
RESULTS
Details such as the classification method, accuracy, DNN used, and participant count for the 22 selected papers can be seen in Table 1. Overall, most of the studies reviewed had a high accuracy ranging between approximately 70% and 98% depending on the methods used. Most, if not all, of the fMRI deep learning studies reviewed followed the same general steps when classifying AD. Specifically, each study acquired their data from a database, preprocessed their data using a software package, computed functional connectivity, and then extracted features and classified them using a deep learning model. Some processes, such as data collection and preprocessing, are similar throughout all studies. For example, most studies (82%) in this review obtain data from the ADNI database. Studies then processed raw fMRI data using computational packages such as FSL. These preprocessing methods are discussed further in the next section.
| Study | Classification task | Accuracy | Participants (n) | Data source | Measures | Preprocessing method | DNN |
|---|---|---|---|---|---|---|---|
| Abrol et al.43 | MCI vs. AD | 78% | 134 | ADNI | sMRI and fMRI | SPM12 | 2D-CNN |
| Duc et al.53 | CN vs. AD | 85.27% | 331 | National Dementia Research Centre, Chosun University | fMRI | FSL toolbox | 3D-CNN |
| Gupta et al.48 | CN vs. AD | 81% | 88 | ADNI | fMRI | fMRIPrep | FNN |
| Jiang et al.55 | MCI vs. AD | 78.5% | 133 | ADNI | fMRI | SPM12 | GCN |
| Jie et al.49 | CN vs. EMCI | 84.6% | 174 | ADNI | fMRI | FSL toolbox | CNN |
| CN vs. AD | 88% | ||||||
| CN, EMCI, LMCI, and AD | 57% | ||||||
| Ju et al.59 | CN vs. MCI | 86% | 170 | ADNI | fMRI, age, gender, APOE4 | DPABI toolbox | Autoencoder |
| Kam et al.16 | CN vs. EMCI | 74.23% | 97 | ADNI | fMRI | DPARSF toolbox | 3D-CNN |
| Kam et al.54 | CN vs. EMCI | 76.07% | 97 | ADNI | fMRI | DPARSF toolbox | 3D-CNN |
| Lee et al.46 | CN vs. EMCI | 74.42% | 101 | ADNI | fMRI | DPARSF toolbox | CNN and GCN |
| Li et al.47 | CN vs. MCI | 88.12% | 389 | ADNI | fMRI | DPARSF toolbox and REST toolkit | 3D-CNN + RNN |
| CN vs. AD | 97.37% | ||||||
| MCI vs. AD | 92.11% | ||||||
| CN, MCI, and AD | 89.47% | ||||||
| Lu et al.64 | CN vs. AD | 71.9% | 60 | ADNI | fMRI | DPABI toolbox | Autoencoder |
| Parmar et al.37 | CN, EMCI, LMCI, and AD | 93% | 120 | ADNI | fMRI | SPM12 | 3D-CNN |
| Qiao et al.51 | CN vs. AD | 95.59% | 68 | Huashan Hospital of Fudan University | fMRI | SPM12 | 2D-DAGNN |
| Qureshi et al.57 | Mild AD vs. Severe AD | 92.3% | 133 | National Dementia Research Centre, Chosun University | fMRI and CDR | FSL toolbox | 3D-CNN |
| Ramzan et al.67 | CN, SMC, EMCI, LMCI, MCI, and AD | 97.92%a | 138 | ADNI | fMRI | FSL toolbox | 2D-CNN |
| Sarraf et al.58 | CN vs. MCI | 97.59% | 275 | ADNI | fMRI | FSL toolbox | CNN |
| CN vs. AD | 97.5% | ||||||
| MCI vs. AD | 98.3% | ||||||
| CN, MCI, and AD | 97.43% | ||||||
| Song et al.62 | CN vs. SMC | 84.09% | 170 | ADNI | fMRI and DTI | GRETNA toolbox | GCN |
| CN vs. EMCI | 85.22% | ||||||
| CN vs. LMCI | 89.02% | ||||||
| SMC vs. EMCI | 88.63% | ||||||
| SMC vs. LMCI | 87.80% | ||||||
| EMCI vs. LMCI | 86.58% | ||||||
| Suk et al.63 | CN vs. MCI | 72.58% | 99 (62/37) | ADNI data | fMRI | SPM8 | Autoencoder |
| 81.08% | original data | ||||||
| Wang et al.44 | CN, MCI, and AD | 92.06% | 105 | Beijing Xuanwu Hospital | DTI and fMRI | DPARSF toolbox | CNN |
| Wang et al.65 | CN vs. AD | 90.28% | 174 | ADNI | fMRI | FSL toolbox | CNN + RNN |
| EMCI vs. LMCI | 79.36% | ||||||
| CN, MCI, and AD | 71.76% | ||||||
| CN, EMCI, LMCI, and AD | 60.67% | ||||||
| Wang et al.45 | CN vs. MCI | 100% | 120 | ADNI | sMRI and fMRI | DPABI toolbox | CNN |
| CN vs. AD | 96% | ||||||
| EMCI vs. LMCI | 100% | ||||||
| MCI vs. AD | 100% | ||||||
| Zhang et al.61 | CN vs. MCI | 92.7% | 214 | ADNI | sMRI, DTI, and fMRI | FSL toolbox | GCN |
- Abbreviations: AD, Alzheimer's disease; ADNI, Alzheimer's Disease Neuroimaging Initiative; CDR, clinical dementia rating scale; CN, cognitively normal; CNN, convolutional neural network; DAGNN, directed acyclic graph neural network; DTI, diffusion tensor imaging; EMCI, early MCI; fMRI, functional magnetic resonance imaging; FNN, feed forward neural network; GCN, graphical convolutional neural network; LMCI, late MCI; MCI, mild cognitive impairment; n, participant count; RNN, recurrent neural network; SMC, subjective memory complaint; sMRI, structural magnetic resonance imaging.
- a This accuracy is an average accuracy. Accuracy is computed by comparing model classification to participant diagnosis labels (see the METHODS section).
There were also similarities in the overall design of most studies. For example, most studies (68%) only performed binary classification on CN, MCI, or AD groups with fMRI (functional connectivity measures) as the sole measure. Studies also predominantly used SoftMax algorithms to classify groups (see the classification designs section below). Some studies used other designs such as multivariate classification (multiple variables), multiclass classification (multiple groups), and other classification algorithms. For example, Abrol et al.43 combined fMRI and structural MRI (sMRI) in a multivariate model; Wang et al.44 classified CN, MCI, and AD in a single model; and Wang et al.45 used a support vector machine (SVM) as a classification layer. However, it should be noted that these alternative methods were a minority compared to the binary, univariate, and SoftMax approaches discussed above. Some studies (41%) investigated the AD continuum's early stages, such as SMC and early MCI (EMCI). However, out of all group comparisons, most studies (77%) predominantly focused on the later stages of the disease, such as MCI, late MCI (LMCI), and AD. The “Classification designs and methods” section below further discusses these design choices.
Conversely, studies drastically varied in their choice of functional connectivity and DNN methods. In the following sections, we outline the typical approaches to preprocessing, study design and classification, and types of DNN methods. Specifically, in the next section, we detail how fMRI signals are commonly preprocessed for deep learning analysis and outline approaches for computing functional connectivity (the main method of quantifying fMRI). Next, we discuss aspects of model designs and classification techniques such as classification layers, multivariate models, and multiclass classification. Then, we outline popular deep learning methods such as convolutional neural networks (CNN), graphical neural networks (GNN), autoencoders, and recurrent neural networks (RNN). We also provide examples of how DNN are used to study AD using fMRI data. Lastly, we summarize and discuss our findings with a specific focus on the limitations of the field as well as areas of future research.
fMRI preprocessing
Preprocessing involves the cleaning and transforming of fMRI data for deep learning classification. As previously mentioned, there is great overlap between the preprocessing methods used in fMRI research. For example, processes such as skull stripping and slice timing correction are used throughout most, if not all, fMRI studies. However, there are other techniques that are more specialized or controversial, such as global signal correction and band-pass filtering. See Strother et al.26 for more information on common statistical tests and techniques used in fMRI preprocessing. In fMRI and deep learning research, preprocessing is almost exclusively performed using software or programming libraries such as SPM12. In this review, we observed that most studies used preprocessing libraries such as FSL (32%) or the DPARSF toolbox (23%). The specific toolbox used will often depend on the design of one's study. For example, a researcher might use FSL for an ICA study because it contains a common preprocessing pipeline (FEAT and BET) and MELODIC (a package for performing ICA). Otherwise, preprocessing packages are mostly interchangeable and depend on researcher preference and expertise. For example, packages like FSL require complex visual inspection and manual setup. Accordingly, new researchers may use automated tools such as fMRIPrep, which require less expertise. Most packages also allow for scripting and command line preprocessing if a graphical user interface is not preferred. Further, fMRI toolboxes are often open source and have dedicated websites and communities. Thus, we suggest that researchers investigate the toolboxes discussed above and decide which bests suits their skills and study.
However, preprocessing does have some limitations. Namely, preprocessing can take considerable time and computational resources to perform. For example, fMRIPrep can take approximately 25 minutes to 1 hour per participant when using a high-end personal computer (eg, Intel i9-10900F Central Processing Unit [CPU], 32Gb RAM, Nvidia GTX 1080 Graphic Processing Unit [GPU]). Moreover, when preprocessing fMRI data, sMRI data must also be preprocessed. Accordingly, one's participant count, hardware, and time may significantly extend the preprocessing stage. Many institutions in Australia have access to supercomputers or research clouds (eg, the ARDC's Nectar Research Cloud), which can drastically improve the speed of preprocessing. Nonetheless, we understand that not all labs have access to cutting-edge technology. In turn, we suggest that researchers pilot their preprocessing before conducting their full run, script their preprocessing, limit their participants to a representative sample size when computational resources are limited, seek help through online preprocessing communities or forums, and investigate the speed of different packages (eg, FLS is faster than FreeSurfer for surface processing when using fMRIPrep).
Functional connectivity
During preprocessing, fMRI data are commonly quantified as a preprocessed blood-oxygen-level-dependent (BOLD) signal or as a measure of functional connectivity. The preprocessed BOLD signal is the cleaned output from an fMRI scan, while functional connectivity is a measure of brain activity computed from the BOLD signal. The preprocessed BOLD signal is used in some high-dimensional models46, 47; however, functional connectivity measures are the most prominent fMRI measure. There are different methods of quantifying functional connectivity for analysis.16, 34, 35, 48, 49 The main two measures used in the reviewed literature are Pearson's correlation and ICA. Historically, fMRI studies use a correlation analysis (eg, correlated activity between brain regions) as well as a predefined brain atlas to calculate and map functional connectivity. These atlases are widely used across the literature to ensure that different brains can be accurately compared. In this review, most correlative studies used a form of Pearson's correlation analysis and the Automated anatomical labelling atlas (AAL) to compute functional connectivity.50 However, these correlational methods do have some limitations. Namely, they can only model simple relationships between brain regions and cannot intricately depict the functional connectome.51 These methods are also temporally limited and often only sample portions of the full fMRI time series (methods only calculate correlations at one or several time points). Correlational analyses also have problems capturing the higher order features of functional connectivity (correlations are simple summaries of functional connectivity), and brain atlases can lose individual characteristics important to classification.52 Nonetheless, Pearson's correlations and brain atlases have resulted in highly accurate fMRI deep learning models.
Independent component analysis
In this review, we found that most studies used an ICA to calculate functional connectivity. An ICA is a statistical technique that specializes in separating and categorizing data. In fMRI research, an ICA can be used to define functional connectivity networks without the need for a preexisting brain atlas.53, 54 ICAs can also provide highly detailed information and partition the brain into multiple functional networks. Accordingly, an ICA is usually preferred over more traditional Pearson's correlation and brain atlas techniques. Some preliminary research has suggested that an ICA can obtain higher quality information because of its ability to split functional connectivity into multiple regional networks. For example, Kam et al.16 sought to diagnose EMCI using fMRI, deep learning (a CNN), and ICA techniques. They studied multiple functional networks, unlike most studies that only investigate one network (eg, DMN). Using data from 98 participants (49 EMCI and 49 CN), Kam et al. constructed 3-dimensional (3D) spatial maps of participants’ functional networks (eg, frontal-parietal network) using an ICA. These functional networks were then used to train and test the CNN model for disease classification. Kam et al. found that their model could classify EMCI from CN with an accuracy of 74.23%. In comparison, other deep or machine learning models could only classify EMCI from CN with an average accuracy of 65%. They also compared their multinetwork model to a singular functional network model. They found that the latter could only classify AD with an accuracy of 67%-71% (the DMN and frontal-parietal network were the best individual models). Accordingly, Kam et al. suggested that using multiple functional connectivity networks can strengthen early-stage AD classification.
Emerging techniques
Emerging research has suggested that deep learning methods could be used to compute functional connectivity measures. For example, Jiang et al.55 constructed a graphical convolutional neural network (GCN) that can assess individual and population-based functional connectivity changes to classify AD. They created their classification model using two GCNs. The first GCN automatically graphs an individual's functional connectivity network using fMRI data. The second GCN then updates the functional connectivity network by adjusting the nodes in accordance with their surrounding neighbors (other participants’ networks) and their connections. Accordingly, an individual's functional connectivity network is changed in reference to its relationships to other networks in the overall sample. Jiang et al. dub this two-part model a hierarchical GCN model (hi-GCN). Next, Jiang et al. trained and tested their model using data from 133 subjects (99 MCI and 34 AD) from ADNI. They found that their hi-GCN model could classify MCI from AD with an accuracy of 78.5% and outperform similar models (eg, standard CNN and GCN models that use ICA). In turn, they suggested that deep learning methods could be used to calculate functional connectivity and could be better than current methods; however, more research on deep learning-based preprocessing methods is required.
fMRI and deep learning markers of AD
Deep learning and traditional fMRI methods share similar preprocessing steps and techniques. However, deep learning fMRI differs in the types of data and the features extracted. The primary difference between traditional and deep learning data is their dimensionality and complexity. For example, as discussed above, traditional methods may compute functional connectivity with an ICA. ICA approaches are typically outputted as time courses and spatial maps of brain activity. In traditional research, these ICA outputs are commonly converted to Z scores and then used for analysis.56 Alternatively, deep learning methods allow for higher dimensional analysis of similar techniques. For example, the time course and spatial maps outputted by the ICA can be directly input into a 3D deep learning model.57 Furthermore, deep learning models can combine both outputs to make a 4D model (spatial and temporal data).54 Beyond the expansion of traditional techniques, such as ICA, there are other methods unique to deep learning. For example, some studies use graph theory to create functional connectome models of the brain for analysis.55 This topic is discussed further in the section on graphical neural networks below and the emerging techniques section above. Nevertheless, deep learning creates new opportunities for discovering, transforming, and analyzing fMRI biomarkers of AD. For example, in the reviewed literature, studies often focus on AD biomarkers such as hippocampal activation and the DMN. We hope that through such measures, fMRI and deep learning can provide complex and unique information to help diagnose AD.
Classification designs and methods
Before discussing the specific deep learning models used to classify AD, it is important to break down classification model's common designs and layers. For example, preprocessing and deep learning methodologies are not the only factors influencing classification accuracy. Namely, the design, aims, and scope of a study also influences the classification accuracy of a DNN model. In turn, characteristics like the type of classification (binary vs. multiclass), the number of variables used (univariate or multivariate), and the classification algorithm (commonly known as the classification layer of a DNN) should be considered. In this section, we discuss common methodological approaches to classification, such as multiclass classification, multivariate classification, and classification layers. In turn, we aim to highlight that classification accuracy is not an all-encompassing measure of a model's ability. Consequentially, we stress that it is also important to consider study design, model purpose, and disease representation (how well does a study imitate real-world diagnostic scenarios) when evaluating fMRI deep learning models.
Binary and multiclass classification
A multiclass classification model is a deep learning algorithm that can diagnose various conditions at the same time (eg, CN, MCI, AD). In AD research, multiclass classification models are often less accurate than binary classification methods (eg, AD vs. CN) because AD is a continuum of overlapping disorders. Moreover, binary classification is an easier task for deep learning algorithms and thus tends to have higher accuracy. However, we suggest that multiclass classification should be the norm in AD research as binary classification does not accurately model AD in the real world. If researchers want fMRI and deep learning methods to be applied to clinical practice, it is imperative that models can actively assess the plethora of overlapping and related disorders that occur with AD. For example, using fMRI, Sarraf et al.58 constructed a CNN that classified AD, MCI, and CN. They acquired data from ADNI, which contained 52 AD, 131 MCI, and 92 CN participants (N = 275). The fMRI data were preprocessed using conventional software and were dimensionally reduced to 2-dimensional (2D) images using PNG lossless data conversion. They found that their CNN had a multiclass classification accuracy of 97.43% (AD, MCI, and CN) as well as a binary classification accuracy of 97.5% (AD vs.CN), 98.3% (AD vs. MCI), and 97.59% (CN vs. MCI). Consequently, Sarraf et al. showed that multiclassification methods could have high accuracy and perform more representative diagnoses of AD (ie, discriminate multiple similar conditions).
Univariate and multivariate classification
AD is a complex, multifaceted disorder with various symptoms and no singular cause. Accordingly, while fMRI deep learning methods may have high experimental accuracy, further information is required to achieve accurate diagnoses in clinical settings. In turn, some models combine other measures (eg, cognitive tests or other neuroimaging methods) with fMRI to achieve a higher classification accuracy.59 Most multivariate studies combine fMRI with other forms of MRI, such as sMRI and diffusion tensor imaging (DTI). For example, Wang et al.45 used a 3D CNN to combine sMRI and fMRI data for AD classification. They created a multivariate MRI method because they theorized that a combined approach would have a better classification accuracy than sMRI and fMRI alone. Wang et al. constructed their model using a 3D ShuffleNet, a low-intensity CNN created for mobile devices. Both the sMRI and fMRI data were preprocessed using standard methods (eg, Pearson's correlation and AAL) and a kernel canonical correlation analysis was used to combine the fMRI and sMRI data into a combined model for classification. Using data from ADNI (50 CN, 18 EMCI, 18 LMCI, and 34 AD) and an SVM, Wang et al. found that their model could classify AD from CN with an accuracy of 85.2%. They also found that their multivariate model could classify MCI from AD (84%), MCI from CN (64.8%), and EMCI from LMCI (53%) with a moderate to high accuracy. When compared to existing univariate models, Wang et al. found that their model matched or outperformed most, if not all, univariate classification models. Consequently, they showed that a multivariate deep learning model can outperform univariate models and may increase fMRI's clinical viability. Similar results have also been found in the literature using various measures of AD (eg, APOE4, demographics, DTI, cognitive tests). However, this area of exploration only has a handful of pioneering studies and requires further research and validation. See Table 1 for a summary of the multivariate studies contained in this systematic review.
Classification layers
A classification layer is a mathematical function that converts the results of a DNN into a categorical output. In the literature, most studies use a SoftMax function to convert the model output into classification groups. A SoftMax function is a multiclass classification function that calculates the probability of an input being in each outcome group. For example, in fMRI deep learning research, a SoftMax layer is used to calculate the probability that a participant has AD, MCI, or is CN based on their fMRI data. Some other alternative approaches to SoftMax layers can be used for classification in a deep learning model. For example, logistic regressions, sigmoid functions, and SVM have been used to classify AD.34 However, these methods are more common in machine learning or statistical research and do not find much use in the reviewed literature. There are some cases where an SVM may be used, such as in Wang et al.45 However, SoftMax models are preferred because they can recalibrate when presented with new information and are easily incorporated into DNN. SoftMax layers can be substituted for similar methods such as Argmax algorithms53; however, these similar methods are not as common and are beyond the scope of this paper. It should also be noted that there is a recent emergence of autoencoder and clustering techniques for classification in the computer science literature; however, these approaches have not been widely applied to AD and fMRI studies. Accordingly, classification layers often have the least effect on model accuracy out of all the discussed methods, but only because of the widespread adoption of the SoftMax function. Nevertheless, researchers should still consider the advantages and disadvantages of different classification functions when designing an fMRI deep learning model.
Deep learning models
Various types of DNN are used to classify AD using fMRI data. In this section, we outline the common types of neural networks used in the literature. Specifically, we discuss CNN, GNN, autoencoders, and RNN. See Table 2 for a brief outline of each DNN discussed in this systematic review.
| Convolutional neural networks (CNN) | Graphical neural networks (GNN) | Autoencoders | Recurrent neural networks (RNN) |
|---|---|---|---|
 |
 |
 |
 |
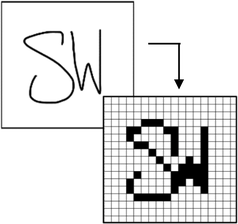
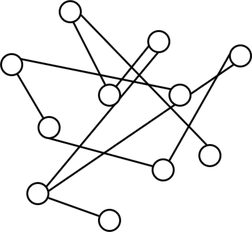
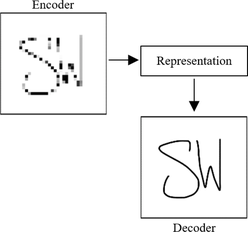
| Specialization: Image processing and analysis | Specialization: The mathematical modelling of networks and relationships. | Specialization: Dimensional reduction and learning raw data (through encoding and decoding). | Specialization: Processing and analyzing sequential data |
| Strengths: Image representation and compression as well as multivariate neuroimaging analysis. | Strengths: Multivariate analysis as well as auxiliary testing and simulation. | Strengths: Automation, performance with low signal to noise ratio, and dimensional reduction. | Strengths: processing temporal data and incorporation with other models (eg, CNN). |
| Limitations: Curse of dimensionality and often limited to 2D/3D image processing. | Limitations: Mathematically complex and abstract (for those outside the field). | Limitations: Situational and often requires integration with other models for fMRI analysis (eg, CNN). | Limitations: Situational and often requires integration with other models for fMRI analysis (eg, CNN). |
|
Example: Sarraf et al.58 97.5% classification accuracy for CN vs. AD |
Example: Qiao et al.51 95.59% classification accuracy for CN vs. AD |
Example: Lu et al.64 71.9% classification accuracy for CN vs. AD |
Example: Li et al.47 97.37% classification accuracy for CN vs. AD |
- Note: Images are only simplified depictions of deep neural network characteristics.
- Abbreviations: AD, Alzheimer's disease; CN, cognitively normal; fMRI, functional MRI.
Convolutional neural networks
CNN are a form of DNN that specialize in image processing and analysis. Unlike other methods, CNN work by systematically scanning and summarizing images into features for classification. Accordingly, CNN are specially equipped to study complex visual data such as fMRI and are the most common DNN used in the fMRI AD literature. There are multiple forms of CNN that differ in various ways, such as architecture, purpose, input, and classification method. In fMRI research, the easiest way to distinguish CNN is via dimensionality. Specifically, CNN can be categorized into 2D (eg, pixel), 3D (eg, voxel), and 4D methods (eg, voxel over time). As previously discussed, raw fMRI data are inherently 4D (spatial-temporal); however, CNN are fundamentally designed to study 2D or 3D images (just spatial information). Accordingly, there is a trade-off between model complexity and data loss where 4D data must either be coerced into a specialized CNN or dimensionally reduced to fit common 2D and 3D models. This trade-off is often called the curse of dimensionality.60
When using a 2D CNN, fMRI data are drastically reduced in dimensions to fit the neural network. This dimensional reduction is often performed using preprocessing software packages such as the FSL toolbox. Two-dimensional CNN are relatively easy to use and are not prone to the complications seen in higher dimensional models. However, the drastic dimensional reduction used for 2D models can result in significant data loss that may be key to classifying AD. Nonetheless, 2D CNN models still have great success in the literature. For example, Wang et al.44 created a 2D CNN model that could classify CN, MCI, and AD participants using fMRI data. They obtained data for 105 (40 CN, 30 MCI, and 35 AD) participants from Beijing Xuanwu Hospital and preprocessed their fMRI scans with the DPARSF toolbox (including dimensional reduction). They then computed functional connectivity measures using Pearson's correlation and the AAL brain atlas. As a result, Wang et al. classified CN, MCI, and AD with an accuracy of 82.5%.
Compared to 2D methods, 3D CNN retain one extra spatial dimension at the cost of a more complex and computationally intensive model. Three-dimensional CNN can justify this increase in complexity because the extra-dimensional information can help increase model accuracy and help distinguish similar disorders (eg, EMCI and LMCI). However, it should be noted that—thanks to recent advancements in deep learning (eg, Keras and TensorFlow) and computer hardware (eg, CPUs and GPUs)—3D CNN are not overly intensive and are relatively easy to use. In the literature, 3D CNN are the most popular type of deep learning model because they balance the trade-off between data loss and model complexity. For example, Qureshi et al.57 used a 3D CNN model and fMRI to classify dementia severity. Specifically, they used the clinical dementia rating scale to formulate AD severity groups (mild and severe). Then they trained a 3D CNN to classify AD severity based on fMRI data. The model was constructed using TensorFlow, 133 AD participants from Chosun University, and functional connectivity data computed using a group ICA. In turn, Qureshi et al. found that their 3D CNN could classify AD severity with an accuracy of 92%.
CNN are fundamentally designed to study 2D and 3D images. Accordingly, it is incredibly hard to study native (4D) fMRI data. However, some studies have suggested that the increased complexity of 4D models is worth the increase in accuracy. It is thought that 4D DNN may be more accurate than dimensionally reduced CNN because they can utilize the full fMRI time series. Accordingly, there have been a handful of studies that have adapted CNN for use with 4D data. For example, Parmar et al.37 adapted a 3D CNN model to incorporate 4D data. Specifically, they incorporated spatial information using standard convolutional layers and inputted temporal data using a filtered layer (a kernel that excludes structural data). Using this model, they classified multiple stages of the AD continuum (CN, EMCI, LMCI, MCI, and AD) in 120 participants from ADNI. The resulting 4D model had a multiclass classification accuracy of 93% and was one of the most accurate methods in the literature. Consequently, Parmar et al. suggested that 4D models may be better than dimensionally reduced models for AD classification.
Graphical neural networks
Graph theory is the mathematical modelling of networks consisting of variables and their connections. These graphical networks are often composed of geometric shapes representing variables (also known as nodes) and connective lines representing relationships. In fMRI research, GNN can be used to model functional connectivity and classify AD. GNN are a strong classification tool as they allow for the simple representation of complex phenomena. GNN also allow for theoretical testing (eg, lesion simulation) and the inclusion of various types of data (eg, neuroimaging, demographic, biomarker). Moreover, GNN can easily contain multivariate data and be combined with other neural network methods (eg, CNN). For example, Zhang et al.61 investigated the classification ability of multimodal MRI using a GCN. Specifically, they used a GCN to combine DTI and fMRI data for AD classification. They used a GCN in this study because it can contain the same fMRI imaging elements as a CNN while also enabling the incorporation of structural network information (DTI). Accordingly, they theorize that combining spatial and temporal information will result in a higher classification accuracy than each method alone. Zhang et al. mapped their DTI and fMRI data using the Destrieux brain atlas to identify regions and create structural and functional network maps. The structural maps were used as the foundation for the GCN model, which was then refined using the functional connectivity data. To test their model, Zhang et al. obtained data for 214 participants from ADNI (116 CN and 98 MCI) and performed fivefold cross-validation. In turn, they found that their model could classify MCI from CN with an accuracy of 92.7%.
GNN have shown great flexibility through their combination and compatibility with various deep learning methods and markers of AD. Accordingly, GNN are key to the multifaceted modelling of AD (eg, incorporating fMRI data with other AD markers). Moreover, GNN are also useful for constructing and representing functional connectivity networks.55 However, GNN have some limitations, such as the complexity of model design, the difficulty in modelling individual characteristics (eg, participant disease severity), and standard fMRI problems with noise. However, the limitations of GNN are gradually being overcome. For example, in a recent paper, Song et al.62 addressed three common limitations of GCN. Specifically, they made a model that could incorporate diagnostic severity information, contain participant similarity data (eg, the correlation between participants), and use multivariate MRI data (DTI and fMRI) when classifying AD. Song et al. connected all nodes in their graphical model according to diagnoses (as determined by ADNI) to incorporate diagnostic severity information. Participant similarity data were computed using the correlated distance between nodes in the graph and the ranking of nodes using a GCN. Lastly, the multivariate MRI data were included as graph edges (connections) and were processed using two GCN models (one for each MRI method). Song et al. studied 170 participants from ADNI (44 CN, 44 SMC, 44 EMCI, and 38 LMCI) and used 10-fold cross-validation to train, test, and validate their model. Accordingly, their GCN model could classify each group from one another with an average accuracy of 86.8%.
Autoencoders
Autoencoders are a unique type of DNN that learn features by compressing data in a hidden layer and then seeking to recreate it. In dementia research, autoencoders can classify AD by dimensionally reducing fMRI data and then recreating functional connectivity measures. Accordingly, this dismantling of fMRI data enables autoencoders to learn the underlying characteristics of functional connectivity networks indicative of AD. Unlike some other models, autoencoders are unsupervised, do not require labelled data, and can overcome information loss (eg, missing data). Autoencoders are not inherently built to analyze 4D data received from fMRI, but they can be adapted. In the literature, autoencoders have not been widely applied to AD and fMRI (when compared to other techniques). Nonetheless, autoencoders still have some use and can still accurately classify AD. For example, Suk et al.63 propose a deep autoencoder model (including a Hidden Markov Model) that samples the mean time series (voxels over time) of fMRI data to classify MCI from CN. They tested their models on data from 99 participants that were either manually collected or acquired from ADNI. The resulting autoencoder model classified MCI from CN with an accuracy of 81.08%.
Autoencoders can also be incorporated as both dimensional reduction and classification tools. For example, Lu et al.64 used an autoencoder clustering (a group sorting algorithm) model to classify AD using fMRI data. Specifically, they used an autoencoder for dimensional reduction and multi-kernel fuzzy clustering for classification. Participant data were acquired from multiple databases for various disorders (autism, AD, posttraumatic stress disorder, and attention deficit hyperactivity disorder). For AD, a mixture of 60 AD and CN participants were obtained from ADNI. The bassline functional connectivity maps were created using average time series and Pearson's correlations. When classifying AD from CN, Lu et al. found that their model had an accuracy of 71.9%. They also found that their multi-kernel fuzzy clustering method had the highest accuracy compared to other clustering methods (eg, k-means, fuzzy c-means, polynomial kernel fuzzy clustering). There are few studies that use autoencoders for fMRI-based dimensional reduction or classification. Nonetheless, this could be a crucial area of research to enable the automation of clinical diagnoses and reduce the need for diagnostic labels in deep learning models (see the limitations section below for further discussion).
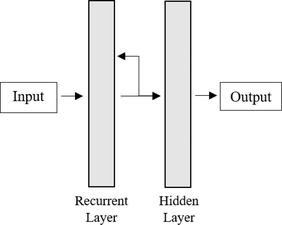
Recurrent neural networks
RNN are a specialized type of deep learning model that study data over time. RNN can study these data sequences by reusing model output as input for future comparison. In fMRI research, RNN specialize in studying changes in functional connectivity over time. Specifically, an RNN will individually process snapshots of fMRI over time and reuse those snapshots to compare with the next image in the sequence. RNN have also found great use when paired with CNN.65 As, by pairing an RNN with a 3D CNN, 3D fMRI images can be continuously compared over time in a 4D model. For example, Li et al.47 propose a method of 4D fMRI analysis using a 3D CNN and long short-term memory network (LSTM). They chose to use a 3D CNN due to its specialty in static image analysis and then modulated it with an LSTM (a type of RNN) that specializes in temporal analysis. By combining these networks, Li et al. could analyze all four dimensions (three spatial and one temporal) of fMRI data. Their study acquired data from ADNI that contained 116 AD, 99 MCI, and 174 CN participants. For comparison, they then compared their model to prominent 2D and 3D deep learning methods (eg, CNN). In turn, Li et al. found that their CNN-LSTM model outperformed all other models and had the following accuracies: 91.1% for AD vs. MCI; 88.12% for MCI vs. CN; 97.37% for AD vs. CN; and 89.47% for AD, CN, and MCI classification. Accordingly, Li et al. showed that 4D fMRI models involving RNN are highly accurate and could be useful for classifying AD.
DISCUSSION
In this systematic review, we investigate how fMRI and deep learning methods are used to diagnose AD. We found that multiple studies have used various types of DNN to diagnose different stages of AD with high accuracy. In the reviewed literature, most studies use preprocessing software such as SPM12 (to process raw fMRI data), an ICA to compute functional connectivity, a CNN to extract as well as process features, and a SoftMax activation layer to diagnose AD. There was some variety in DNN and functional connectivity measures; however, these changes were more related to study design than increasing accuracy. Accordingly, most studies had an accuracy of approximately 85%, depending on the methods used. Studies also found that deep learning methods could classify AD better than traditional techniques (eg, machine learning).51, 59 DNN are also flexible (can be retrained using new data) and can automate analyses. Accordingly, deep learning methods have significant advantages, such as increasing diagnostic accuracy and streamlining fMRI analysis.
However, deep learning fMRI methods do have some limitations. Namely, most deep learning fMRI research is very new, and most studies are only proof of concepts. For example, most fMRI deep learning models are often simplified (eg, univariate analysis, binary classification) and are not a realistic reflection of AD diagnoses in the real world.63, 64, 66 In turn, studies have provided experimental evidence that deep learning models can distinguish different stages of the AD continuum using fMRI data; however, few models have examined clinical characteristics that are essential to the real-world application of deep learning fMRI models (eg, multistage diagnosis). Deep learning and fMRI's current characteristics can help clinicians perform semiautomated, easily interpretable, and highly accurate diagnostic models.47, 67 Nonetheless, for fMRI deep learning models to become clinically viable, they must be able to classify different stages of AD (multiclass classification), be combined with other AD markers (multivariate classification), and be able to predict the early stages of AD. Many of the studies reviewed are also limited by their sample size. For example, some highly accurate models must be approached skeptically because they only test a handful of participants in each group. While acquiring neuroimaging data is difficult, studies and their diagnostic models cannot be generalized using such a small sample population.
It is also important to highlight some key limitations of this study. First, it should be stated that the reviewed literature is highly dependent on the ADNI database and, thus, has a large overlap in sample populations. This reliance is caused by the high cost of acquiring fMRI data and the inaccessibility of alternative databases. For example, the UK BioBank has a large fMRI dataset but is expensive to access. Second, this study proposes deep learning as a method for improving the analytical stage of fMRI. However, we do not focus as much attention on improving the stages of data collection and preprocessing. Both stages are still incredibly resource intensive and are not favorable for clinical analyses (when compared to other techniques). We have chosen not to focus on these issues because they require innovations beyond the field and the scope of this paper. Nonetheless, significant advances in the standardization and automation of fMRI procedures are occurring and should improve with time (eg, big databases, cloud computing, supercomputers, automated preprocessing tools). Third, it should be noted that the scope of this paper is limited. There is more to fMRI and deep learning research than resting-state measures and classification models. However, we have chosen to focus on these topics because we believe they are important areas that are friendly and accessible to new researchers. Hopefully, this review can be a foundation for future investigation into cutting-edge fMRI techniques and deep learning methods. Finally, we would like to highlight that this review heavily focuses on supervised deep learning models. These supervised models rely on diagnostic labels that are defined by clinical tests. Consequently, some of these models may be limited by the clinical diagnoses that define them. This interaction requires further research and comparison to automated models.
Future research should expand on the current literature and address the abovementioned limitations. We suggest that future research should investigate areas such as early-stage AD, multivariate diagnostic models, dementia type classification (eg, vascular dementia or frontotemporal dementia vs. AD), and high-dimensional (4D) models. There is a critical need for research that can diagnose AD at an early stage and distinguish different forms of dementia. Innovations in these areas of AD diagnoses could drastically improve treatment opportunities and individuals’ quality of life. We also suggest that future studies should seek to overcome current limitations using techniques such as multiclass classification models, moderating potential confounds (eg, neuropsychiatric symptoms of AD), and increasing sample size. Sample size limitations are a large problem and could be overcome using multiple databases, transfer learning, data augmentation, data sharing, and other populations. In turn, future studies may have to rely on more samples than just ADNI alone and should be wary of the overuse of the dataset. Next, we believe that researchers should invest in the larger fields that overlap with this topic. This review is small in scope; however, the topic occurs at the intersection of dementia, neuroimaging, and artificial intelligence research. These fields are monumental, and innovations in one will affect the others. Accordingly, we suggest that researchers embrace the interdisciplinary nature of this field and collaborate to help tackle AD. Finally, we want to stress that future research should equally consider a model's accuracy, generalizability, and clinical viability when classifying AD. There is more to classification than accuracy. Accordingly, we hope that, in due time, these models can become clinically viable and accessible.
In conclusion, deep learning techniques are state-of-the-art and rapidly changing how we (as a community) approach AD diagnoses. Currently, fMRI deep learning methods are highly accurate, yet they are also very new and require substantially more research. In this systematic review, we have discussed the current methods of fMRI deep learning research for AD classification. We hope this review can help researchers understand the capabilities of fMRI and deep learning methods for AD. We also hope that this review can help introduce new neuroscientists and psychological researchers to cutting-edge computer science techniques. We hope this study encourages more research into fMRI deep learning techniques and can ultimately help improve diagnoses for individuals on the AD continuum.
ACKNOWLEDGEMENTS
SW would like to thank his partner LW for her ongoing support throughout his candidature.
The authors declare no conflict of interest.
Open access publishing facilitated by Bond University, as part of the Wiley - Bond University agreement via the Council of Australian University Librarians.