Profiling of phytochemicals using LC-ESI-MS2, in vitro, in vivo characterization and cosmeceutical effects of Alpinia galanga (wild) extract loaded emulgel
Abstract
Background
The potential as a depigmenting agent, sun protection, and healthy benefits is indicated by the sun protection factor, radical scavenging, and tyrosinase inhibitory activities of Alpinia galanga (wild).
Aims
A stable emulgel containing A .galanga (wild) extract is prepared. This emulgel is then characterized by in vitro evaluation and identification of contents by LC-ESI-MS2. In vivo performance is counted in terms of moisturizing, melanin level, erythema, sebum, skin fine pores and large pores analysis, and other related physiological skin parameters.
Methods
DPPH radical scavenging activity, total phenolic and flavonoid counts were used to measure the free radical scavenging and tyrosinase inhibitory capability of A .galanga (wild) extract, respectively. LC-ESI-MS2 used for phytochemical analysis. Emulgels synthesize, and their globule size, Ultracentrifugation, pH, and conductivity were all evaluated. Among the developed formulations, the optimal emulgels formulation underwent 90-day stability tests for organoleptic characteristics and rheology at 8°C, 25°C, 40°C, and 40°C + 75% RH (relative humidity). Using sebumeter®, mexameter®, and corneometer®, changes in skin physiological parameters were assessed over the course of 12 weeks in 13 healthy male, Asian volunteers. VisioFace® is used for computational analysis of high-resolution pictures to determine the % area, fine pore counts, and large pore counts of the skin.
Results
The antioxidant, tyrosinase inhibitory potential and counts of total phenolic and flavonoids of A .galanga (wild) extract were impressive (85%, 75%, and 48.0 mg GAE/g and 14.37 mg quercetin/g, respectively). In terms of stability evaluation, globule size (0.7528 ± 0.192 μm). Optimized A .galanga (wild) ethanol aqueous (AGEA) extract loaded emulgel was stable in terms of organoleptic and in vitro evaluation. The AGEA formulation significantly reduced the amount of sebum, erythema, fine pore counts, large pore counts, fine pore % area and large pores area percentage while significantly improved the moisture and elasticity of the skin.
Conclusion
A stable A .galanga (wild) extract loaded emulgel was successfully produced that improved the skin physiological parameters in terms of skin's sebum, erythema, moisturizing, melanin, and pores.
1 INTRODUCTION
Medicines obtained from plants are widely used traditionally in almost all cultures worldwide and are now gaining popularity as natural alternatives to synthetic medicines. The use of herbal medicines has grown many folds in the last few decades. Recently, it is gaining popularity in the world due to its natural origin and less side effects.1
The plants of Zingeberaceae family are known for their therapeutic and medicinal value and are found in throughout tropics, especially in east and south Asia. These plants are consumed as food, perfumes, dyes, spices, and medicines.2 Alpinia galanga is one of the members of Zingeberaceae. Rhizomes of A .galanga grow underground which have strong aroma.1 Because of its pungency and characteristics aroma, galangal is widely used in food, condiment, and local medicine in China and Thailand.3 Essential oil from rhizome, roots, leaves, and stem containing sesquiterpenes and E-methyl cinnamate impart its characteristic odor to medicines and food.4 In addition to essential oil, the rhizome contains terpenoids, phenolic acids, saponins, and flavonoids.5 The main bioactive compounds isolated from rhizome are 1-8-cineole, galangal acetate, and kaempferol.6, 7 This is traditionally used to relief in bronchial catarrh, throat infection, fever, rheumatism, ulcers, and dyspepsia while the rhizomes widely used in skin disorder, respiratory disorders, and cardiovascular and stomach disorders.8 It is reported that rhizomes have expectorant, analgesic, antibacterial, immunostimulant, anti-malarial, anti-fungal, hepatic protective, and antioxidant activities.9, 10
Due to several advantages, skin drug delivery represents a better substitute than conventional oral drug delivery system including avoidance of gastrointestinal irritation, lowest systemic toxicities, avoidance of first pass effect and providing steady plasma concentrations.11 Gels are relatively a new class of topical drug delivery that are produced by incorporating a large amount of water or hydro alcoholic phase in meshwork like structures of colloidal range particles which may contain inorganic substances or organic polymers of natural and synthetic sources. The higher amount of aqueous phase allows better dissolution of drug. As compared to ointments and creams, release of drug through vehicle is also easy from gel. All of these properties make them superior in terms of usage and patient acceptance. Despite being so useful, hydrophobic drugs cannot be delivered through gels. To control this limitation, emulgels are formulated so that oil-based drugs can enjoy the properties of gels. Emulgels consists of oil in water and water in oil emulsions with gels in which gelling agents are dispersed in aqueous phase. Emulgels show many useful properties in dermatology such as thixotropic, enhanced spreadability, transparent, easily washable, greaseless, emollient, non stains, bio-friendly, increased shelf life, and elegant appearance.12
2 MATERIALS AND METHODS
2.1 Reagents
Span 80, Tween 80, Aluminum Chloride, Sodium Nitrite, 2,2-diphenyl-1-picrylhydrazyl (DPPH) (Sigma chemicals USA), Sodium Hydroxide, Sodium dihydrogen Phosphate and Ferric Chloride (Sigma Aldrich, USA), Propyl Paraben and Methyl Paraben (Acros Organic, USA), Ascorbic Acid, Quercetin, Gallic Acid, Paraffin Oil, Ethanol, Methanol, Triethanolamine, Folin–Ciocalteu reagent and Propylene Glycol (Merck, Darmstadt, Germany), Distilled Water obtained from Cosmeceutical Lab, Stearic Acid Merck, Darmstadt, Germany.
2.2 Instruments
Rotary Evaporator (Heidolph, co. Ltd.), Microplate Reader HT (Biotek instrument, USA), UV–VIS spectrophotometer (UV 4000 ORI, Germany), Refrigerator (Dawlance, Pakistan), Electrical Digital Balance (Precisa BJ-10), Hot incubator (Sanyo, Japan), Humidity Meter (TES Electronic Corp.), UV-Tech Microplate reader, pH meter (WTW pH-197i, Germany), Optical Microscope (Eclipse E200, Nikon, Japan), Sonicator (Elma, Hettich EBA 20), Digital Conductivity Meter (WTW pH-197i, Germany).
2.3 Plant material
Dried rhizomes of A .galanga were purchased from local market and after identification and confirmation were used. Dried galangal rhizomes were washed with laboratory tap water to remove the dust or debris and thoroughly dried in the shadow area. After drying, they were crushed and grinded to convert into powder using a grinding machine. Then, the powdered drug passed through sieve no. 60. This powdered drug was kept in polythene bag in refrigerator for further processing.13, 14
2.4 Preparation of phenolic rich extract
As described in literature, galangal powder was extracted with 50% ethanol, 60% ethanol in distilled water, absolute methanol, and distilled water alone. All the samples were macerated with relevant menstrum with three to four times per day slight shaking. After 3 days, supernatant layer was separated and passed through filter paper, and the extract was finally dried in rotary evaporator at 40°C and stored in refrigerator for preparation of Emulgels and in vitro testing.15, 16
2.5 Preparation of emulgel (Control and A .galanga loaded emulgel)
First of all, oil in water emulsion was prepared with the ingredients shown in Table 1. Oil phase and water phases were heated to 75°C and then mixed oil phase in water phase gradually under constant stirring at 2000 rpm using homogenizer; then, the stirring was reduced to 1000 rpm. After 10 min, stirring was reduced to 500 rpm for 5 min for optimal homogenization of the globule size. After cooling the emulsion, Gel was prepared by dispersing gelling material carbopol-940 (1.5%) at 2000 rpm with distilled water. After complete dispersion of gelling agent, triethanolamin was added to achieve the desired pH of the gel. Then, emulsion and gel are mixed with constant stirring under homogenizer. Same procedure was adopted to prepare hydro alcoholic extract (60% ethanol: 40% distilled water) A .galanga extract loaded formulation. 4% phenolic rich ethanol water (60:40) galangal extract was incorporated in the AGEA loaded emulgel.
| Ingredients | Phase | F1 | F2 | F3 | F4 | F5 | F6 |
|---|---|---|---|---|---|---|---|
| Liquid paraffin | Oil phase | 10% | 10% | 10% | 10% | 10% | 10% |
| Glyceryl monostearate | 1% | 1% | 1% | 1% | 1% | 1% | |
| Span-80 | 0.2% | 0.3% | 0.4% | 0.5% | 0.6% | 0.7% | |
| Propyl paraben | 0.06% | 0.06% | 0.06% | 0.06% | 0.06% | 0.06% | |
| Tween-80 | Water phase | 1.5% | 1.5% | 1.5% | 1.5% | 1.5% | 1.5% |
| Propylene Glycol | 10% | 10% | 10% | 10% | 10% | 10% | |
| Methyl paraben | 0.11% | 0.11% | 0.11% | 0.11% | 0.11% | 0.11% | |
| AGEA extract | 4% | 4% | 4% | 4% | 4% | 4% | |
| Distilled water | 77.13 | 77.03 | 76.93 | 76.83% | 76.73 | 76.63 |
2.5.1 Phytochemical analysis
Total phenolic contents
Folin–Ciocalteu solution reagent was used to determine the counts of total phenolic in A .galanga extract.17 1 mg of extract was dissolved in 9 ml distilled water and 1.0 ml of FCR reagent. 10.0 ml of Na2CO3 was added in this solution, and distilled water was added to achieve 25 ml volume. Mixture was left for 90 min at 25°C temperature. After incubation, absorbance was measured at 750 nm. Counts of total phenolic (TPC) was expressed as μg of gallic acid equivalent (GAE)/mg of the dry weight of A .galanga rhizome sample.
Total Flavonoid Contents
Counts of total flavonoid (TFC) were measured by the slight modification of Park's method18: 0.1 ml of 0.3 mol/L hydrated aluminum chloride was added to a mixture containing 0.3 ml A .galanga extract sample and 0.5 mol/L sodium nitrite. 3.4 ml of 30% methanol was added to the above mixture; then, absorbance was recorded at 506 nm. Total flavonoid content (TFC) was expressed as μg quercetin equivalents (QE)/mg of the dry weight of A .galanga rhizome extract.
2.5.2 DPPH radical scavenging activity
2.5.3 Sun protection factor
The formulation's in vitro sun protection factor was determined by using a spectrophotometer in previously described method.20 In a volumetric flask, 1 g of the material was diluted with ethanol to make 100 ml, and 5 min of sonication followed. After being sonicated, the solution was filtered through a cotton plug, with the first 10 ml being discarded. Then, 5 ml of this was once more diluted with ethanol to make 50 ml, and then, 5 ml of it was diluted with ethanol to make 25 ml. The sample's absorption was then measured in the 290–320 nm region, every 5 nm, using ethanol as a blank. The Mansur equation was used to determine the SPF.21
2.5.4 Tyrosinase enzyme inhibition activity
Kim's method with slight modifications was adopted to perform the tyrosinase inhibition assay of the AGEA extract samples with kojic acid as a positive control17 In this method, 60 units of enzyme were added to 150 μl of buffer (50 mM of pH 6.8) and 10 μl of test compound in each well was incubated at 30°C for 15 min. After incubation, pre-read was recorded at 480 nm. Then, l mM of substrate per well was added and re-incubated at same condition for 30 min. After re incubation, absorbance was again measured at same frequency.
2.5.5 LC-ESI-MS2
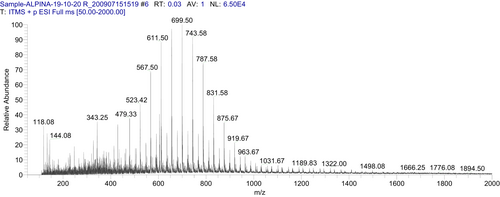
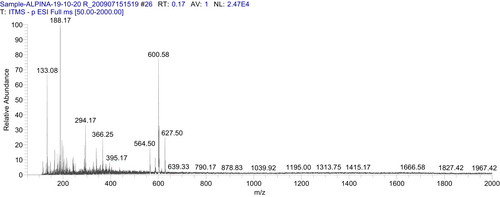
To determine bioactive metabolites of A .galanga extract, mass spectrometry using an LTQ XL linear ion trap mass spectrophotometer (Thermo Scientific) was used having an electron spray ionization (ESI) interface. The AGEA extract sample was prepared by dissolving in methanol (MS grade). To operate the system, Xcalibur data acquisition and interpretation software were used. The system was fitted with a column of measurements (250 × 2.0 mm ODS-VP C18, 5 μm). Liquid chromatographic conditions comprised a mobile phase solvent B (0.1% formic acid) and solvent A (methanol). Gradient mode of elution started with 5% A (0–5 min), 5%–45% A (5–90 min), 45% A (90–100 min), and 45%–5% A (100–101 min). The sample was injected after filtration by using a syringe pump at 5 μl. min−1 flow rates. The procedure was performed in both positive and negative ion full-scan modes in the range of m/z 50–2000. Source voltage of 4.8 kV and 23 V (capillary Voltage) used during the procedure. Thirty arbitrary units Sheath glass flow (N2) was used, and capillary temperature was at 350°C in both positive and negative scan. Fragmentation of the eluted mixture was performed in positive and negative ion (Figure 1 and Figure 2) mode, respectively, by using 35% (% of 5 V) collision-induced dissociation energy.22
2.6 Physicochemical characterization of emulgel
2.6.1 Globule size
The temperatures that the base and AGEA extract formulation were kept at (8°C, 25°C, 40°C, and 40°C + 75% RH) varied. Using an optical microscope, globule morphology and the trend of size change (increase or decrease) were measured during a 12-week period (Eclipse E200, Nikon).
2.6.2 Organoleptic evaluation
For a period of 3 months, the stability analysis of the formulation, AGEA emulgel, and control emulgel was conducted. The tests for conductivity, spreadability, and pH were carried out at room temperature. At predefined intervals, organoleptic criteria such as color, odor, feel, and appearance were examined. By inserting the probe into the emulgel, a digital pH meter, model pH 197 (WTW) was utilized to measure the pH of the AGEA emulgel and the control emulgel. Triplicate measurements of pH were taken. The WTW COND-197i conductivity meter was used to measure the conductivity of the AGEA emulgel and the control emulgel by inserting the probe in the emulgel. Values are measured and obtained in triplicate.23
2.6.3 Rheological studies
Rheology is a crucial consideration when examining the stability and flow characteristics of topical preparations. Rheological characteristics of the AGEA emulgel and the control emulgel were measured at 25°C for 3 months, including viscosity, shear rate, and shear stress. Programmable rheometer (rheocalc version 2.5.5: Brookfield model DV-III and spindle number CP41) was used to assess AGEA and control emulgels. Shear stress, viscosity, and shear rate were all measured in triplicates during rheological study. The rheological behavior of each emulgel was assessed at 20–100 rpm using about 0.5–0.01 g of each emulgel as the sample material.
2.7 Non-invasive in vivo studies
2.7.1 Study design
Thirteen Asian male volunteers between the ages of 20 and 35 participated in a 3-month monocentric, single-blind, non-invasive in vivo investigation.24 After receiving clearance from the Pharmacy Human Ethics Committee (PHEC) having Ref. No. 122–2021-/PHEC, the ethical guidelines protocol was followed. Following the Advanced Studies and Research Board's permission, volunteers were chosen based on ethical protocol. The Declaration of Helsinki was followed in conducting the study. All study participants signed written informed consent forms. Participants received thorough information on the goal, techniques, and any negative effects. Each volunteer underwent a comprehensive examination for any skin conditions, particularly on the face and forearms. Smokers, people with allergies to any substance, and anyone with a history of skin conditions were excluded from the study.
2.7.2 Patch test
Before the in vivo study began, all individuals had a patch test on their forearms for 48 h to check for hypersensitivity and irritation to the two emulgels, AGEA emulgel and Control emulgel. Baseline readings were taken and showed 0 h time values prior to applying emulgel. On both forearms, a 4 5 cm area was marked. On the left forearm, a patch containing 1 g of AGEA was applied, and on the right forearm, a patch containing 1 g of control emulgel. The patches were covered with surgical dressing. Both patches were removed after 48 h and cleaned with sterile saline solution. Then, forearms were examined for any emulgel patch-related itchiness, irritation, erythema, or hypersensitivity. After applying the patch test, values were measured once more. All subjects received AGEA emulgel and control emulgel jars after completing the patch test, which were marked “left and right” to indicate which cheeks the emulgels should be applied to. To prevent the fluctuation in results caused by self-administration, each subject was told to apply a fixed amount of emulgel to a 100 cm2 area. Before going to bed at night and in the morning, subjects were told to apply gels. Additionally, they were told to show up for readings on Weeks 2, 4, 6, 8, 10, and 12. Volunteers were requested to stay for 30 min on the day of the scheduled reading in order to acclimate their body temperatures to the regulated laboratory temperature (25°C, 40% RH).
2.7.3 Evaluation of skin mechanical properties
The skin's moisture level was measured using a corneometer CM825 linked to a multiprobe MPA5 (Courage, Khazaka, GmbH). This tool can measure the moisture content of the epidermal skin layers as deep as 0.1 mm. The mechanical characteristics of the epidermis (melanin and erythema) were measured using a cutometer fitted with an MPA5 probe (Courage, Khazaka, GmbH). Elastometer linked to multiprobe MPA5 (Courage, khazaka, GmbH) with probe with 2 mm opening was used to assess skin elasticity. Sebum level was measured using a sebumeter linked to a multiprobe MPA5 (Courage, Khazaka, GmbH). Measurements were taken in mode 1 (time/strain mode). Steady -ive pressure of (350 m bar) was used for 18 seconds (sucking period), then for 2 s (relaxation period).
2.8 Statistical analysis
3 RESULTS
3.1 Antioxidant activity
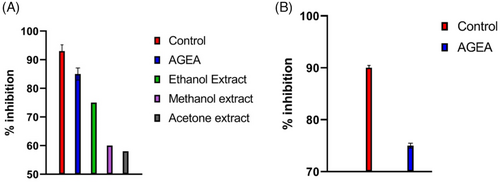
Figure 3A shows that the antioxidant activity of AGEA extract when compared to the reference (ascorbic acid) was 85%, demonstrating the suitable candidates for topical cosmeceutical applications.
3.2 Anti-tyrosinase enzyme inhibition
Tyrosinase enzyme inhibition activity of AGEA extract was calculated as 75% and presented in Figure 3B.
3.3 Sun protection factor
In this study, sun protection factor (SPF) of AGEA emulgel found to be 17.
3.4 Total phenolic contents
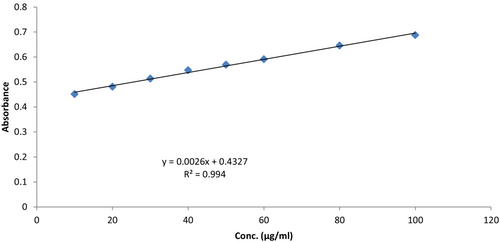
The outcome was stated in gallic acid equivalents (GAE) by calculating a separately prepared absorbance versus concentration curves for gallic acid. Total phenolic content of AGEA extract, in this study, was 48.0 mg GAE/g. Gallic acid regression line with total phenolic content is shown in Figure 4.
3.5 Total flavonoid contents
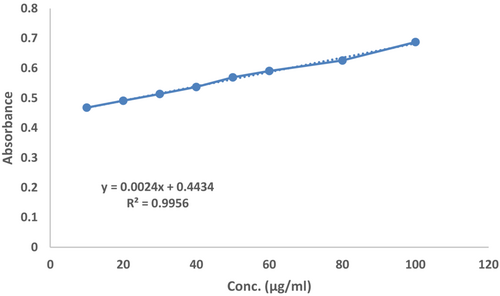
Total flavonoid content (TFC) was expressed as microgram quercetin equivalents (QE)/mg of the dry weight of AGEA extract sample. In the current study, the total flavonoids contents in AGEA extracts containing formulation were 14.37 mg quercetin/g. Regression line of quercetin with total flavonoid content is shown in Figure 5.
3.6 LC-ESI-MS2 analysis
Tentative identification of Quercetin, malonylhexoside 2, Hesperidin, or Cyanidin 3,5-O-diglucoside, Malic Acid, Coumarin or Cinnamic acid (E-cinnamic acid), Trans-p-coumaric acid, Catechin, (+)-Catechin or (−)-Epicatechin, Cinnamyl cinnamate-O-pentoside, and Trihydroxyoctadecadienoic Acid was done as shown in Table 3.
3.7 Physicochemical characteristics
3.7.1 Organoleptic evaluation
At any temperature and humidity, neither the placebo nor the AGEA emulgel formulation changed in color, smell, phase separation, or liquefaction over the course of the 90-day research. Table: 3 showed the formulation's organoleptic characteristics and microbiological growth at various temperatures.
3.7.2 pH and Conductivity
The pH of the test formulation was 6.12, while the pH of the placebo was 6.14. Figure 6A,B illustrates how the pH of the extract and placebo formulations changed. Electrical conductivity decreased in the test formulation and the placebo in the current investigation. As illustrated in Figure 7A,B, this decrease in electrical conductivity was almost equal in both formulations kept at high temperatures and high humidity levels (40°C and 40°C + 75% RH).


3.7.3 Microscopy
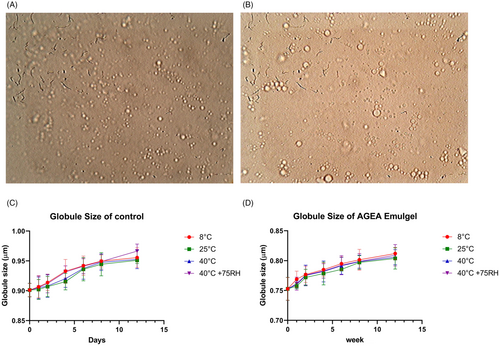
Both the Control and the AGEA Emulgels had globules that were consistently spherical during the course of the research. Additionally, there was a minor upward tendency in globule size over time (Figure 8A–D). Globule size of fresh AGEA emulgel and AGEA emulgel after 3 months was 0.7528 ± 0.192 μm and 0.8120 ± 0.0103 μm, respectively. This was increased slightly with increased in time. When two-way ANOVA was applied by using LSD, insignificant difference obtained by keeping 8°C as the reference. While according to paired t-test, insignificant difference observed between microscopic values of AGEA and Control.
3.7.4 Centrifugation test
Throughout the whole research, there was never any phase separation in any formulation. This demonstrates how stable formulas are. Emulgel stability is primarily a result of adequate homogenization during preparation, which should result in globules that are as small as possible and completely dispersed in the gel medium. Table 2 displays the centrifugation test results.
| Organoleptic parameters | Temperatures | Time (days) | |||||||
|---|---|---|---|---|---|---|---|---|---|
| 0 h | 24 h | 7 | 15 | 30 | 45 | 60 | 90 | ||
| Color | 8°C | LB | LB | LB | LB | LB | LB | LB | LB |
| 25°C | LB | LB | LB | LB | LB | LB | LB | LB | |
| 40°C | LB | LB | LB | LB | LB | LB | LB | LB | |
| 40°C + 75% RH | LB | LB | LB | LB | LB | LB | LB | LB | |
| Liquefaction | 8°C | – | – | – | – | – | – | – | – |
| 25°C | – | – | – | – | – | – | – | – | |
| 40°C | – | – | – | – | – | – | – | – | |
| 40°C + 75% RH | – | – | – | – | – | – | – | – | |
| Phase separation | 8°C | – | – | – | – | – | – | – | – |
| 25°C | – | – | – | – | – | – | – | – | |
| 40°C | – | – | – | – | – | – | – | – | |
| 40°C + 75% RH | – | – | – | – | – | – | – | – | |
- Abbreviations: Means = No change; LB means = Light Brown.
| No. | RT | Compound class | Formula | [M−H]− | [M + H]+ | Fragmentation pattern | Tentatively identified compound |
|---|---|---|---|---|---|---|---|
| 1 | 9.23 | Quercetin malonylhexoside 2 | C24H22O15 | 551.5 | 551, 303 | Kramberger, Barlič-Maganja et al.,25 | |
| 2 | 9.85 | Hesperidin or, cyanidin 3,5-O-diglucoside | C28H34O15, C27H31O16+ | 611.50 | 611, 593, 449, 287 | Mena, Calani et al.,27 Xu, Shin et al.,29 Yisimayili, Abdulla et al.,28 Chen, Zhong et al.,26 | |
| 3 | 10.58 | Malic acid confirmed | C4H6O5 | 133.5 | 115, 87 | Mena, Calani et al. 2012, Mekam, Martini et al.30 | |
| 4 | 10.67 | Coumarin or cinnamic acid (E-cinnamic acid) | C9H6O2, C9H8O2 | 147.5 | 147, 119, | Farag, Kabbash et al.,31 | |
| 5 | 10.77 | Trans-p-coumaric acid | C9H8O3 | 165.5 | 165, 147, 119 | Hong, Chang et al.32 | |
| 6 | 11.34 | Catechin, (+)-Catechin or (−)-Epicatechin | C15H14O6 | 289.5 | 289, 271, 245, 179, 109, 261 | Barry, Davies et al.,33 Nuengchamnong and Ingkaninan.35 Mena, Calani et al.,27 Ben Said, Arafa I et al.,34 | |
| 7 | 12.10 | Trihydroxyoctadecadienoic acid | C18H32O5 | 327.5 | 327, 283 | Farag, Kabbash et al.,31 | |
| 8 | 12.64 | Cinnamyl cinnamate-O-pentoside | C23H39O5 | 395.5 | 395, 263 | Farag, Kabbash et al.,31 |
3.7.5 Rheological evaluation
The findings revealed that all of the samples stored at various storage temperatures, including 8°C, 25°C, 40°C, and 40°C with 75 percent RH, exhibited pseudo-plastic, non-Newtonian behavior over time. Additionally, the AGEA emulgel displayed shear thinning behavior when the Ostwald power law was used. Freshly prepared AGEA emulgel had an apparent viscosity of 438.40 cP, which dropped with time and as shear rate and shear stress were increased, as seen in Figure 9A,B. The pseudo-plastic non-Newtonian behavior of AGEA emulgel was confirmed by the flow index of AGEA at several storage locations, including 8°C (refrigerator), 25°C (incubator), 40°C (incubator), and 40°C (incubator) with 75% RH, which was <1.

3.7.6 Non-invasive in vivo studies
Patch test
Before beginning in vivo investigations, the patch test was conducted on the chosen human participants to measure their erythema level. The results demonstrated that no volunteer experienced an increase in erythema level, indicating that AGEA emulgel was safe and acceptable for topical administration in the chosen volunteers.
Skin moisture contents
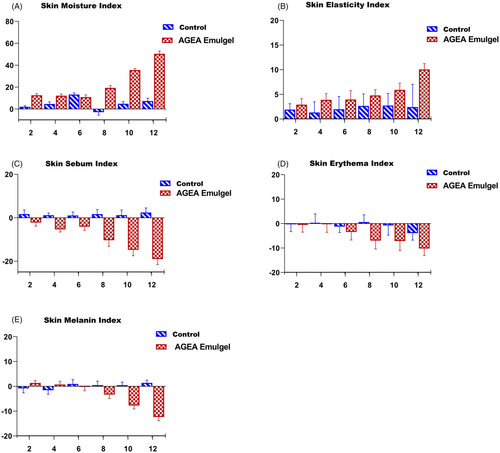
A corneometer was used to measure the moisture content of the skin. To delay aging, it is critical to maintain healthy skin moisture levels. Thirteen people participated in the study over the course of 12 weeks. The outcomes are displayed in Figure 10A. In comparison, AGEA emulgel has a 50 percent higher moisture content level. Control emulgel raises moisture level by only 10%, which is significantly less than the AGEA emulgel. Applying the LSD test, a significant difference was discovered using the 0 week as a baseline. A significant difference was found in contrast to the control emulgel using the paired sample t-test. At 8, 10, and 12 weeks, statistical results were significant (p = 0.01) when compared to control gel. Due to phenolic and flavonoids rich AGEA extract, emulgel causes the skin's moisture content to increase.
Skin elasticity contents
Figure 10B from the current study shows that, in contrast to the placebo, AGEA emulgel significantly increased volunteers' skin elasticity. AGEA emulgel increased the elasticity level by a 10% when compared to control emulgel. Furthermore, this rise was statistically significant at Weeks 4, 6, 8, 10, and 12 weeks of the trial, whereas the placebo increased skin's elasticity irregularly but there was a slight gain in elasticity at all intervals of studies. The goal of the current study was to create a stable emulgel that contained A .galanga extract and to characterize it in vitro and in vivo as a cosmeceutical product. Cells are damaged by free radicals, and antioxidant chemicals can stop and stabilize this damage.36 The DPPH method is a relatively quick and simple assay for spectrophotometric evaluation of antioxidant activity. AGEA emulgel demonstrated substantial antioxidant capacity in the current investigation, which is consistent with the evidence already available and points to their potential use in cosmetology.
Skin sebum contents
As seen in Figure 10C, AGEA emulgel decreased the volunteers' skin sebum levels while the placebo raised it over time. About 20 times the initial zero-time value, the % change in sebum level caused by AGEA emulgel was highly noticeable. Furthermore, it was discovered to be statistically significant at Weeks 4, 6, 8, 10, and 12 of the trial, but the effect of the control on the amount of sebum was irregular and observed statistically insignificant from zero time value to Week 12. The paired t-test revealed a significant difference between AGEA emulgel and control-induced changes in sebum levels.
Skin erythema level
According to the data, the volunteers' levels of erythema decreased as a result of both AGEA emulgel and control emulgel. As shown in Figure 10D, AGEA significantly increased this decline compared to control (10 times more than that of zero-time value). Additionally, unlike the placebo, this drop persisted and was statistically significant at Weeks 6, 8, 10, and 12. The paired t-test revealed a significant difference between the AGEA and control-induced erythema's reduced levels.
Skin melanin level
Figure 10E demonstrates that during the study period, AGEA emulgel lowered the level of skin melanin whereas the control emulgel increased it at Week 6, 8, 10, and 12. The amount of skin melanin that changed as a result of AGEA was insignificant but increasing by nearly 12 times from the starting zero-time value.
Skin fine and large pore analysis
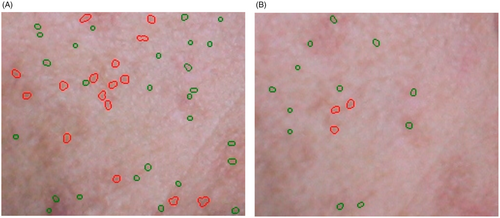
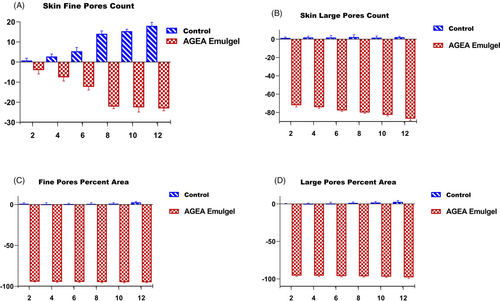
High-resolution photographs of the volunteer's test area (the cheeks) taken after two, six, and 12 weeks after applying AGEA emulgel were analyzed and compared with baseline images using the VisioFace® image analyzer (Figure 11A,B). The small pores count, large pores count, percent small pores area, and percent large pore area for each image were examined by accompanying software. Figure 12A–D displays the percentage change in small pores count, large pores count, percent small pores area, and percent large pore area. As shown in Figure 12, analysis revealed an average reduction of 20 percent in small pore count, 85 percent in large pores count, and almost 80%–90% I fine and large pore area after applying AGEA emulgel. At the conclusion of the trial, ANOVA revealed significant differences in all above 4 parameters when compared with AGEA and control emulgel.
4 DISCUSSION
Phenolic molecules, which are known as aromatic secondary metabolites, are found frequently in plants. They have been associated with antioxidant qualities; therefore, it seems sense that these chemicals are what give plants their antioxidant activity.37 The hydroxyl groups in phenols have demonstrated a potent free radical scavenger. As a result, the existence of total polyphenol contents can be used to identify the antioxidant activity of plants. Different biological activities involving anticancer action are displayed by flavonoids and their derivatives. The fact that flavonoids are the most prevalent and extensively distributed class of phenolic chemicals present in plants contributes greatly to their antioxidant capabilities.38 Previous studies state that AGEA rhizome extract has phenolic and flavonoids compounds which have antioxidant activities.15
The ratio between the minimal erythema doses in protected and unprotected skin is actually determined by sun protection factor. Basically, UV energy during sun exposure causes the least amount of erythema on both protected and unprotected skin.39 A higher SPF value demonstrated that the formulation protects against the harmful UVR effects of sunshine. In vitro testing indicated that developed emulgel has great capacity for sun protection. Previous studies have demonstrated the ability of AGEA to protect skin against photodamage.40, 41
The rate-limiting steps in the production of melanin are mediated by the tyrosinase enzyme. When incubated with L-DOPA, relative tyrosinase activity can be measured. Tyrosinase changes L-DOPA during incubation dopachrome during incubation. The reddish-brown pigment dopachrome can be identified by UV spectrophotometric analyzer. Inhibition of tyrosinase can be measured by any chemical or natural substance by adding substance into its solution. By using this principle, tyrosinase inhibiting potential of AGEA extract was determined. The considerable anti-tyrosinase potential of AGEA extract in the current study may be credited to polyphenolics and flavones present in AGEA.42 As the skin serves as an environmental barrier, its pH ranges from 4.0 to 7.0. The pH range in these limits is acceptable for emulgels, emulsions, and cosmetic preparations.43 Different storage conditions revealed a decrease in the formulation's pH, which could be the result of paraffin liquid oxidizing into aldehydes and organic acids. The pH change was insignificant at the 0.05 level of significance, and these are within the acceptable range for topical and dermatological formulations. According to results, the formulation is stable at all temperature conditions. Additionally, emulsion stability is established by emulgel's consistency and flow parameters, which also serve as indicators of impending emulsion formulation's de-stability. Emulsion consistency is assessed using the Consistency Index (K), whereas non-Newtonian flow behavior is assessed using the Flow Index (n).44 For topical administration systems to perform in vivo, active ingredients must penetrate the stratum corneum. In this investigation, skin penetration was shown to be improved when herbal components were added to an emulgel delivery system. This was caused by the emulsion's smaller size and the emulsifier's impact.45 L-Tyrosine is transformed into melanin via a chemical cascade that takes place in the melanosomes of melanocytes which results in production of epidermal melanin. The tyrosinase and associated proteins (TRP-1 and TRP-2) regulate this metabolic process. Tyrosinase and associated proteins are inhibited by phenols and polyphenols in a competitive way. The presence of phenolic and polyphenols chemicals in AGEA, a rich source of phenols and flavonoids, may be related for the promising reduction in melanin index and skin pore counts and pore percent area in the present study.44 Moisture levels in the skin are essential for physiological development, regeneration, and maturation of skin. The recent investigation showed that the level of skin moisture has significantly increased. Dry skin is more prone to premature aging and wrinkles due to trans-epidermal water loss.46 Flavonoids and phenols regulate the proteins involved in maintaining the epidermal barrier, which helps to hydrate the skin. Furthermore, liquid paraffin used to formulate the emulsion for emulgel, intrinsically preserves the skin's epidermal barrier, hence minimizing trans-epidermal water loss.44
Although skin sebum serves as a lubricant and gives the stratum corneum its waterproofing characteristics as outermost layer, excessive sebum can clog pores, which can result in the development of facial acne. In the current investigation, the skin sebum index increased; however, increase was not pronounced and was observed with both the control and test emulgel. The oil phase of both the control and test AGEA emulgels, paraffin liquid, may be responsible for this rise.47
5 CONCLUSION
Recent studies revealed that emulgel enriched with AGEA extract have powerful antioxidant effects and evident that it lowers pores, melanin and sebum levels and enhanced hydration and elasticity.
AUTHOR CONTRIBUTION
Muhammad Shahzad Khan performed the investigation, methodology, formal analysis, investigations, software, and writing the original version. Prof. Dr. Naveed Akhtar and Dr. Qazi Adnan Jamil involved in conception, methodology, formal analysis, investigations, resources, and supervised the project.
ACKNOWLEDGMENT
The authors would like to thank Prof. Dr. Naveed Akhtar, Dean, Faculty of Pharmacy and alternative medicine, the Islamia University of Bahawalpur and Dr. Qazi Adnan Jamil, Lecturer, The Islamia University of Bahawalpur, Pakistan, for providing necessary facilities, materials, and guidance. The authors would also like to thank NIBGI for LC-ESI-MS2 analysis facility.
CONFLICT OF INTEREST
The authors declare no conflicts of interest.
ETHICAL APPROVAL
The study was conducted after the approval from the Board of Advance Study and Research (BASR), reference no. 496/AS&RB and institutional ethics committee; Faculty of pharmacy and Alternative Medicines, The Islamia University, Bahawalpur, the reference no. is 122–2021-/PHEC.
Open Research
DATA AVAILABILITY STATEMENT
The data that support the findings of this study are available from the corresponding author upon reasonable request.


