Kappa free light chain index as a diagnostic biomarker in multiple sclerosis: A real-world investigation
Abstract
Kappa free light chain (KFLC) index, a measure for intrathecal production of free kappa chains, has been increasingly recognized for its diagnostic potential in multiple sclerosis (MS) as a quantitative alternative to IgG oligoclonal bands (OCBs). Our objective was to investigate the sensitivity, specificity, and overall diagnostic accuracy of KFLC index in MS. KFLC index was prospectively determined as part of the diagnostic workup in patients with suspected MS (n = 327) between May 2013 and February 2020. Patients with clinically isolated syndrome (CIS), radiologically isolated syndrome (RIS), and MS had markedly higher KFLC index (44.6, IQR 16–128) compared with subjects with other neuro-inflammatory disorders (ONID) and symptomatic controls (SC) (2.19, IQR 1.68–2.98, p < 0.001). KFLC index had a sensitivity of 0.93 (95% CI 0.88–0.95) and specificity of 0.87 (95% CI 0.8–0.92) to discriminate CIS/RIS/MS from ONID and SC (AUC 0.94, 95% CI 0.91–0.97, p < 0.001). KFLC index and intrathecal fraction (IF) KFLC had similar accuracies to detect MS. Treatment with disease-modifying therapy (DMT) did not influence the level of KFLC index and it was not affected by demographic factors or associated with degenerative or inflammatory biomarkers in cerebrospinal fluid (CSF). KFLC index in MS diagnostics has methodological advantages compared to OCB and is independent to subjective interpretation. Moreover, it is an attractive diagnostic tool since the diagnostic specificity and sensitivity of KFLC index are similar with that of OCBs and KFLCIF and better than for IgG index. We show that KFLC index was influenced neither by DMT nor by demographic factors or other inflammatory or degenerative processes in MS as determined by biomarkers in CSF.
Abbreviations
-
- ADEM
-
- acute disseminated encephalomyelitis
-
- AQP4
-
- aquaporin-4
-
- AUC
-
- area under the curve
-
- CHI3L
-
- Chitinase 3-like 1
-
- CI
-
- confidence interval
-
- CIDP
-
- chronic inflammatory demyelinating polyneuropathy
-
- CIS
-
- clinically isolated syndrome
-
- CSF
-
- cerebrospinal fluid
-
- CXCL13
-
- Chemokine (C-X-C motif) ligand 13
-
- DIT
-
- dissemination in time
-
- DMT
-
- disease-modifying therapy
-
- EDSS
-
- Expanded Disability Status Scale
-
- ELISA
-
- enzyme-linked immunosorbent assay
-
- GFAP
-
- glial fibrillary acidic protein
-
- IEF
-
- isoelectric focusing
-
- IF
-
- intrathecal fraction
-
- IgG
-
- immunoglobulin G
-
- KFLC
-
- kappa free light chains
-
- MOGAD
-
- myelin oligodendrocyte glycoprotein associated disorder
-
- MS
-
- multiple sclerosis
-
- NMOSD
-
- neuromyelitis optica spectrum disease
-
- OCB
-
- oligoclonal bands
-
- ONID
-
- other neuro-inflammatory diseases
-
- PPMS
-
- primary progressive MS
-
- QAlb
-
- albumin quotient
-
- RIS
-
- radiologically isolated syndrome
-
- RRMS
-
- relapsing-remitting MS
-
- SC
-
- symptomatic controls
-
- SPMS
-
- secondary progressive MS
1 INTRODUCTION
Cerebrospinal fluid (CSF) analysis is an important part of the diagnostic workup of multiple sclerosis (MS) (Arrambide & Tintore, 2016). Assessment of paired CSF and plasma/serum samples for oligoclonal immunoglobulin G (IgG) bands (OCBs) using isoelectric focusing (IEF) or agarose gel electrophoresis combined with either silver staining or western blotting is the single most well-studied and therefore most important CSF diagnostic test in MS (Andersson et al., 1994; Freedman et al., 2005; Stangel et al., 2013). While not specific for MS, the presence of intrathecal IgG synthesis is strongly suggestive of the diagnosis (Andersson et al., 1994). It has also been shown to have an important prognostic value in patients with radiologically isolated syndrome (RIS) and clinically isolated syndrome (CIS) to predict progression to definite MS (Kuhle et al., 2015; Tintoré et al., 2008), with intrathecal IgM production predicting both conversion and future relapses (Pfuhl et al., 2019; Sola et al., 2011). CSF assessment has gained increasing importance since presence of OCBs was reincorporated into the 2017 revision of McDonald criteria of MS (Thompson et al., 2018). In patients with a typical CIS and clinical or magnetic resonance imaging (MRI) demonstration of dissemination in space, the presence of CSF-specific OCBs may represent dissemination in time (DIT) and therefore allow a diagnosis of MS (Thompson et al., 2018). However, IEF poses several limitations. These include time-consuming manual handling and the potential for subjective interpretation (Hassan-Smith et al., 2014). Due to these limitations, there is an unmet need for additional, more objective, and quantifiable biomarkers to improve diagnostic precision, thereby facilitating early initiation of treatment.
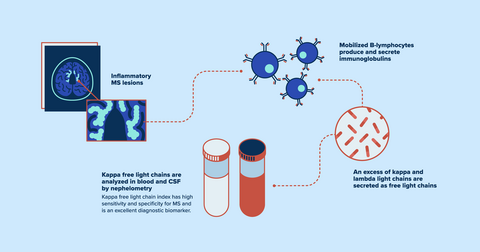
Immunoglobulin light chains are small polypeptides that serve as subunits of antibodies. During an inflammation, mobilized B-lymphocytes produce intact immunoglobulins and an excess of kappa and lambda light chains are secreted as free light chains (Presslauer et al., 2008). Determination of elevated KFLC index is a simple and quantitative method to measure the increased intrathecal immunoglobulin production that characterizes MS (Duranti et al., 2013; Kaplan et al., 2010). Different metrics have been previously utilized and compared for the determination of the intrathecal fraction (IF) of KFLC synthesis (Duell et al., 2020). Similar to previous work regarding immunoglobulin intrathecal fraction (Reiber, 1998), an alternative method was recently proposed based on a nonlinear quotient diagram with a hyperbolic reference range (Reiber et al., 2019). This nonlinear method aimed at reducing the risk of false-positive and false-negative interpretations associated with the linear index and depending on the patients’ individual albumin quotient (QAlb) value (Reiber & Peter, 2001).
The primary aim of this exploratory study was to compare the diagnostic properties of KFLC index with those of IgG OCBs and IgG index and to determine whether disease activity, disability, and therapeutic intervention influence the KFLC index, as well as to add information on whether KFLC index may complement or even replace IEF and OCB determination in clinical practice. In addition, we investigated whether KFLC index was associated with other inflammatory or degenerative biomarkers in CSF. Furthermore, we aimed to utilize the nonlinear hyperbolic reference range and compare its performance to that of KFLC index in MS diagnostics.
2 MATERIALS AND METHODS
2.1 Patients and controls
Patients (n = 343) who had prospectively determined KFLC in CSF and serum between May 2013 and February 2020 were retrospectively identified at the Department of Neurology, Sahlgrenska University Hospital, Gothenburg, Sweden. After exclusion of duplicates (n = 16), the study population comprised 327 patients: clinically/radiologically isolated syndrome (CIS/RIS [n = 20]), relapsing-remitting MS (RRMS, n = 161), primary progressive MS (PPMS, n = 19), secondary progressive MS (SPMS, n = 23), other neuro-inflammatory disease controls (ONID, n = 29, acute disseminated encephalomyelitis [ADEM] n = 1, acute unspecified myelitis n = 8, neurologic Lyme disease n = 5, chronic inflammatory demyelinating polyneuropathy [CIDP] n = 2, neuro-inflammatory disease not otherwise specified n = 7, myelin oligodendrocyte glycoprotein associated disorder (MOGAD) n = 3, aquaporin-4 (AQP4) associated neuromyelitis optica spectrum disease [NMOSD] n = 2, autoimmune encephalitis n = 1), and patients designated symptomatic controls (SC) who had MS-suspected symptoms but the diagnostic workup was negative (n = 75) (Thompson et al., 2018). All controls were pooled into one group (n = 104) and patients with CIS/RIS and MS formed the MS study group (n = 223). All patients with MS fulfilled the 2017 McDonald criteria (Thompson et al., 2018). The study was not pre-registered, no randomization was performed to allocate subjects in the study.
2.2 Analyses of intrathecal immunoglobulin synthesis
Matched CSF and serum samples were obtained during routine diagnostic workup and analyzed consecutively. Serum and CSF concentrations of KFLC were measured using the N Latex FLC kappa kit, on an Atellica NEPH 630 instrument (Siemens), following the instructions by the manufacturers. The KFLC index was calculated using the equation ([CSF KFLC/serum KFLC]/[CSF albumin/serum albumin]). CSF- and serum albumin and IgG levels were analyzed using the IGG-2 and ALBT2 Reagent cassettes on a cobas c module instrument (Roche). The CSF/serum albumin ratio was calculated as (CSF albumin [mg/L]/serum albumin [g/L]), while the IgG index was calculated as ([CSF IgG/serum IgG]/[CSF albumin/serum albumin]). Board-certified laboratory technicians, who were blinded to the clinical status, using strict procedures for quality control and run-approval, performed the analyses.
The hyperbolic reference range was calculated using Reibers formula: KFLCIF = KFLCLOC/KFLCCSF × 100 or (1 − KFLCLIM/KFLCratio) × 100 in which KFLCLOC = (KFLCratio − KFLCLIM) × KFLCserum, and KFLCLIM = 3(.27 × [QAlb + 33] − 8.2) × 103 (Reiber et al., 2019).
CSF-specific OCBs were determined using an in-house IEF method on 7.7% polyacrylamide gels and subsequent silver staining. Paired patient serum and CSF samples were run on adjacent lanes, and CSF-specific OCBs were defined as extra bands in the gamma zone, which were not present in the corresponding serum sample. For quality control, a positive CSF sample with known CSF-specific OCBs was run on each gel.
2.3 Determination of other inflammatory and degenerative biomarkers in CSF
Neurofilament light (NFL), glial fibrillary acidic protein (GFAP), and tau were measured in CSF as part of the diagnostic routine for MS investigations. NFL was analyzed using a sensitive sandwich enzyme-linked immunosorbent assay (ELISA) method (NF-light® ELISA kit; UmanDiagnostics AB; Catalog # 10-7001 CE), GFAP and tau (INNOTEST® hTAU Ag; Product # 81572) were measured by ELISA, as previously described (Novakova et al., 2018; Rosengren et al., 1994). Chemokine (C-X-C motif) ligand 13 (CXCL13) was analyzed on the discretion of the physician in a subgroup of the included subjects (n = 37). It was measured in CSF by ELISA (Human CXCL13/BLC/BCA-1 Immunoassay; R&D Systems Inc., Catalog # DCX130), according to the manufacturer's instructions. The average intra- and inter-assay coefficients of variation were ⩽10% and the LLoQ was 7.8 pg/mL.
Chitinase 3-like 1 (CHI3L1), CSF chitotriosidase, and CSF neurogranin were analyzed in a subset of MS patients (n = 20) as part of another research project (Novakova et al., 2017). CHI3L1 was analyzed in CSF with solid phase sandwich ELISA (Human Chitinase 3-like 1 Quantikine ELISA Kit; R&D Systems Inc., Catalog # DC3L10). The intra-assay coefficient of variation was below 7% and the LLoQ was 8.15 pg/mL. CSF chitotriosidase activities were measured with an in-house method (Rosén et al., 2014). CSF neurogranin was measured using an in-house ELISA (Wellington et al., 2016).
2.4 Disability and disease activity determined with MRI
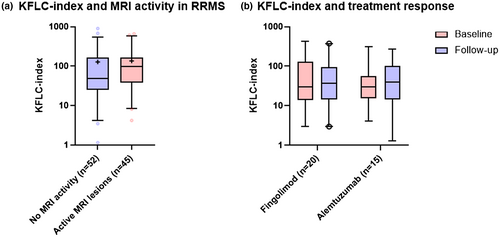
Disability was determined with Expanded Disability Status Scale (EDSS) (Kurtzke, 1983). MRI of the brain and spinal cord without and with gadolinium contrast i.v. was performed on 1.5 or 3.0 T machines, according to Swedish radiological guidelines (Vagberg et al., 2017). The recorded type and number of MS lesions were according to the review of the neuroradiologist. Since contrast enhancement on MRI is limited to a period of 6 weeks (mean 3.07 weeks) (Cotton et al., 2003), blood and CSF samples obtained during this period were considered active (n = 97).
2.5 Treatment
In a subset of MS patients treated with either fingolimod (n = 20) or alemtuzumab (n = 15), KFLC index was retrospectively analyzed in frozen samples before and 12 (fingolimod) or 24 (alemtuzumab) months after initiation of treatment.
2.6 Statistics
Statistical analyses were performed with GraphPad prism version 9.1.0 and IBM SPSS version 27 (IBM Corp. 2011). Nonparametric tests were used since KFLC index was non-normally distributed, as determined by the Shapiro–Wilk test. Adjustment for age, sex, and disease duration was performed using a quantile regression analysis. Grubbs’ test (significance level α = 0.05, two-sided) was performed to detect outliers. One significant outlier was detected and was not excluded from the analysis. Mann–Whitney test was used to compare CIS/RIS/MS and controls and to compare KFLC index in patients with and without MRI activity. Kruskal–Wallis and two-stage linear step-up procedure of Benjamini, Krieger and Yekutieli were used to compare the different disease courses. ROC curves were devised for KFLC index, OCBs ≥2, and IgG index, and the Youden index was used to identify optimal cutoff values for KFLC index and IgG index. The Matthews correlation coefficient was used to compare KFLC index and OCB determination by IEF. Statistical significance and p values in the analysis of sensitivity and specificity were determined using Fisher's exact test. 95% confidence intervals for the sensitivity and specificity of KFLC index, OCBs, IgG index, and KFLCIF (Q-FLCK > Q-LIM) to MS were computed with the Wilson–Brown method. A paired sample area difference under the ROC curves analysis was used to compare the different ROC curves. The correlation between KFLC index and other CSF biomarkers was determined by the spearman correlation coefficient. Wilcoxon matched-pairs signed rank test was used to compare KFLC index at baseline and follow-up in the two treatment groups. Reiberograms were constructed and KFLC IF was computed using the online software found on www.albaum.it (Reiber, 2020). Sample size and power calculations were performed using IBM SPSS statistics version 27 (p < 0.001, effect size 0,124, observed power 1.0 [100%]). Statistical significance was assumed at p < 0.05.
2.7 Ethics
The study material was retrieved from medical records of persons that underwent diagnostic investigation of suspected MS, recommended at the Sahlgrenska University Hospital. In addition, we used CSF data from a subgroup of patients who also participated in research projects with extended investigation of inflammatory and degenerative biomarkers (Novakova et al., 2017). They all gave informed consent. All individual data from the different sources were made anonymous to the authors by the replacement of the personal identity numbers by unique number codes for use in the present study. The study was approved by the Swedish ethical review agency (Dnr: 2020-06851).
3 RESULTS
Demographic and clinical characteristics are presented in Table 1. Overall, there was no significant age difference between the MS and the control group. However, patients with CIS/RIS and RRMS were significantly younger than patients with progressive MS (p < 0.001). Within the control group, symptomatic controls were younger than ONID patients (p < 0.001). Except for PPMS, the proportion of women were higher than men in all subgroups. Age, sex, and disease duration did not significantly influence KFLC index levels.
| Disease group | n = 324 | Sex (female,%) |
Age (years) Mean±SD |
EDSS Median (IQR) |
S-KFLC median (IQR) | CSF-KFLC median (IQR) | KFLC index median (IQR) |
|---|---|---|---|---|---|---|---|
|
MS:
|
n = 223
|
123 (65.4)
|
41±13
|
2.0 (1.5–3.5)
|
13.1 (10.4–16.2)
|
3.12 (1–6.25)
|
44.6 (16–128)
|
|
Controls:
|
n = 101
|
68 (67.3)
|
43±14
|
NA
|
13.9 (11.3–16.3)
|
0.13 (0.09–0.23)
|
2.19 (1.68–2.98)
|
- Abbreviations: CIS: clinically isolated syndrome; CSF: cerebrospinal fluid; EDSS: expanded disability status scale; IQR: interquartile range; KFLC: kappa free light chain; NA: not available; ONID: other neuroinflammatory diseases; PPMS: primary progressive MS; RIS: radiologically isolated syndrome; RRMS: relapsing-remitting MS; S: serum; SD: standard deviation; SPMS: secondary progressive MS.
3.1 KFLC index and disease course
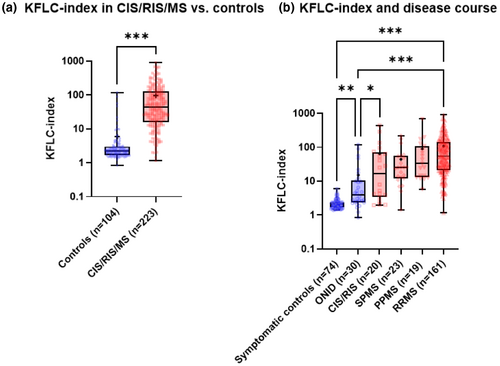
Patients with CIR/RIS/MS had markedly higher KFLC index (44.6, IQR 16–128) compared with controls (2.19, IQR 1.68–2.98, p < 0.001; Figure 1a). Patients with RRMS showed significantly higher KFLC indices compared with SC (p < 0.001), ONID (p < 0.001), CIS/RIS (p = 0.01), and SPMS (p = 0.04, Table 1, Figure 1b). KFLC index was higher in RRMS than in PPMS, reaching borderline statistical significance (p = 0.05). Most patients with elevated KFLC index (>4.6) in the ONID group had neurological Lyme disease (n = 5) and unspecified myelitis (n = 4).
3.2 Diagnostic Performance of KFLC index
We devised an ROC curve to assess the optimal cutoff value of KFLC index in our cohort and determine the sensitivity and specificity of KFLC index in comparison to OCBs and IgG index (Figure 2a). According to the Youden index, the optimal cutoff value for KFLC index in our cohort was 4.6. When pooling CIS, RIS, and MS, this resulted in a sensitivity of 0.93 (95% CI 0.88–0.95) and specificity of 0.87 (95% CI 0.8–0.92) to differentiate CIS/RIS/MS from controls (AUC 0.94, 95% CI 0.91–0.97, p < 0.001; Table 2). When excluding CIS/RIS patients from the analysis, KFLC index had a sensitivity of 0.96 (95% CI 0.92–0.98) and specificity of 0.87 (95% CI 0.79–0.92). The sensitivity of KFLC index was significantly higher compared with IgG-OCBs and IgG index (p < 0.001). The specificity of KFLC index was marginally lower than that of OCBs ≥2 (0.89, AUC 0.88, 95% CI 0.84–0.93, p < 0.001). The AUC for KFLC index was significantly higher than both OCB and IgG index (p < 0.001). There was no significant difference between the AUCs of OCB and IgG index. An ROC curve of KFLC index to detect patients with OCBs ≥2 resulted in an AUC of 0.98 (95%CI 0.97–0.99, p < 0.001, Figure 2b). Using the cutoff value of >4.6, the sensitivity of KLFC index to detect patients with OCBs ≥2 was 0.97 and the specificity was 0.86. The Matthews correlation coefficient between KFLC index and OCBs was 0.85 (p < 0.001). KFLC index was elevated in 12/22 (54.5%) of OCB-negative MS patients. Only three MS patients had ≥2 OCBs and normal KFLC index. CSF KFLC had an AUC of 0.91 (95% CI 0.87–0.95, p < 0.001).

| Biomarker | Optimal cutoff value | Sensitivity (95% CI) | Specificity (95% CI) | p value | Accuracy | PPV | NPV | AUC (95% CI) |
|---|---|---|---|---|---|---|---|---|
| KFLC index | >4.6 | 0.93 (0.88–0.95) | 0.87 (0.8–0.92) | <0.001 | 0.91 | 0.93 | 0.87 | 0.94 (0.91–0.97) |
| IgG-OCBs | ≥2 | 0.88 (0.83–0.91) | 0.89 (0.81–0.94) | <0.001 | 0.88 | 0.93 | 0.80 | 0.88 (0.84–0.93) |
| IgG index | >0.53 | 0.85 (0.79–0.88) | 0.77 (0.68–0.84) | <0.001 | 0.81 | 0.87 | 0.71 | 0.88 (0.84–0.92) |
| FLCKIF | — | 0.96 (0.92–0.98) | 0.82 (0.73–0.88) | <0.001 | 0.91 | 0.92 | 0.90 | 0.94 (0.90–0.97) |
- Abbreviations: AUC: area under the curve; IgG: immunoglobulin G; KFLC: kappa free light chain; KFLCIF: KFLC intrathecal fraction; NPV: negative predictive value; OCB: oligoclonal bands; PPV: positive predictive value.
3.3 KFLC index and the hyperbolic reference range have similar overall diagnostic accuracies
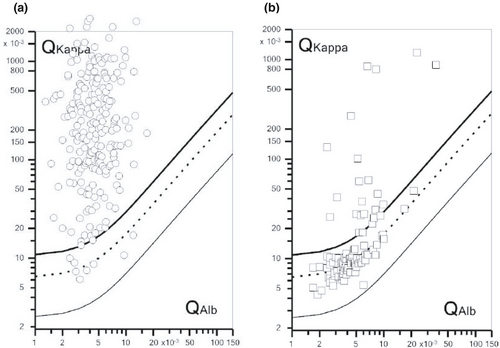
In the MS study group, 214 (96%) subjects showed KFLCIF >0%, whereas nine (4%) subjects did not (Figure 3a). Since 16 (7.2%) patients in the MS study group had normal KFLC index, this means that seven additional MS patients had increased intrathecal Ig production according to KFLCIF. In controls (SC and ONID, Figure 3b), 19/104 (18.3%) exhibited KFLCIF >0% (SC-3; ONID-19), whereas 14/104 (13.5%) exhibited KFLC index >4.6 (SC-1; ONID-13). KFLCIF showed an AUC of 0.94 (95% CI 0.90–0.97, p < 0.001), which was similar to the AUC obtained for KFLC index, and the sensitivity and specificity of KFLCIF were 0.96 (95% CI 0.92–0.97) and 0.82 (95% CI 0.73–0.88), respectively. When excluding CIS/RIS patients from the analysis, KFLCIF had a sensitivity of 0.98 (95% CI 0.95–0.99) and specificity of 0.82 (95% CI 0.73–0.87) to detect MS.
3.4 Proposed reference intervals for using KFLC index as a screening test for intrathecal immunoglobulin production in MS
Only 2/91 (2%) patients with KFLC index values <3.4 had OCBs, whereas 164/165 (99%) patients with KFLC index values >19.5 had OCBs. In the group of patients with KFLC index values between 3.4 and 19.5, 42/71 (59%) had OCBs. In the subgroup of patients with KFLC index >19.5, five patients did not have MS (Table 3). Three had neurological Lyme disease, one had acute unspecified myelitis, and one had unspecified encephalitis. In the subgroup of patients with KFLC index <3.4, eight patients had CIS/RIS/MS, of which five had CIS/RIS, two had RRMS, and one had SPMS (Table 3). In the subgroup of patients with KFLC index values 3.4–19.5, four patients without MS had OCBs, of which two had neurological Lyme disease, one had acute unspecified myelitis, and one had autoimmune encephalitis. In the same subgroup, 17 CIS/RIS/MS patients did not have OCBs. Of these, three had CIS/RIS, one had PPMS, three had SPMS, and 10 had RRMS.
| KFLC index reference interval | Not MS | CIS/RIS | MS | |||
|---|---|---|---|---|---|---|
| No OCBs | Pos OCBs | No OCBs | Pos OCBs | No OCBs | Pos OCBs | |
| <3.4 | 81/83 (97.6%) | 2/83 (2.4%) | 5/5 (100%) | 0/5 (0%) | 3/3 (100%) | 0/3 (0%) |
| 3.4–19.5 | 12/16 (75%) | 4/16 (25%) | 3/5 (60%) | 2/5 (40%) | 14/50 (28%) | 36/50 (72%) |
| >19.5 | 0/5 (0%) | 5/5 (100%) | 0/10 (0%) | 10/10 (100%) | 1/150 (0.7%) | 149/150 (99.3%) |
- Abbreviations: CIS: clinically isolated syndrome; KFLC- kappa free light chains; MS: multiple sclerosis; OCB: oligoclonal bands; Pos: positive (≥2); RIS: radiologically isolated syndrome.
3.5 KFLC index correlated with IgG index but not with other inflammatory or degenerative CSF biomarkers
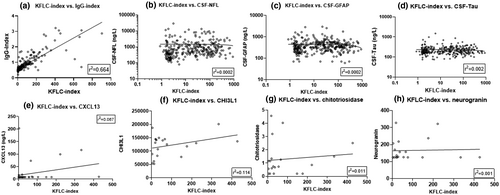
KFLC index highly correlated with IgG index (n = 324, Spearman ρ = 0.868, r2 = 0.664, p < 0.001, Figure 4a) but did not correlate with NFL (n = 324), GFAP (n = 321), tau (n = 292), CXCL13 (n = 37), CHI3L1 (n = 20), chitotriosidase (n = 20), or neurogranin (n = 20) (Figure 4b–h, respectively).
3.6 No correlation between KFLC index and disability, or activity on MRI
KFLC index did not show any significant difference between RRMS patients who had contrast-enhancing lesions on MRI at the time of sampling compared with patients who did not exhibit signs of MRI activity (Figure 5a). KFLC index did not correlate with the EDSS score at the time of presentation.
3.7 KFLC index in patients with RIS/CIS and risk for a second demyelinating event
Of the patients in our cohort with RIS/CIS (n = 20), only four had a second demyelinating event and thus converted to RRMS (mean follow-up time 29 months, range 17–67). The median KFLC index in patients who converted to RRMS was 116.1 (IQR 42.9–365) while in those who did not convert, median KFLC index was 4.75 (IQR 2.67–51, p = 0.02). The median time in months to a second demyelinating event was 13.5 (IQR 7.75–21.5).
3.8 No effect on KFLC index from disease-modifying treatment
In an analysis before and after 12 (fingolimod) or 24 (alemtuzumab) months after treatment, RRMS patients treated with fingolimod (n = 20) or alemtuzumab (n = 15) did not demonstrate any difference in KFLC index (Figure 5b).
4 DISCUSSION
We report real-world data on the diagnostic utility of KFLC index in the clinical practice of MS from a large, single-center cohort. All data were collected prospectively between 2013 and 2020 and were obtained and analyzed retrospectively. We confirm KFLC index as a highly useful diagnostic biomarker in MS. In accordance with previous reports, our findings suggest that KFLC index has higher sensitivity than OCBs to discriminate CIS/RIS/MS patients from controls and comparable specificity (Christiansen et al., 2018; Desplat-Jégo et al., 2005; Duell et al., 2020; Duranti et al., 2013; Leurs et al., 2020; Passerini et al., 2016; Pieri et al., 2017; Presslauer et al., 2008). Furthermore, we confirm that KFLC index has high diagnostic accuracy to predict intrathecal immunoglobulin synthesis via IEF (Süße et al., 2018) and that KFLC index may contribute to the identification of OCB-negative MS patients (Ferraro et al., 2020).
As the relation of KFLC quotient to QAlb is hypothetically not constant, the index may not be constant either. Therefore, statistics with the relative index values may be biased and could be replaced by the QAlb-related intrathecal fraction of KFLC.
Although KFLCIF showed slightly higher sensitivity than KFLC index to detect MS, it had lower specificity, and the overall diagnostic accuracy (AUC) was identical. We were thus unable to confirm in our cohort previous reports about the superiority of KFLCIF over the linear index in MS diagnostics (Schwenkenbecher et al., 2019; Süße et al., 2020). Determination of KFLCIF has the advantage of high sensitivity to detect intrathecal Ig production as well as the consideration of the difference in molecular sizes between the free kappa chain and albumin using a nonlinear relation of KFLC influx into the CSF relative to the QAlb. However, our analyses focused on the diagnostic accuracy to detect MS in a real-world cohort. This may explain the lack of superiority, as the specificity of KFLCIF is lower compared to the linear index. It remains therefore to be determined which method is the most appropriate for use in routine clinical practice.
We show that KFLC index seemed essentially unaffected by other pathological processes in MS as determined by degenerative and inflammatory biomarkers in CSF. It was also independent of demographic factors, disease activity, disease severity, and of treatment with DMT. Thus, KFLC index was not associated with markers of inflammatory disease activity such as contrast-enhancing lesions on MRI or levels of CXCL13, CHI3L1, chitotriosidase, and neurogranin in CSF. Neither did we find a correlation with concurrent disability status as determined by EDSS, nor with degenerative biomarkers such as NFL, GFAP, or tau in CSF. Moreover, DMT seemed not to influence KFLC index. Fingolimod influences the regress of lymphocytes from secondary lymphoid organs, thereby reducing the amount of circulating lymphocytes. Although the effect from fingolimod on B-cell function is less studied, it seems to influence B-cell migration but has less effect on the Ig production (Blumenfeld-Kan et al., 2019). Alemtuzumab is a monoclonal antibody that belongs to the immune-reconstitution therapies of MS. A short course of alemtuzumab i.v. causes T- and B-cell depletion but the B-cell count usually normalizes within 6 months. There is no obvious effect from alemtuzumab on intrathecal Ig production, but we cannot rule out that determination of KFLC index years after alemtuzumab treatment may reveal a significant decrease. These findings support the hypothesis that KFLC index does not reflect inflammatory disease activity or degeneration, but only the intrathecal production of immunoglobulins in an oligoclonal fashion. This diagnostic sign of MS seems to be relatively independent from other pathological processes. Interestingly however, KFLC levels in blood were previously shown to decrease in response to treatment with corticosteroids in patients with an acute MS relapse (Konen et al., 2020). It would therefore be valuable to validate this finding and confirm whether KFLC levels in blood can be used to monitor acute relapse therapy response to steroids. In another study, salivary levels of KFLC were significantly higher in patients with an active MS relapse (n = 55) compared with healthy controls (n = 40), and KFLC concentrations decreased as a result of treatment with DMTs (Lotan et al., 2020). Although RRMS had higher KFLC index than other phenotypes of MS, we were not able to show that KFLC index decreased in response to treatment with alemtuzumab or fingolimod. The same study reported a correlation of salivary KFLC levels with contrast-enhancing lesions on MRI, but in our study, levels of KFLC index did not correlate with MRI activity. We have previously reported that immunosuppressive treatment did not influence OCBs but the number of bands tended to change over time when analyzed longitudinally (Axelsson et al., 2013). However, in a highly active MS case, autologous hematopoietic stem-cell transplantation (AHSCT) decreased the number of OCBs (Lycke & Axelsson, 2020), and one study reported the disappearance of OCBs in the CSF after cladribine treatment (Rejdak et al., 2019). In addition, it has been previously demonstrated that natalizumab substantially modulates both intrathecal polyclonal and oligoclonal IgG production (Mancuso et al., 2014). Thus, the effect from DMTs on OCBs is contradictory, and since intrathecal KFLCs are a byproduct of immunoglobulin production, further studies on the influence from DMTs on KFLC index are warranted.
Important differential diagnoses to MS are other neuro-inflammatory CNS diseases. We found high KFLC index and OCBs in neurological Lyme disease and neurological sarcoidosis while NMOSD and MOGAD had low KFLC index. In our cohort, we had two patients with AQP4 seropositive NMOSD and three patients with positive anti-MOG antibodies. The KFLC index values in this patient group ranged from 2.5 to 6.6. None had OCBs. Thus, patients with NMOSD and MOGAD are not likely to have high KFLC index values, certainly not in the range that is typical for MS. Similar results were shown in a study including eight patients with NMOSD, who had significantly lower KFLC index than the MS group (Cavalla et al., 2020). As these conditions are important differential diagnoses to MS, it would be desirable to explore KFLC indices in larger cohorts of neuro-inflammatory CNS diseases.
Limitations to our study are the absence of longitudinal data and the limited number of other neuro-inflammatory diagnoses as these conditions often are the critical differential diagnoses of MS. However, this was an effect of using real-world data obtained from diagnostic investigations over almost 7 years. In addition, specificity values with respect to ONID should be validated in future larger cohorts since the number of these cases was low in our study.
We conclude that KFLC index above 19.5 indicate with very high certainty the presence of OCBs ≥2, whereas values below 3.4 rule-out the presence of OCBs ≥2. Accordingly, we suggest that KFLC index could be used as a screening method, in which values between 3.4 and 19.5 lead to a complementary determination of OCBs by IEF. As the presence of OCBs is now included in the McDonald criteria for DIT (Thompson et al., 2018), and since KFLC index values >19.5 are highly indicative of the presence of OCBs, we believe that such KFLC levels should be considered as a valid alternative to OCBs for fulfilment of the criterion for DIT.
In summary, KFLC index in MS diagnostics has methodological advantages compared to OCB and is independent of subjective interpretation. Moreover, it is an attractive diagnostic tool since the overall diagnostic accuracy of KFLC index is better than for both OCBs and IgG index and did not improve when KFLCIF was calculated using the nonlinear hyperbolic reference range. We show that KFLC index was influenced neither by DMT nor by demographic factors or other inflammatory/degenerative processes in MS as determined by biomarkers in CSF.
ACKNOWLEDGMENTS
The study was supported by grants from the Swedish State Support for Clinical Research (ALFGBG-722081), Regional FoU grant Västra Götalandsregionen (260 101), NEURO Sweden, NEURO Gothenburg, Edith Jacobsons Foundation, and Helena Ahlin's Foundation. KB is supported by the Swedish Research Council (No. 2017-00915), and the Swedish state under the agreement between the Swedish Government and the County Councils, the ALF-Agreement (No. ALFGBG-715986). HZ is a Wallenberg Scholar supported by grants from the Swedish Research Council (No. 2018-02532), the European Research Council (No. 681712), Swedish State Support for Clinical Research (No. ALFGBG-720931), the Alzheimer Drug Discovery Foundation (ADDF) (No. 201809-2016862), the AD Strategic Fund and the Alzheimer's Association (No. ADSF-21-831376-C, No. ADSF-21-831381-C, and No. ADSF-21-831377-C), the Olav Thon Foundation, the Erling-Persson Family Foundation, Stiftelsen för Gamla Tjänarinnor, Hjärnfonden, Sweden (No. FO2019-0228), the European Union’s Horizon 2020 research and innovation programme under the Marie Skłodowska-Curie Grant agreement No 860197 (MIRIADE), and the UK Dementia Research Institute at UCL.
All experiments were conducted in compliance with the ARRIVE guidelines.
CONFLICTS OF INTEREST
IR has nothing to declare. SR has nothing to declare. MA has received compensation for lectures and/or advisory boards from Biogen, Genzyme, and Novartis. LN has received honoraria for lecture from Biogen, Novartis, and Teva, and for advisory boards from Merck. KB has served as a consultant, at advisory boards, or at data monitoring committees for Abcam, Axon, Biogen, JOMDD/Shimadzu. Julius Clinical, Lilly, MagQu, Novartis, Prothena, Roche Diagnostics, and Siemens Healthineers, and is a co-founder of Brain Biomarker Solutions in Gothenburg AB (BBS), which is a part of the GU Ventures Incubator Program, all unrelated to the work presented in this paper. HZ has served at scientific advisory boards and/or as a consultant for Alector, Eisai, Denali, Roche Diagnostics, Wave, Samumed, Siemens Healthineers, Pinteon Therapeutics, Nervgen, AZTherapies, CogRx, and Red Abbey Labs; has given lectures in symposia sponsored by Cellectricon, Fujirebio, Alzecure, and Biogen; and is a co-founder of Brain Biomarker Solutions in Gothenburg AB (BBS), which is a part of the GU Ventures Incubator Program (outside submitted work). JL has received travel support and/or lecture honoraria and has served on scientific advisory boards for Biogen, Novartis, and Sanofi Genzyme; and has received unconditional research grants from Biogen and Novartis.
AUTHORS’ CONTRIBUTIONS
Igal Rosenstein: conceived and designed the study; collected the data; performed the analysis; interpreted the data; and wrote the manuscript. Sofia Rasch: major role in data acquisition; revised the manuscript for important intellectual content. Markus Axelsson: major role in data acquisition; revised the manuscript for important intellectual content. Lenka Novakova: major role in data acquisition; revised the manuscript for important intellectual content. Kaj Blennow: conceived the study; major role in data acquisition; interpreted the data; wrote the manuscript; revised the manuscript for important intellectual content. Henrik Zetterberg: conceived the study; major role in data acquisition; interpreted the data; wrote the manuscript; revised the manuscript for important intellectual content. Jan Lycke: conceived and designed the study; interpreted the data; wrote and revised the manuscript for important intellectual content.
Open Research
DATA AVAILABILITY STATEMENT
The data that support the findings of this study are available from the corresponding author upon reasonable request.


