Hypoxia interferes with aryl hydrocarbon receptor pathway in hCMEC/D3 human cerebral microvascular endothelial cells
Abstract
The expression of aryl hydrocarbon receptor (AhR) transcription factor was detected at transcript level in freshly isolated human brain microvessels and in the hCMEC/D3 human cerebral microvascular endothelial cell line. Recent studies have demonstrated that AhR pathway is able to crosstalk with other pathways such as hypoxia signaling pathway. Therefore, we used the hCMEC/D3 cell line to investigate the potential crosstalk between AhR and hypoxia signaling pathways. First, we performed two different hypoxia-like procedures in hCMEC/D3 cells; namely, exposition of cells to 150 μM deferoxamine or to glucose and oxygen deprivation for 6 h. These two procedures led to hypoxia-inducible factor (HIF)-1α and HIF-2α proteins accumulation together with a significant induction of the two well-known hypoxia-inducible genes VEGF and GLUT-1. Both HIF-1α and -2α functionally mediated hypoxia response in the hCMEC/D3 cells. Then, we observed that a 6 h exposure to 25 nM 2,3,7,8-tetrachlorodibenzo-p-dioxin, a strong AhR ligand, up-regulated CYP1A1 and CYP1B1 expression, and that this effect was AhR dependent. Regarding AhR and hypoxia crosstalk, our experiments revealed that an asymmetric interference between these two pathways effectively occurred in hCMEC/D3 cells: hypoxia pathway interfered with AhR signaling but not the other way around.
We studied the putative crosstalk of AhR and hypoxia pathways in hCMEC/D3 human cerebral microvascular endothelial cells. While hypoxia decreased the expression of the two AhR target genes CYP1A1 and CYP1B1, AhR activation results in no change in hypoxia target gene expression. This is the first sign of AhR and hypoxia pathway crosstalk in an in vitro model of the human cerebral endothelium.
Abbreviations used
-
- AhR
-
- aryl hydrocarbon receptor
-
- ARNT
-
- aryl hydrocarbon nuclear translocator
-
- BBB
-
- blood–brain barrier
-
- CYP
-
- cytochrome P450
-
- DFO
-
- deferoxamine mesylate
-
- GLUT-1
-
- glucose transporter 1
-
- HIF
-
- hypoxia-inducible factor
-
- HRE
-
- hypoxia-responsive element
-
- OGD
-
- oxygen and glucose deprivation
-
- TCDD
-
- 2,3,7,8-tetrachlorodibenzo-p-dioxin
-
- VEGF
-
- vascular endothelial growth factor A
-
- XRE
-
- xenobiotic-responsive element
The blood–brain barrier (BBB) is a crucial physical and biochemical barrier between brain parenchyma and the systemic circulation aiming to maintain brain homeostasis. Composed primarily of endothelial cells joined by extensive junctional complexes, the BBB is a strong physical barrier (Abbott et al. 2010). The BBB is also a selective biochemical barrier: specific transport proteins and enzymes, such as cytochrome P450 (CYPs), are expressed in endothelial cells where they act in concert to control brain permeability to endogenous and foreign compounds (Decleves et al. 2011). In freshly isolated human brain microvessels, CYP1B1 was established as the main CYP expressed at both transcriptomic and proteomic levels (Dauchy et al. 2008; Shawahna et al. 2011). Interestingly, CYP1B1 is a historically well-known target gene of aryl hydrocarbon receptor (AhR) regulation pathway and high levels of AhR transcripts were detected in freshly isolated human brain microvessels (Dauchy et al. 2008). TCDD (2,3,7,8-tetrachlorodibenzo-p-dioxin, dioxin), the prototypical AhR ligand, strongly increased CYP1B1 transcripts expression in the hCMEC/D3 human cerebral microvascular endothelial cells (Dauchy et al. 2009). These data are in accordance with two different studies conducted in rats showing that exposure to various AhR ligands up-regulated Cyp1b1 expression in cerebral cortex microvessels (Wang et al. 2010; Jacob et al. 2011).
AhR is a cytosolic ligand-dependent transcription factor belonging to the bHLH-PAS (basic helix-loop-helix/Per-Arnt-Sim) superfamily that responds to many endogenous and exogenous chemicals. The best known exogenous ligands for AhR are ubiquitous environmental pollutants such as polycyclic aromatic hydrocarbons or halogenated aromatic hydrocarbons like TCDD (Denison et al. 2011). Following ligand binding, the ligand/AhR complex translocates into the nucleus where it heterodimerizes with its partner AhR nuclear translocator (ARNT). The resulting ligand/AhR/ARNT complex binds to a specific promoter sequence called the xenobiotic responsive element (XRE), thus triggering the transcription of a large battery of target genes producing diverse biological and/or toxicological effects. Among the best known AhR target genes are those encoding phase I xenobiotic metabolizing enzymes (i.e., CYP1A1/1B1) (Denison et al. 2011).
In an effort to better elucidate AhR signaling, recent studies have shown that AhR multiple effects result from the canonical AhR-ARNT-XRE signaling but also from the ability of AhR to interact and crosstalk with other signaling pathways. In particular, AhR pathway has been described to interact with hypoxia signaling pathway because of their shared partner ARNT (Puga et al. 2009; Denison et al. 2011).
Also named hypoxia-inducible factor 1-β (HIF-1β), ARNT is a member of the bHLH-PAS family identified as the required binding partner for HIF-1α and -2α, both crucial transcription factors mediating the cellular adaptive response to hypoxia.
The protein stability of HIF-α subunits is regulated by cellular oxygen level: HIF-α subunits undergo post-translational modifications that trigger their protein degradation under normoxia. In cells, transcription and translation of HIF-α subunits are constitutive and continuous. However, under normoxia, HIF-α subunits undergo hydroxylation of one (or both) of the two highly conserved proline residues in an oxygen-dependent degradation domain by propyl hydroxylase domain-containing enzymes. This hydroxylation mediates interaction of HIF-α subunits with the von Hippel Lindau tumor suppressor protein (pVHL), their subsequent ubiquitination and proteasomal degradation. The propyl hydroxylase domains require oxygen as a substrate as well as iron (Fe2+) as cofactor for hydroxylation (Weidemann and Johnson 2008; Brocato et al. 2014). Thus, while HIF-α subunits are degraded under normoxia, hypoxic condition triggers their accumulation and nuclear localization. Once in the nucleus HIF-α subunit heterodimerizes with ARNT and the resulting HIF-1 complex binds to specific promoter sequences called hypoxia-responsive elements (HRE) subsequently enhancing the transcription of many target genes such as vascular endothelial growth factor A (VEGF) or glucose transporter 1 (GLUT-1) (Semenza 2010). Regarding brain, emerging evidences suggest hypoxia as a contributing factor to the development of neurodegenerative diseases (Quaegebeur and Carmeliet 2010). Hypoxia is also associated with BBB disruption resulting in an increased permeability, subsequent edema and tissue damage (Kaur and Ling 2008).
To date, crosstalk between hypoxia and AhR signaling pathways has never been investigated in brain endothelial cells. Moreover, although HIF-1α is ubiquitously expressed, HIF-2α expression is restricted to certain cell types, especially endothelial cells (Skuli and Simon 2009). Despite the fact that HIF-2α is expressed in endothelial cells of brain vessels (Tian et al. 1997), its putative interaction with AhR pathway has never been elucidated. Considering that both hypoxia and AhR pathways have been evidenced at the BBB, we used the hCMEC/D3 human cerebral microvascular endothelial cell line to investigate crosstalk between AhR and hypoxia (HIF-1α and HIF-2α) pathways.
Materials and methods
Reagents and equipments
The human cerebral microvascular endothelial cells/clone D3 (hCMEC/D3) were kindly provided by Dr P-O. Couraud (INSERM U1016 UMR 8104, Institut Cochin, Paris, France). The hCMEC/D3 cells were grown in EBM-2 medium (Lonza, Switzerland) supplemented with ascorbic acid, hydrocortisone, basic fibroblast growth factor (Sigma-Aldrich, Saint Quentin Fallavier, France), fetal bovine serum (PAA, Vélizy-Villacoublay, France), and hepes (Invitrogen, Cergy-Pontoise, France). Cells were grown on six-well plates (Corning, France) coated with rat tail collagen type-I (BD Biosciences, Le Pont-De-Claix, France).
2,3,7,8-tetrachlorodibenzo-p-dioxin (TCDD, dioxin) was obtained from LGC Promochem (Molsheim, France), deferoxamine mesylate (DFO) from Sigma-Aldrich and GasPak™ Pouch System from BD Biosciences.
SiRNA for HIF-1α (Silencer® Select siRNA reference s6539) and for HIF-2α (Silencer® Select siRNA reference s4698) were purchased from Ambion (Applied Biosystems, Courtaboeuf, France). AhR Stealth RNAi™ siRNA, lipofectamine RNAiMAX transfection reagent, and RT-PCR reagents were purchased from Invitrogen (Invitrogen). Control-siRNA (Neg. siRNA AF 488, reference 1027284) and RNA extraction kits were purchased from Qiagen (Qiagen, Courtaboeuf, France). Primers were synthesized by Invitrogen Life Technologies (Invitrogen). The Power SYBR Green PCR Master Mix was from Applied Biosystems (Applied Biosystems). Antibodies and supplies used for western blotting were as follows: polyclonal rabbit anti-HIF-1α (Novus Biologicals, Cambridge, UK), polyclonal rabbit anti-HIF-2α (Novus Biologicals), polyclonal rabbit anti-AhR (Santa Cruz, Germany), monoclonal mouse anti-β-actin (Abcam, Cambridge, UK), horseradish peroxidase-conjugated monkey anti-mouse, and horseradish peroxidase-conjugated goat anti-rabbit secondary antibodies (Amersham, Buckinghamshire, UK). Proteins were detected using Immun-Star Western C Chemiluminescent Kit (Bio-Rad, Marnes-la-Coquette, France).
Other chemicals and reagents were purchased from Sigma-Aldrich or Invitrogen. Equipment used were as follows: a nucleic acid spectrophotometer (Nanodrop ND-1000; NanoDrop Technologies, Wilmington, DE, USA), a programmable thermal cycler (PTC-100 programmable thermal controller, MJ research Inc.,Waltham, MA, USA), and a 7900 HT Real-Time PCR Detection System (Applied Biosystems, Foster City, CA, USA).
Cell culture, TCDD exposure, and hypoxia-like procedures
The hCMEC/D3 cells were plated out in six-well plates coated with type I collagen and grown at 37°C in a humidified atmosphere of 5% CO2. The cells were used at passages 27–34 for all experiments. For TCDD exposure, confluent cells were treated with control medium or with medium containing 25 nM TCDD in dimethylsulfoxide (0.016% v/v) for 6 h. Regarding hypoxia, two different hypoxia-like procedures were carried out to induce a cellular adaptive response to hypoxia: an oxygen and glucose deprivation (OGD) condition or a DFO exposure. The OGD model has been widely used to mimic the environmental changes observed during cerebral ischemia injury (Semenza 2007). To induce OGD condition, cells were incubated in glucose-free Dulbecco's modified Eagle's medium containing 5% fetal bovine serum and 1% sodium pyruvate and were placed in the GasPak™ pouch system according to the manufacturer's instructions. The GasPak™ pouch system was kept in a humidified atmosphere of 5% CO2 for 6 h and allowed to generate oxygen concentration close to anoxia. In each experiment, cultures exposed to OGD condition were compared with appropriate controls supplied with Dulbecco's modified Eagle's medium containing glucose and maintained in standard incubation conditions.
The iron chelator DFO elicits HIF-α subunits protein stabilization so that DFO is commonly used to induce a chemical hypoxia. Confluent cells were treated with 150 μM DFO or with control medium (i.e., normoxic control) for 6 h. Regarding DFO procedure the results obtained are presented in the Supporting Information.
RNA interference
hCMEC/D3 cells (2.5 × 10⁵ per well) were seeded in six-well plates and allowed to attach for 2 h. They were then transfected by incubation for 48 h with 5 nM HIF1α-siRNA or 5 nM HIF2α-siRNA or 15 nM AhR-siRNA or 10 nM control-siRNA using the lipofectamine transfection reagent according to the manufacturer's protocol. Transfected and untransfected cells were then exposed to hypoxia-like procedure (150 μM DFO or OGD), to 25 nM TCDD, to 25 nM TCDD concomitantly to hypoxia or to appropriate control condition for the final 6 h.
RNA extraction and reverse transcription
Total RNA was extracted from hCMEC/D3 cells using the RNeasy Plus Mini kit according to the manufacturer's instructions. RNA concentration and purity were assessed spectrophotometrically at 260 nm using a Nanodrop® spectrophotometer; RNA integrity was assessed by electrophoresis on a 0.8% agarose gel. Total RNA was reverse transcribed into cDNA in a final volume of 20 μL. The mixture consisted of 500 ng total RNA, 500 μM of each dNTP, 10 mM dithiothreitol, 1.5 μM random hexa-nucleotide primers, 20 U RNAse in ribonuclease inhibitor, and 100 U SuperScript II reverse transcriptase (Invitrogen, Cergy-Pontoise, France). Hexamers were annealed at 25°C for 10 min, products were extended at 42°C for 30 min, and the reaction was terminated by heating to 99°C for 5 min and quick-chilling to 4°C. cDNA were stored at −80°C.
Quantitative RT-PCR

| Gene | Forward primer (5′–3′) | Reverse Primer (5′–3′) | Length (bp) | GenBank accessiona |
|---|---|---|---|---|
| TBP | TGCACAGGAGCCAAGAGTGAA | CACATCACAGCTCCCCACCA | 132 | NM_003194 |
| CYP1A1 | GGTCAAGGAGCACTACAAAACC | TGGACATTGGCGTTCTCAT | 108 | NM_000499.3 |
| CYP1B1 | TGGCTGCTCCTCCTCTTC | GGCTGGTCACCCATACAA | 107 | NM_000104.3 |
| VEGF | GGGCAGAATCATCACGAAGTG | ATTGGATGGCAGTAGCTGCG | 65 | NM_001025366.1 |
| GLUT-1 | TGCGGGAGAAGAAGGTCA | CAGCGTTGATGCCAGACA | 114 | NM_006516.2 |
- a Gene accession number at http://www.ncbi.nlm.nih.gov.
For each sample, the 2−▵▵Ct value was calculated and represents the fold change in gene expression normalized to the reference gene and relative to the internal calibrator. For graphical representation, the 2−▵▵Ct values of control samples were arbitrarily defined as 1 so that 2−▵▵Ct values of treated samples directly indicate fold-changes in the considered gene expression relative to control samples. Data are represented as means together with upper and lower limits of fold-change values. Meanwhile, the statistical analysis was performed using log-transformed values of the raw 2−▵▵Ct.
Western blot analysis
Cells were lysed for 30 min at 4°C in lysis buffer: 150 mM NaCl, 50 mM Tris–HCl pH 7.4, 1% Triton X-100, 0.5% sodium deoxycholate and protease inhibitor cocktail (Complete®, Roche Diagnostics, Meylan, France). The lysates were centrifuged at 20 000 g for 20 min at 4°C and the supernatants were stored at −80°C. Protein concentrations were assessed using the Pierce® bicinchoninic acid Protein Assay Kit (ThermoScientific, Courtaboeuf, France) with a calibration curve containing bovine serum albumin. Equal amounts of protein were separated on 8% polyacrylamide gels and electrotransferred to nitrocellulose membranes (Hybond, Amersham, UK). Non-specific binding sites were blocked by incubation overnight at 4°C with Tris base containing 0.1% Tween 20 (TBS-T 0.1%) and 5% non-fat dried milk. The membranes were immmunoblotted with primary antibodies anti-HIF-1α (dilution 1 : 500), anti-HIF-2α (dilution 1 : 500), anti-AhR (1 : 500) or β-actin (1 : 25 000) and then washed several times in TBS-T 0.1%. They were incubated with horseradish peroxidase-conjugated anti-mouse (1 : 5000) or anti-rabbit (1 : 1000) secondary antibody for 60 min at 25 °C. Chemiluminescent signals were detected using the Immun-Star Western C Chemiluminescent Kit (Bio-Rad) and acquired with the Bio-Rad ChemiDoc® XRS device (Bio-Rad). Integrated densities of bands were measured using Quantity One 4.6.9 software (Bio-Rad) and signals were normalized to the corresponding actin signals.
Statistical analysis
Prior to statistical analysis, normality was checked. Statistical analyses were done with GraphPad Prism® 4.0 software (GraphPad Software Inc., San Diego, CA, USA). The statistical comparison of fold-changes in gene expression was done with one-way anova followed by Tukey's post-test using log-transformed values. To verify conclusions, three-way anova using log-transformed values were also performed with R software version 3.01 (R Foundation for Statistical Computing, Vienna, Austria) with complementary package lmPerm using a non-parametric permutation testing (Wheeler 2010). All the tests were two-tailed and statistical significance was set at p < 0.05.
Results
HIF-1α- and HIF-2α-mediated hypoxic response in hCMEC/D3 cells
To study cellular adaptive response to hypoxia, hCMEC/D3 cells were exposed to OGD for 6 h. Western blot analysis revealed that HIF-1α and HIF-2α proteins are barely or not detectable under normoxia, whereas, as expected, 6 h exposure to OGD led to a strong accumulation of HIF-1α and HIF-2α proteins (Fig. 1a) together with a significant induction of the two well-known HIF target genes, VEGF and GLUT-1. Indeed, qPCR analysis evidenced a significant induction of both VEGF and GLUT-1 mRNA expression by 2.8- and 2.5-fold, respectively (Fig. 1c). Thus, OGD represented a suitable hypoxia model in hCMEC/D3 cells and a valuable tool to study hypoxia pathway in this cell line.
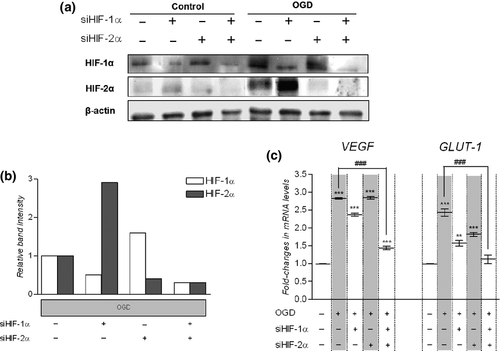
We also investigated the respective role of HIF-1α and HIF-2α in the observed induction of VEGF and GLUT-1 using small interfering RNAs. Cells were transfected with HIF1α- and/or HIF2α-siRNA to knock down either HIF-1α and/or HIF-2α expression, respectively. Untransfected and transfected cells were then submitted for 6 h to OGD or to the corresponding normoxic control condition. As revealed by western blot analysis transfection with HIF1α-siRNA strongly decreased HIF-1α protein accumulation induced by OGD (Fig. 1a). Similarly, transfection with HIF2α-siRNA prevented HIF-2α protein accumulation following OGD (Fig. 1a). Control siRNA had no significant effect on either HIF-1α or HIF-2α protein accumulation in these conditions (data not shown). Interestingly, silencing HIF-1α expression tended to increase HIF-2α protein accumulation under OGD and conversely silencing HIF-2α expression tended to increased HIF-1α protein accumulation following OGD (Fig. 1b).
Following OGD, VEGF, and GLUT-1 mRNA levels were still significantly higher in cells simply transfected with HIF1α-siRNA or with HIF2α-siRNA as compared to OGD-untreated and -untransfected cells (Fig. 1c). Yet, OGD-mediated induction of GLUT-1 mRNA expression was abolished in cells doubly transfected with HIF1α-siRNA and HIF2α-siRNA as compared to OGD-untreated and -untransfected cells. Regarding VEGF, its mRNA expression remained weakly induced following OGD in cells transfected with both HIF1α-siRNA and HIF2α-siRNA, but the induction ratio was significantly lower than that observed in untransfected cells.
Taken together, these results evidenced that both HIF-1α and HIF-2α increased the mRNA levels of VEGF and GLUT-1 under OGD in hCMEC/D3 cells. Moreover, when only one of the two HIF-α was knocked down cellular adaptive hypoxic response was maintained in hCMEC/D3 cells. Interestingly, similar results were obtained with the DFO procedure (Figure S1a–c).
Effect of TCDD treatment and AhR knockdown on CYP1A1 and CYP1B1 mRNA expression in hCMEC/D3
The effect of TCDD exposure on CYP1A1 and CYP1B1 transcript levels was measured by qPCR. A 25 nM TCDD exposure for 6 h induced CYP1A1 and CYP1B1 expression by 2.1- and 2.5-fold, respectively (Fig. 2a).
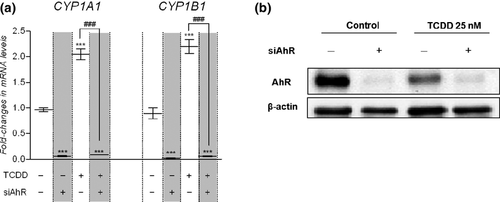
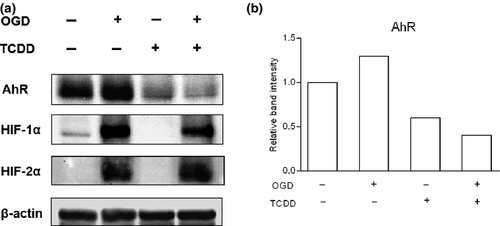
The implication of AhR in the TCDD-mediated increases in CYP1A1 and CYP1B1 expression was further evaluated using small interfering RNA against AhR (AhR-siRNA). Western blot analysis showed a strong decrease in AhR protein expression by 89 ± 9% (mean ± SEM, n = 3) in cells transfected with AhR-siRNA as compared to untransfected cells 48 h post transfection (Fig. 2b). Control-siRNA had no significant effect on AhR protein expression (data not shown). Moreover, following the TCDD exposure AhR protein expression was decreased by 59 ± 11% (mean ± SD, n = 3) in untransfected cells.
As CYP1A1 and CYP1B1 mRNA levels were no more increased by TCDD in cells transfected with AhR-siRNA (Fig. 2a), this clearly demonstrated that AhR is the main transcription pathway regulating CYP gene expression in hCMEC/D3 cells. Down-regulating AhR protein expression also dramatically reduced the basal mRNA levels of both CYP1A1 and CYP1B1. Altogether these data demonstrated that in hCMEC/D3 cells AhR is responsible for TCDD-induced increase in the expression of CYP1A1/1B1. Moreover, in the absence of exogenous ligand, AhR displays a basal activity resulting in the constitutive expression of CYP1A1 and CYP1B1.
Effect of TCDD and AhR knockdown on HIF-target genes expression in hCMEC/D3 cell
To examine the effect of AhR pathway activation on hCMEC/D3 cells adaptive response to hypoxia, cells were submitted to OGD in the presence or absence of 25 nM TCDD for 6 h. At the end of the incubation, relative VEGF and GLUT-1 transcript levels were measured by qPCR analysis.
As previously observed, mRNA expression levels of VEGF and GLUT-1 increased following OGD (Fig. 3a). TCDD alone had no effect on VEGF or GLUT-1 mRNA expression levels and simultaneous treatment with TCDD did not significantly alter the OGD-induced mRNA levels of VEGF or GLUT-1. DFO procedure also led to similar observations: simultaneous exposure to 150 μM DFO and to 25 nM TCDD did not modify the DFO-induced mRNA levels of VEGF and GLUT-1 (Figure S2). Therefore, TCDD-mediated activation of AhR did not interfere with the adaptive response of hCMEC/D3 cells to hypoxia.
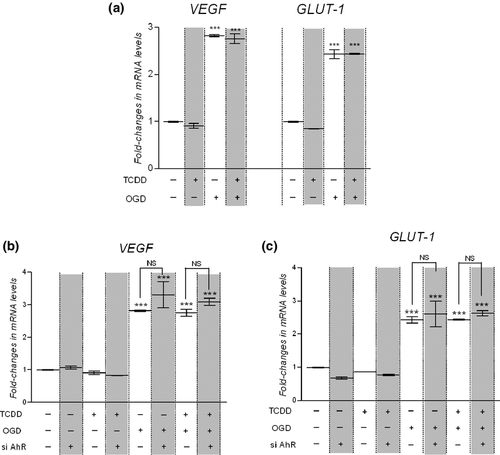
Then, we studied the effect of AhR knockdown on OGD-induced increase in VEGF and GLUT-1 mRNA levels in hCMEC/D3. Thereby untransfected cells and cells transfected for 48 h with AhR-siRNA were exposed for the last 6 h to control medium, to 25 nM TCDD, to OGD or simultaneously to 25 nM TCDD and OGD. The silencing of AhR expression in hCMEC/D3 cells did not enhance OGD-induced VEGF and GLUT-1 mRNA expression (Fig. 3b and c). These results clearly evidenced that AhR pathway did not interfere with hypoxia pathway.
Effect of hypoxia and both HIF-1α and HIF-2α silencing on AhR target genes expression in hCMEC/D3 cells
To further assess the possible interaction between hypoxia and AhR pathways, we examined the effect of hypoxia on AhR response. Following exposure of cells to 25 nM TCDD, to OGD or both for 6 h, relative CYP1A1 and CYP1B1 mRNA expression levels were assessed by qPCR analysis (Fig. 4a). As previously observed, TCDD treatment increased CYP1A1 and CYP1B1 mRNA levels. On the contrary, OGD significantly decreased the basal mRNA expression level of CYP1A1 and CYP1B1. Therefore, OGD and TCDD have opposite effects on CYP1A1 and CYP1B1 mRNA level in hCMEC/D3. After concomitant exposure to OGD and TCDD, CYP1A1 and CYP1B1 mRNA levels were significantly lower than that observed in cells exposed to TCDD alone, respectively (Fig. 4a).
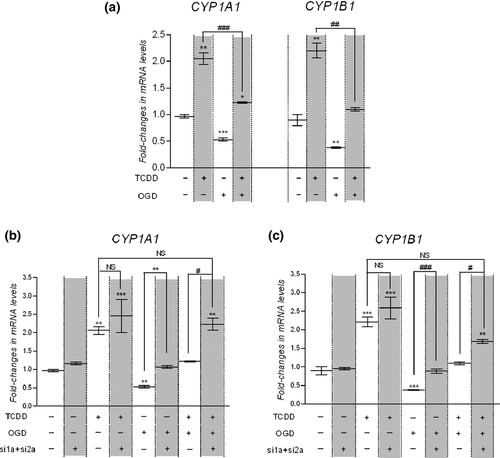
Interestingly, comparable results were obtained using DFO procedure (Figure S3). Taken together the results obtained with both hypoxia procedures clearly showed that hypoxia interfere with AhR-mediated target gene regulation in hCMEC/D3 cells.
Since both HIF-1α and HIF-2α mediate hypoxic response in hCMEC/D3 cells, we investigated to which extent HIF-1α and HIF-2α interfere with the regulation of AhR target genes using small interfering RNA. Cells were doubly transfected for 48 h with HIF1α-siRNA and HIF2α-siRNA to knock down simultaneously HIF-1α and HIF-2α expression. Untransfected and transfected cells were exposed for the last 6 h to control condition, 25 nM TCDD, OGD or simultaneously to 25 nM TCDD and OGD and mRNA levels of CYP1A1 and CYP1B1 transcripts were measured by qPCR (Fig. 4b and c). Silencing both HIF-1α and HIF-2α expression abolished the down-regulation of CYP1A1 and CYP1B1 basal expression observed under OGD. Moreover, silencing both HIF-α subunits permitted to restore AhR-dependent regulation of CYP1A1 and CYP1B1 mRNA levels under OGD so that CYP1A1 or CYP1B1 mRNA levels after concomitant exposure to OGD and TCDD were no more statistically different from those observed in untransfected cells exposed to TCDD under normoxia. These results clearly demonstrated that HIF-1α and HIF-2α factors are implicated in the interference between hypoxia and AhR pathways.
Protein expression of AhR, HIF-1α, and HIF-2α following TCDD and/or hypoxia procedure
To elucidate the level of crosstalk between HIF and AhR pathways, we performed western blot analysis for AhR, HIF-1α, and HIF-2α protein following the exposure of hCMEC/D3 cells to 25 nM TCDD, to hypoxia-like procedures or both for 6 h (Fig. 5 and Figure S4). Regarding HIF-1α and HIF-2α protein expression, western blotting analysis evidenced no significant alteration in HIF-1α and HIF-2α protein accumulation under simultaneous TCDD and hypoxia procedure as compared to hypoxia procedure alone. Likely, AhR protein expression decreased in the same magnitude in hCMEC/D3 cells exposed to TCDD alone or to TCDD concomitantly with OGD or DFO (Fig. 5 and Figure S4). These results strongly suggested that the observed interference between hypoxia and AhR pathways did not result from a modification in AhR protein expression level under hypoxia.
Discussion
Since AhR expression was only recently evidenced in both human and rodent isolated brain microvessels (Dauchy et al. 2008; Jacob et al. 2011), few experiments are available regarding AhR signaling pathway at the BBB. Besides, first experiments conducted at this interface exclusively focused on the main known aspect of AhR pathway, i.e., its implication in adaptive response following the exposure to diverse environmental pollutants. However, increasing evidence is now available showing that AhR is not only an environmental sensor but also a key regulator of physiological functions and that AhR pleiotropic effects could arise at least, in part, from its ability to crosstalk with other transcription factors (Puga et al. 2009; Denison et al. 2011). In particular, crosstalks between AhR and HIF-1α in case of their simultaneous activation have been reported in several human cell lines using different AhR ligands or hypoxia procedures. However, the obtained results were inconsistent: while some studies revealed mutual inhibition between HIF-1α and AhR pathways, others evidenced that HIF-1α activation inhibits AhR response but not the reverse [for a recent review of crosstalk between AhR and hypoxia pathways we refer the reader to (Vorrink and Domann 2014)]. To date, the potential crosstalk between AhR and hypoxia pathways remains to be elucidated in the cerebral endothelium. Therefore, and in an effort to better understand AhR signaling in cerebral endothelium we used the hCMEC/D3 human cerebral microvascular endothelial cell line to investigate the putative crosstalk between AhR and hypoxia pathways. Moreover, since HIF-2α is more prominently expressed in endothelial cells (Skuli and Simon 2009), we extended the study of AhR and hypoxia pathways interference to both HIF-1α and HIF-2α.
First, we focused on hypoxia signaling pathway in the hCMEC/D3 cells using two different hypoxia-like procedures: exposure to a simultaneous glucose and oxygen deprivation (OGD) or to the iron-chelating compound DFO for 6 h. The results obtained were very similar with both procedures. Exposing hCMEC/D3 cells to hypoxia-like conditions led to a strong accumulation of both HIF-1α and HIF-2α proteins together with a significant increase in the mRNA levels of two well-known hypoxia target genes VEGF and GLUT-1. Moreover, silencing experiments demonstrated that both HIF-1α and HIF-2α mediated cellular adaptive response to hypoxia in hCMEC/D3 cells (Fig. 1 and Figure S1).
Second, we paid attention to AhR signaling pathway. Using small interfering RNA experiments, we demonstrated here that the observed TCDD-mediated CYP1A1 and CYP1B1 up-regulation in hCMEC/D3 cells occurred through AhR. Moreover, silencing AhR expression in the absence of an exogenous ligand led to a strong down-regulation of both CYP1A1 and CYP1B1 basal mRNA levels in hCMEC/D3 cells (Fig. 2). Such a repression of CYP1A1/1B1 expression following AhR silencing has already been reported in diverse human immortalized or primary cell cultures (Zhang and Walker 2007; Yang et al. 2008; Le Vee et al. 2010). This observation is of particular interest considering the fact that CYP1B1 is the main CYP expressed at the human BBB (Dauchy et al. 2008; Shawahna et al. 2011). It also strongly supports the existence of an AhR endogenous ligand, present in the culture medium or produced by hCMEC/D3 cells, leading to AhR activation and to the resulting CYP1A1/1B1 transcription. Interestingly, tryptophan metabolites have been demonstrated to activate AhR in in vitro studies (Oberg et al. 2005; Veldhoen et al. 2009). Besides, we showed that exposing hCMEC/D3 cells to the strong AhR ligand TCDD repressed AhR protein expression (Figs 2b, 5 and Figure S4), suggesting that a putative negative feedback of AhR signaling such as the proteolytic degradation of AhR described in human cell lines and rodent tissues may also occur in hCMEC/D3 cells (Pollenz 2002; Pollenz and Buggy 2006; Hahn et al. 2009). Taken together, our results demonstrate for the first time the functionality of AhR regulation pathway in hCMEC/D3 cells. This suggests that the human cerebral endothelium could be an AhR target tissue and that targeting AhR pathway may provide new insights in its role at the BBB.
We further studied the crosstalk between AhR and hypoxia pathways in case of simultaneous activation. Given our prior in vitro findings, we considered both HIF-α subunits for further study in hCMEC/D3 and we evidenced an asymmetric interference between these two pathways: in the cerebral endothelium hypoxia interfered with AhR signaling but not the reverse (Figs 3, 4 and Figure S2, S3). Since our western blotting analysis did not evidence any modification of the TCDD-dependent proteolytic degradation of AhR under hypoxia procedures in hCMEC/D3 (Fig. 5, Figure S4), the observed interference might not result from a reduced amount of AhR protein expression under hypoxia. Looking closely, we noticed that hypoxia and AhR pathways have opposite effects on CYP1A1/CYP1B1 mRNA levels: while hypoxia decreases CYPs mRNA levels AhR up-regulates them (Fig. 4 and Figure S3). The effect of hypoxia-like conditions on CYP1B1 expression tended to be stronger compared with the effects on CYP1A1. Our data are in accordance with previous studies reporting CYP down-regulation by hypoxia. Thus, in human HepaRG cells cultured under hypoxic condition qPCR analysis revealed a down-regulation of genes encoding CYP3A4, CYP1A2, CYP2E1, and CYP2C9 (Legendre et al. 2009). Regarding CYP1A1, hypoxia significantly reduced its mRNA basal expression in human pulmonary microvascular endothelial cells and its protein expression in breast cancer cells (Khan et al. 2007; Zhang and Walker 2007). In rabbit, hepatic CYP1A1 protein content was down-regulated following moderate acute hypoxia (Fradette et al. 2007). In humans, indirect evidence suggests that hypoxia reduces the rate of biotransformation of drugs cleared by CYP1A, 2B, and 2C (du Souich and Fradette 2011). Nevertheless, since CYP1B1 is until now poorly investigated in drug metabolism, data are lacking regarding hypoxia effect on CYP1B1-mediated drug metabolism.
Different hypotheses could be raised to explain the observed asymmetric interference between AhR and hypoxia pathways. First, since AhR and HIF share limiting cellular cofactors to induce their signaling (Kewley et al. 2004; Beischlag et al. 2008; McIntosh et al. 2010), interference between these two pathways may result from a competition in the recruitment of one of these common cofactor, with ARNT the obvious candidate. Historically, ARNT was thought to be constitutively and ubiquitously expressed irrespective of oxygen tension (Gradin et al. 1996; Kallio et al. 1997; Pollenz et al. 1999). However, recent data now support a hypoxia-dependent ARNT up-regulation depending on cell-line specificity (Mandl and Depping 2014). Thus, depending on ARNT bioavailability and/or on AhR and HIF-α subunits respective affinity for ARNT, AhR, and HIF-α subunits may compete for ARNT recruitment. For instance, Gradin et al. reported that HIF-1α bind to ARNT with a greater affinity than does ligand-activated AhR in vitro in human HEPG2 cells (Gradin et al. 1996). Vorrinck et al. recently reported that ARNT over-expression rescued the interference of AhR and hypoxia pathways in human HEPG2 cells (Vorrink et al. 2014). Even if no data are currently available regarding comparative affinity of HIF-2α and AhR for ARNT, we could hypothesize that the interference of hypoxia on AhR signaling might result from a competition for ARNT recruitment, with a preferential binding of HIF-α subunits to ARNT leading to a decrease availability of ARNT to heterodimerize with AhR. As silencing experiments evidenced that basal expression of CYP1A1/1B1 is AhR-dependent, this putative competition for ARNT recruitment could explain down-regulation of basal CYP1A1/1B1 expression under hypoxic environment. Interestingly, as ligand-dependent differences exist in AhR target gene expression (Denison et al. 2011), competition between HIF-α subunits and AhR for ARNT heterodimerization might differ whether AhR is activated by an endogenous or an exogenous ligand. Importantly, the theory of competition for ARNT binding does not exclude the possibility of competition for the recruitment of other shared cofactors.
Second, hypoxia interference with AhR pathway might be due to microRNAs (miRNAs) generated under hypoxia. Indeed, miRNAs, which are short non-coding RNAs mainly implicated in post-transcriptional gene silencing, are now pointed out as a key element in the hypoxia response (Nallamshetty et al. 2013). Hypoxia up-regulates a specific set of miRNAs named “hypoxamirs” (Chan and Loscalzo 2010). Thus, hypoxia may indirectly act as a transcriptional repressor through hypoxamirs and the observed interference of hypoxia on AhR pathway might arise from hypoxamirs targeting CY1A1/CYP1B1 expression.
At least, as HIF-1 complex binds HRE sequences to regulate target genes expression, we examined whether HRE motifs were present in the 5′-regulatory regions of human CYP1A1 and CYP1B1 genes. HRE core sequence has been identified as 5′-A/GCGTG-3′ (Wenger et al. 2005). Six putative HRE sequences conserved between human and mouse were identified within the up-stream promoter region of CYP1A1 gene and four within the up-stream promoter region of CYP1B1. Interestingly, some of these HREs were localized within described XRE sequences for CYP1A1 and CYP1B1. In fact, CYP1A1 and CYP1B1 genes contain multiple consensus XRE sequences, i.e., 5′-T/GNGCGTG-3′ with the required pentameric core sequence 5′-GCGTG-3′ in their promoter region (Tang et al. 1996; Whitlock et al. 1996; Tsuchiya et al. 2003). Thus, we could hypothesize that the binding of HIF-1 complex on the HRE localized within the XRE sites might prevent ligand/AhR/ARNT complex binding on XRE and therefore could lead to the observed interference of hypoxia on AhR signaling.
In conclusion, we reported for the first time an interaction between hypoxia and AhR signaling pathways in human cerebral microvascular endothelial hCMEC/D3 cells. Although the hCMEC/D3 cell line is used worldwide and retains some of the unique properties of brain endothelial cells, this model also has some limitations. hCMEC/D3 cells lack typical brain endothelial properties such as high transendothelial electrical resistance (TEER) value. Moreover, like any other immortalized cell line, they undergo dedifferentiation. Therefore, further experiments using primary brain endothelial cells would be necessary before allowing any transposition of the observed in vitro interference between AhR and hypoxia pathways to an in vivo situation. Further investigations will also be necessary to better understand the mechanism underlying hypoxia interference on AhR signaling pathway in cerebral endothelium. Taken into account that CYP1B1 is the major CYPs express at the human BBB, elucidating the different signaling pathways implicated in its regulation may provide an important clue to assess the physiological and/or pathological implication of CYP1B1 at the human BBB.
Acknowledgments and conflict of interest disclosure
Funding institution: Université Paris Descartes; INSERM. The authors have no conflict of interest to declare.
All experiments were conducted in compliance with the ARRIVE guidelines.


