Zircon (Re)crystallization During Metamorphism: Zircon Paragenesis in the Papua New Guinea Coesite Eclogite Revisited
Funding: This work was supported by the Nederlandse Organisatie voor Wetenschappelijk Onderzoek (ALWOP.608) and the Horizon 2020 Framework Programme (871149).
ABSTRACT
The youngest known ultrahigh-pressure (UHP) eclogite from Tumagabuna Island, a small island of the D'Entrecasteaux Islands chain in Papua New Guinea, exhibits zircon U–Pb age variations spanning a few million years. This age variation complicates the interpretation of the evolution of this high and ultrahigh-pressure ([U]HP) terrane. We investigate the discrepancies in zircon ages using SHRIMP U–Pb dating and same-spot REE abundance data. Petrographic observations reveal a main mineral assemblage of garnet, omphacite, amphibole, coesite, phengite, rutile and zircon in the eclogite. The formation of the main mineral assemblage is constrained by P–T pseudosection modelling. The main mineral assemblage likely crystallized from a melt at UHP conditions of p = 3.5 ± 0.2 GPa and T = 690°C ± 40°C. Two distinct generations of zircon are identified: an older group with ages ranging between 7.0 ± 0.2 and 7.9 ± 0.3 Ma and a younger group with ages ranging between 4.4 ± 0.3 Ma and 5.5 ± 0.4 Ma. These zircon populations differ in internal zoning and MREE and HREE contents. The initial zircon growth phase corresponds to the formation of the main mineral assemblage at UHP conditions, whereas the younger zircon generation likely resulted from Zr release during exhumation-related breakdown of the Zr-bearing UHP phases garnet, rutile and possibly omphacite.
1 Introduction
U–Pb zircon geochronology is a widely used and essential tool to constrain the timing of metamorphic events (e.g., McClelland and Lapen 2013). However, linking ages to specific points on a metamorphic pressure–temperature path is not trivial, and difficulties arise when zircon crystals from a given sample or location exhibit age variations across different studies using different U–Pb methods. Such problems are exacerbated if no clear textural and/or chemical evidence can be identified that can explain these differences. Variations in the reported ages of zircon from the youngest known ultrahigh-pressure (UHP) metamorphic rock from the D'Entrecasteaux Islands, Papua New Guinea, ranging from 4.1 ± 1.3 to 7.9 ± 1.9 Ma (DesOrmeau et al. 2017; Gordon et al. 2012; Monteleone et al. 2007) cast doubt on whether zircon ages date the timing of peak UHP metamorphism (Kohn et al. 2015). Here, we further elucidate the range of zircon ages reported in previous studies by a comprehensive analysis of existing ages for zircon and other minerals, supplemented by newly acquired SHRIMP U–Pb age and REE abundance data, in conjunction with information from new petrological observations and phase equilibrium modelling.
The D'Entrecasteaux Islands off the eastern tip of Papua New Guinea's mainland (Figure 1) host rocks of active metamorphic core complexes, exposing upper and lower plate lithologies (Davies and Warren 1988; Hill 1991). The three main islands of the archipelago are characterized by five dome structures, three of which are on Fergusson Island (Figure 1). The core complexes expose rocks from the upper plate, which consists of nonmetamorphic Neogene volcanic and sedimentary rocks and remnants of mafic to ultramafic rocks inferred to correlate with the Papuan ultramafic belt, as well as rocks from the lower plate. The rocks of the lower plate are migmatitic quartzo-feldspathic orthogneisses with smaller amounts of paragneiss, amphibolite, marble, quartzite and encapsulated eclogites (DesOrmeau et al. 2018 and references therein). Structurally, the lower plate unit is subdivided into two zones: a lower core zone, characterized by gneissic layering cross-cut by eclogitic dykes, with both the dykes and layering chaotically folded, and an upper carapace zone, characterized by strongly sheared mylonites and gneisses with mineral lineations forming a strong L-S tectonite fabric (Hill 1994).
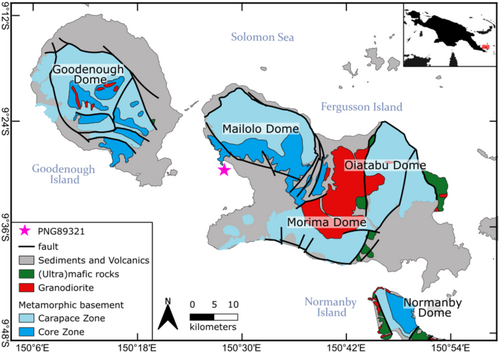
This study focuses on the coesite eclogite from Tumagabuna Island (9°29′0″S, 150°27′40″E), a small island located offshore the southwest side of the Mailolo Dome of Fergusson Island (pink star in Figure 1). The coesite eclogite is part of a mafic boudin in a strongly foliated garnet-bearing quartzofeldspathic host gneiss of the core zone. The eclogitic core of the boudin is separated from the gneiss by an amphibolite rim. The pressure shadows of the boudin consist of pegmatite, which is also present as veins in the host gneiss (Baldwin et al. 2008; Faryad et al. 2019). To date, data from three samples of the coesite eclogite have been published (A10 by Davies and Warren 1992; PNG89321 by Baldwin et al. 1993; and PNG08010 by Gordon et al. 2012). The sample analysed here (PNG89321d) is an aliquot of sample PNG89321 (see Baldwin and Das 2015; Baldwin et al. 1993; Baldwin et al. 2008; Faryad et al. 2019; Monteleone et al. 2007; Osborne et al. 2019; Zirakparvar et al. 2011, 2013).
Since the discovery of a Pliocene eclogite, the youngest ever recorded age for an eclogite, sampled from Mailolo Dome (Baldwin et al. 2004), extensive studies were conducted in the region. Coesite in sample PNG89321 (Baldwin et al. 2008) indicated that the peak pressure metamorphism of the rock must have exceeded ~2.7 GPa (e.g., Bohlen and Boettcher 1982), adding this extremely young occurrence to the limited number of known cases of UHP metamorphism (Zhang and Zhang 2021). However, both the age and conditions of peak metamorphism remain intensely debated, as outlined below. Prior to the discovery of the young radiometric ages and coesite in the region, Davies and Warren (1992) estimated the PT conditions under which the main mineral assemblage of the eclogite from Tumagabuna Island (Sample A10) formed. Using the jadeite content of omphacite and Si in phengite as barometers, in combination with garnet-clinopyroxene thermometry, they obtained two results: ~1.2 GPa at ~530°C and ~1.65 GPa at ~700°C. In analyses after the discovery of coesite in the Tumagabuna Island eclogite, different Zr-in-rutile calibrations (Tomkins et al. 2007; Watson et al. 2006; Zack et al. 2004) and Ti-in-zircon calibrations (Ferry and Watson 2007; Watson and Harrison 2005) yielded temperatures ranging between 612°C and 746°C, and 650°C and 680°C, respectively (Samples PNG89321 and PNG08010F; Baldwin et al. 2008; DesOrmeau et al. 2017; Monteleone et al. 2007). Osborne et al. (2019) applied the Ti-in-coesite–Zr-in-rutile intersection method and obtained PT-estimates of 3.3 ± 0.7 GPa and 763°C ± 65°C. Application of net transfer reaction garnet-pyroxene-(phengite) thermo (baro)meters (Ai 1994; Krogh Ravna and Terry 2004; Ravna 2000) indicated the peak metamorphism of 600°C–765°C and 1.8–3.10 ± 0.32 GPa (Baldwin et al. 2008; DesOrmeau et al. 2017; Faryad et al. 2019; Monteleone et al. 2007). Compositionally constrained phase diagrams (pseudosections) yielded PT-conditions for formation of the main mineral assemblage between 580°C and 680°C at pressures between 2.7 and 2.8 GPa (DesOrmeau et al. 2017; Faryad et al. 2019). The spread among these estimates shows that pinpointing the conditions of the genesis of the coesite eclogite is challenging, with temperature estimates ranging between ~530°C and 763°C ± 65°C and pressure estimates between 1.2 and 3.3 ± 0.7 GPa.
Various dating methods have been applied to determine the timing of the formation of specific minerals and/or the peak metamorphism of the coesite eclogite from Tumagabuna Island. Measurement of 40Ar/39Ar from amphibole (PNG89321) resulted in an age of 9.83 Ma, but the result was interpreted to be affected by the presence of excess Ar (Baldwin et al. 1993), which can cause elevated 40Ar/39Ar apparent ages (Kelley 2002). A 7.93 ± 0.1 Ma (1σ) 40Ar/39Ar age of phengite (PNG89321) is younger than the amphibole age; trapped atmospheric Ar and Ne in phengite and omphacite suggest that excess Ar did not affect this 40Ar/39Ar phengite age (Baldwin and Das 2015). The age of phengite is just within error of a Lu-Hf garnet-whole rock isochron age of 7.1 ± 0.7 Ma (2σ, MSWD = 1.1, PNG89321, Zirakparvar et al. 2011) and a zircon SIMS 206Pb/238U-207Pb/206Pb lower intercept age of 7.9 ± 1.9 Ma (2σ, MSWD = 9.2, Monteleone et al. 2007). Measurements using LA-ICP-MS of 206Pb/238U in zircon from unaltered eclogite (PNG08010) revealed ages ranging from 4.1 ± 1.3 Ma to 7.4 ± 1.1 Ma (2σ), whereas CA-TIMS analysis of individual zircon grains from the same sample yielded a narrower age range between 4.78 ± 0.17 Ma and 5.82 ± 0.20 Ma (2σ; Gordon et al. 2012). Additional CA-TIMS ages of 5.20 ± 0.33 to 5.98 ± 0.17 Ma (2σ; DesOrmeau et al. 2017) are slightly older. The reason why the U–Pb single-grain ages of zircon determined with CA-TIMS are significantly younger than those obtained by in situ methods, and the ages of other minerals remain unclear, as this discrepancy was not addressed in previous studies. Age determination by Rb-Sr dating (PNG08010) using MC-ICP-MS and TIMS could not further clarify the timing of eclogite metamorphism (Korchinski et al. 2014). The measurements yielded (I) an omphacite-white mica isochron age of 11.7 ± 7.8 Ma (2σ) and (II) a 6.4 ± 1.3 Ma (2σ) whole rock-amphibole-white mica isochron age. The imprecise older isochron age was interpreted to reflect disequilibrium between omphacite and the other minerals, whereas the younger isochron age is within the range of the younger zircon U–Pb ages obtained with LA-ICP-MS (Korchinski et al. 2014). In summary, the timing and PT-conditions of UHP metamorphism are not fully understood.
To improve constraints on the timing and the PT-conditions of the formation of the main mineral assemblage of coesite-eclogite PNG89321, we develop an updated phase equilibrium model for Sample PNG89321d, using an aliquot of the original sample described in Baldwin et al. (1993). Furthermore, we present new U–Pb SHRIMP ages of zircon in combination with same-spot REE concentration SHRIMP data. These same-spot data provide new insight into the timing of zircon (re)crystallization during metamorphism. The timing of zircon growth is determined by statistically assessing the most probable zircon age(s) from the ages obtained in this study and compared to the previous work summarized above to assess the plausibility of the various interpretations of the evolution of the Papua New Guinea eclogites in the context of the pressure–temperature–time conditions recorded by the sample.
2 Methods
Major and minor element mineral chemical analysis was conducted on polished thin and thick sections using the JEOL JXA-8530F electron probe microanalyzer (EPMA) of the National Consortium for Micro-Analysis housed at Utrecht University, the Netherlands. The instrument is equipped with five wavelength dispersive spectrometers, and operating conditions were a 40° takeoff angle, an acceleration voltage of 15 keV, and a beam current of 15 nA with a beam diameter of 2 μm. Analysing crystals used included LIFH (Fe, Mn), PETL (Ti, Cr), PETH (Ca, K), TAPH (Na, Mg) and TAP (Al, Si). The peak and off-peak counting times were 28 s for all elements. The off-peak correction method was linear for all elements. Typical detection limits for the measurements were in the range of 70–150 ppm (2σ). Standards used were an in-house diopside for Ca (Kα) and Mg (Kα), jadeite for Na (Kα), KTiPO5 for K (Kα) and Ti (Kα), chromium metal for Cr (Kα), haematite for Fe (Kα), tephroite for Si (Kα) and Mn (Kα), and Kl-2 for Al (Kα). A ZAF algorithm was applied to correct the raw data.
The concentrations of Zr in amphibole, omphacite and garnet were determined at the Utrecht University GeoLab by laser ablation inductively coupled plasma mass spectrometry (LA-ICP-MS) equipped with a Lambda physics excimer laser (193 nm) with GeoLas optics in conjunction with a ThermoFischer Scientific Element 2 magnetic sector ICP-MS. The ablation time for each measurement was 45 s with a spot size of 40 μm. The minimum detection limit (99% confidence) for Zr for all minerals measured was ≤ 0.05 ppm. Silicate glasses NIST612 and BCR2G were used as reference standards. Silicon, as determined by EPMA, was used as the internal standard element. The raw LA-ICP-MS data were processed with the software Glitter 4.5 (Griffin 2008).
For in situ U–Pb dating of zircon and same-spot concentrations of selected REE, the Sensitive High-Resolution Ion MicroProbe (SHRIMP) IIe/MC at the Korean Basic Science Institute (KBSI) in South Korea was employed. The zircon grains were mounted in epoxy and coated with gold for the measurements. Zoning in zircon crystals was visualized using cathodoluminescence (CL) and backscattered electron (BSE) images by Scanning Electron Microscope (JEOL JSM-6610LV). Following the analytical protocol outlined by Williams (1997), the concentrations of the isotopes 204Pb,206Pb,207Pb,208Pb and 238U, as well as the oxides 196(Zr2O), 248(ThO) and 254(UO), were determined in five measurement cycles. An O2− primary beam was used, with a beam current of ~4.5 nA and a spot diameter of ~37 μm. Natural zircon FC1 (1.099 Ma; Paces and Miller 1993) served as reference material. Data reduction was carried out using SQUID 2.5 software (https://cirdles.org/projects/squid/) and IsoplotR (Vermeesch 2018). Because of large uncertainties in the 204Pb measurements and because the Th/U ratios of the zircon are below 0.5 with few exceptions (Table S1), the common Pb was corrected assuming a 206Pb/238U-208Pb/232Th age concordance as described in Williams (1997). Subsequent to U–Pb analysis, abundances of a selection of REE of larger zircon grains were determined at the same spots where the U–Pb data were collected. NIST-611 glass was selected for reference material, and masses of 96Zr, 139La, 140Ce, 141Pr, 143Nd, 147Sm, 151Eu, 155Gd, 159Tb, 161Dy, 165Ho, 166Er, 169Tm, 171Yb and 175Lu were measured. Data were reduced using SQUID 2.5 software.
To determine the peak pressure conditions at which the eclogite sample equilibrated, a compositionally constrained phase diagram section (pseudosection) was constructed using Perple_X 7.1.2 software (Connolly 2005). It was assumed that the chemical composition of the eclogite behaved as a closed system since UHP conditions, with the exception of H2O; hence, the bulk sample composition was used as input for the calculations. Bulk sample major element data were obtained by X-ray fluorescence spectroscopy (XRF) with a PANalytical AxiosMax 2 XRF at Vrije Universiteit Amsterdam, the Netherlands. The stability of phases was calculated by Gibbs energy minimization using the internally consistent thermodynamic database hp62ver (based on TC-DS620 by Holland and Powell 2011) using the chemical components MnO-Na2O-CaO-K2O-FeO-MgO-Al2O3-SiO2-H2O-TiO2 (MnNCKFMASHT). Because the actual water content of the system during metamorphism is unknown, we constrained the appropriate amount of H2O using a T-X diagram at p = 3.5 GPa (Figure S1) in such way that the observed mineral assemblage stabilizes; this leaves a small amount of excess H2O in the majority of phase fields. The following models were used to calculate nonideal mineral solid solutions and partial melt: chlorite, chloritoid, garnet, mica (White et al. 2014a, 2014b), amphibole (Green et al. 2016), pyroxene (Green et al. 2007), feldspar (Benisek et al. 2010), spinel (White et al. 2002), epidote (Holland and Powell 2011) and melt (Holland et al. 2018). As fluid equation of state, a compensated-Redlich-Kwong (CORK) equation for volumes and fugacities of CO2 and H2O (Holland and Powell 1991, 1998) was used.
3 Petrography
3.1 Petrography and Mineral Chemistry
Sample PNG89321d predominantly consists of garnet (~35%); omphacite (~35%); amphibole (~15%); an SiO2 phase, that is, quartz or coesite (~10%); and phengite (~4%), accompanied by accessory amounts of rutile (~1%), apatite, plagioclase, zircon, paragonite, biotite, ilmenite and iron oxides. Representative chemical compositions of the silicate minerals, including the Zr content of garnet, omphacite and amphibole (amp1) are given in Table 1. The coesite eclogite has a granoblastic to poikiloblastic texture. Amphibole poikiloblasts include all other minerals, and garnet, omphacite, quartz and phengite constitute a granoblastic matrix between the poikiloblasts. Garnet, omphacite and phengite, as well as the amphibole poikiloblasts, share a shape-preferred orientation.
| Garnet | Omphacite | Amphibole | Phengite | Paragonite | Biotitec | Plagioclase | ||||||||
|---|---|---|---|---|---|---|---|---|---|---|---|---|---|---|
| [wt%] | core | rim | iclp | iclg | f | amp1 | amp2a | amp2 | f | iclg | symp1 | symp2c | ||
| SiO2 | 39.02 | 39.00 | 38.89 | 56.59 | 56.20 | 54.05 | 47.01 | 41.11 | 48.86 | 52.69 | 45.44 | 39.52 | 65.21 | 65.60 |
| Al2O3 | 21.52 | 21.69 | 21.61 | 12.62 | 12.99 | 10.82 | 13.92 | 12.7 | 26.99 | 24.03 | 37.99 | 20.77 | 21.13 | 20.77 |
| FeO | 26.76 | 27.18 | 27.48 | 5.48 | 5.40 | 8.39 | 10.19 | 12.96 | 2.18 | 1.80 | 0.77 | 10.80 | 0.15 | 1.94 |
| MgO | 8.98 | 9.27 | 8.42 | 6.62 | 6.68 | 13.80 | 12.66 | 12.14 | 3.59 | 4.73 | 0.27 | 14.82 | 0.03 | 1.18 |
| CaO | 3.63 | 2.84 | 3.38 | 9.34 | 9.21 | 3.69 | 6.54 | 9.67 | 0.01 | 0.01 | 0.21 | 2.65 | 0.89 | |
| Na2O | 0.03 | 0.03 | 0.04 | 9.02 | 8.94 | 6.07 | 5.27 | 3.88 | 1.08 | 0.74 | 6.99 | 10.76 | 9.62 | |
| K2O | 0.02 | 0.02 | 0.03 | 0.01 | 0.02 | 0.25 | 0.50 | 0.84 | 9.68 | 10.11 | 1.13 | 7.54 | 0.13 | |
| MnO | 0.39 | 0.42 | 0.52 | 0.03 | 0.02 | 0.02 | 0.02 | bdl | 0.01 | 0.01 | bdl | |||
| TiO2 | 0.07 | 0.03 | 0.05 | 0.19 | 0.22 | 0.23 | 0.50 | 1.48 | 0.72 | 0.66 | 0.21 | 1.16 | 0.02 | |
| Cr2O3 | 0.00 | bdl | bdl | 0.01 | bdl | 0.03 | 0.01 | 0.01 | 0.01 | |||||
| Total | 100.41 | 100.49 | 100.42 | 99.92 | 99.67 | 97.32 | 96.61 | 94.78 | 93.14 | 94.79 | 93.03 | 94.61 | 100.08 | 100.00 |
| 12 Oa | 6 Oa | 22 Ob | 11 Oa | 8 Oa | ||||||||||
| Si | 3.00 | 2.99 | 3.00 | 1.99 | 1.98 | 7.53 | 6.76 | 6.23 | 3.34 | 3.52 | 2.99 | 2.83 | 2.88 | 2.89 |
| Al | 1.95 | 1.96 | 1.96 | 0.52 | 0.54 | 1.78 | 2.36 | 2.27 | 2.17 | 1.89 | 2.95 | 1.75 | 1.10 | 1.08 |
| Fe | 1.72 | 1.74 | 1.77 | 0.16 | 0.16 | 0.98 | 1.23 | 1.64 | 0.12 | 0.10 | 0.04 | 0.65 | 0.01 | 0.07 |
| Mg | 1.03 | 1.06 | 0.97 | 0.35 | 0.35 | 2.86 | 2.71 | 2.74 | 0.37 | 0.47 | 0.03 | 1.58 | < 0.01 | 0.08 |
| Ca | 0.30 | 0.23 | 0.28 | 0.35 | 0.35 | 0.55 | 1.01 | 1.57 | < 0.01 | < 0.01 | 0.02 | 0.13 | 0.04 | |
| Na | 0.01 | 0.62 | 0.61 | 1.64 | 1.47 | 1.14 | 0.14 | 0.10 | 0.89 | 0.92 | 0.82 | |||
| K | < 0.01 | < 0.01 | < 0.01 | < 0.01 | 0.04 | 0.09 | 0.16 | 0.84 | 0.86 | 0.09 | 0.69 | 0.01 | ||
| Mn | 0.03 | 0.03 | 0.03 | < 0.01 | < 0.01 | < 0.01 | < 0.01 | < 0.01 | < 0.01 | < 0.01 | ||||
| Ti | < 0.01 | < 0.01 | < 0.01 | 0.01 | 0.01 | 0.02 | 0.05 | 0.17 | 0.04 | 0.03 | 0.01 | 0.06 | ||
| Cr | < 0.01 | < 0.01 | < 0.01 | < 0.01 | < 0.01 | |||||||||
| alm|aega | 56 | 57 | 58 | 51 | 51 | |||||||||
| prp|di + hda | 33 | 35 | 32 | 10 | 10 | |||||||||
|
grs|jda |
10 | 8 | 9 | 35 | 34 | |||||||||
| avg (n = 24) | 1σ | avg (n = 5) | 1σ | avg (n = 13) | 1σ | |||||||||
| Zr [ppm]d | 0.7 | 0.4 | 3.90 | 0.3 | 2.5 | 0.6 | ||||||||
- Abbreviations: alm, almandine; bdl, below detection limit; f, fresh; grs, grossular; iclg, inclusion in garnet; iclp, inclusion in phengite; prp, pyrope; symp1, amp2 symplectite; symp2, biotite symplectite.
- a Calculated with Minplot (Walters 2022).
- b Calculated with amphibole classification spreadsheet (Locock 2014).
- c With JEOL JCM-600 SEM.
- d With LA-ICPMS.
Garnet is present as euhedral to subhedral equidimensional grains ranging from 20 to 900 μm, on average ~350 μm in diameter, and is uniformly distributed in the rock. The composition of a representative garnet core is Alm56Prp33Grs10Sps<1, whereas the composition of a representative garnet rim is Alm57Prp35Grs8Sps<1 (Table 1). Garnet is chemically zoned, as Faryad et al. (2019) described in detail, with higher Ca and lower Mg in the core than in the outer rims (Figure S2b,d). Garnet contains 0.7 ± 0.4 ppm of Zr with a median of 0.6 ppm. Resorption textures are commonly associated with garnet grains near veins or other areas with a higher degree of alteration. Garnet contains inclusions of omphacite, phengite, apatite, rutile, zircon and ilmenite. Some phengite and omphacite inclusions in garnet are up to 150 μm in size. In rare cases, a quartz/coesite rim around omphacite inclusions is observed (Figure 2c,d).
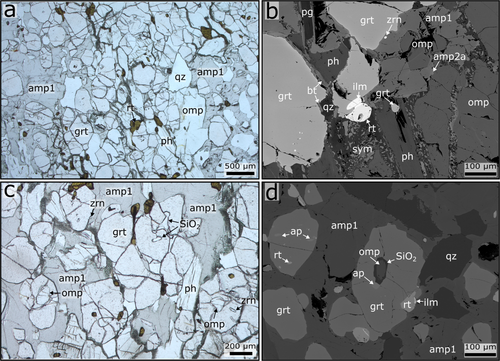
Omphacite occurs as subhedral to anhedral, short prismatic grains ranging in size from a few microns in symplectites to 1.1 mm, and has an average length of 400 μm. Omphacite contains 3.9 ± 0.3 ppm of Zr with a median of 3.9 ppm. Especially in the vicinity of veins, omphacite is surrounded by amphibole–plagioclase symplectites, which vary in thickness up to several tens of microns. Compared to the other major mineral phases, omphacite contains few inclusions, which are mostly zircon and rarely an SiO2 phase. Small numbers of omphacite inclusions occur in amphibole and garnet (Figure 2b,d) with a similar chemical composition as matrix omphacite (Table 1, omphacite iclg).
The sample contains two generations of amphibole. The first generation (amp1) consists of elongated poikiloblasts ranging from 300 to 9 mm in size (Figure 2a,c) with an average length of 7 mm. The composition of amp1 is barroisitic to taramitic (Table 1 and Figure S3). Amp1 contains 2.5 ± 0.6 ppm of Zr with a median of 2.3 ppm. Grain boundaries between amp1 and other phases show no signs of reaction. A second amphibole generation (amp2) with a pargasitic composition (Table 1, amp2) occurs in amphibole–plagioclase symp1 symplectites surrounding omphacite. In places, amp1 has a rim with a chemical composition closer to the second amphibole generation amp2 (Table 1, amp2a, higher BSE emission rim in Figure 2b). Relative to its abundance in the rock, omphacite is underrepresented as an inclusion in the amphibole poikiloblasts. Generally, the inclusions in poikiloblasts tend to be less altered than in the matrix. Amphibole does not occur as an inclusion in other phases.
Phengite appears as euhedral to anhedral blades with an average length of ~350 μm, ranging from 20 to 500 μm. In places, fine, up to 10 μm wide biotite-plagioclase symp2 symplectites have formed around phengite, especially in strongly altered regions of the sample. Phengite contains garnet inclusions and is included in garnet, omphacite and amp1. In contact with garnet, phengite locally formed biotite rims (Figure 2b). The chemical composition of phengite inclusions does not significantly differ from matrix phengite. Individual, mostly anhedral quartz crystals occur between amp1, omphacite and/or garnet or as inclusions and have diameters < 5 μm. Locally, quartz forms aggregates with an average diameter of ~400 μm, ranging from 100 to 600 μm. Rarely, euhedral biotite blades up to 20 μm in length occur in contact with garnet (Figure 2b). In addition, a few prismatic, euhedral, 30- to 100-μm-long paragonite grains are present in contact with phengite and in amphibole amp1.
Rutile is the most common accessory phase and occurs interstitially as round to nodular, anhedral grains, but also as prismatic to round, euhedral to subhedral inclusions in garnet, omphacite, amphibole and phengite. Several rutile grains have a diameter of up to 100 μm; grains < 2 μm occur as inclusions. Rutile is mostly uniformly disseminated, with a few localized accumulations. In some cases, rutile is replaced by ilmenite, especially in altered regions of the sample, but also in garnet inclusions. In a few places, colloform iron oxides replace ilmenite. Similar to rutile, apatite occurs as rounded inclusions with a diameter between < 2 and 15 μm, primarily in garnet (Figures 2d and S1). Anhedral matrix apatite is rare and ranges in size from 30 to 100 μm in diameter. Zircon is very rare in the sample and was solely observed as inclusions in all major mineral phases, but mainly in garnet. The grains predominantly have a round to ellipsoid, anhedral to subhedral shape, and range in diameter from < 2 to 80 μm (Figure 2c,b). In total, only 120 zircon crystals between 30 and 80 μm in diameter could be extracted from 250 g of sample. Very small (< 2 μm) zircon needles are accumulated, particularly in the core of inclusion-rich garnet. A few zircon grains contain round inclusions that are dark in back-scattered electron (BSE) images. These inclusions are generally very small, with diameters < 3 μm, with a few exceptions around ~15 μm; the inclusions were not positively identified.
3.2 Interpretation of Petrography and Mineral Chemistry
We infer that the main mineral assemblage consisted of garnet, omphacite, phengite and an SiO2 phase (i.e., quartz or coesite) based on the observation that these minerals are all mutually included. This assemblage was accompanied by accessory rutile and zircon. Because zircon and rutile are included in the main phases, they must have crystallized before or simultaneously with the main assemblage.
With the exception of rare rims altered to amp2, the poikiloblastic amphibole amp1 shows no signs of alteration on its grain boundaries. In addition, phengite and omphacite inclusions in amp1 rarely have symplectite rims, suggesting that amp1 sheltered included minerals from alteration. This implies that amp1 was not subject to large chemical changes and, therefore, was in equilibrium with the main mineral assemblage. Amphibole amp1 is, however, the only abundant phase in the sample that is not included in other major phases. Therefore, we infer two possible scenarios for when amp1 formed with respect to the main mineral assemblage: (I) amp1 formed shortly after the main mineral assemblage, similar to oikocrysts in igneous rocks with poikilitic texture (e.g., Barnes et al. 2016), or (II) amp1 crystallized simultaneously with the main mineral assemblage, but with a much higher growth rate, incorporating the slower growing phases. Considering the mineral textures in the related sample PNG08010F, Korchinski et al. (2014) argued that amphibole must have grown immediately after garnet, omphacite, quartz and rutile. DesOrmeau et al. (2017) assigned amphibole in sample PNG08010F to the peak metamorphic assemblage; furthermore, they found taramitic amphibole as inclusions in garnet. Brownlee et al. (2011) identified amp1 and amp2 in sample PNG08010, and although amp1 was not assigned to the main mineral assemblage, pseudosection analysis indicated amphibole stability at pressures above the quartz-coesite transition. In aliquots of sample PNG89321, however, amphibole similar to amp1 was only identified in one other study. Faryad et al. (2019) identified poikiloblasts up to 6 mm in size. In contrast to the poikiloblasts from our sample PNG89321d, these poikiloblasts do not have a shape-preferred orientation as the rest of the main mineral phases and were interpreted to have grown at a later, postkinematic stage. With the help of a pseudosection analysis, they interpreted amphibole as a retrograde phase.
The aforementioned rims (Figure 2b) of amp1 indicate that amp1 was chemically altered after the main growth phase or that a secondary growth phase occurred under different conditions. Because the composition of the rims amp2a is close to amp2 (Table 1), and as the amp2-plagioclase symplectites in the sample are clearly a result of retrograde omphacite breakdown, the rims of amphibole poikiloblasts are likely coeval with the decomposition of omphacite. Similarly, biotite-plagioclase symplectites are a result of the retrograde breakdown of phengite. Paragonite and nonsymplectite-bound biotite must also have formed after the formation of the main mineral assemblage, as these two minerals always occur in association with or at the edges of the above-mentioned main mineralogy. Weak chemical zoning of garnet (Figure S2) suggests episodic growth. Two-stage garnet growth, with an intervening phase of resorption, was previously linked to the exhumation of the coesite eclogites (Faryad et al. 2019). The formation of the iron-bearing secondary phases biotite and ilmenite along the edges of phengite and rutile in contact with the garnet indicates the breakdown of garnet, as it is likely that the iron required for the formation of these phases originates from the garnet. The colloform iron oxides were the last to form, as they replaced ilmenite, which itself replaced rutile.
The chemical composition of the minerals in the coesite eclogite varies slightly across different aliquots of samples PNG89321 (Faryad et al. 2019) and PNG08010 (DesOrmeau et al. 2017) (Figure S3). We infer that these variations result from the differences in the modal abundance of the phases (PNG08010: Brownlee et al. 2011; DesOrmeau et al. 2017; PNG89321: Faryad et al. 2019) and bulk composition (Zirakparvar et al. 2013) between the aliquots. The bulk composition of PNG89321d, as determined by XRF, is shown in Table 2 and differs from previous bulk composition analyses of PNG89321 (Zirakparvar et al. 2013) by an ~5 mol% higher SiO₂ content and lower concentrations of all other major element oxides.
| Component | [wt%] |
|---|---|
| SiO2 | 53.35 |
| Al2O3 | 14.89 |
| FeO | 12.20 |
| MgO | 6.68 |
| CaO | 4.61 |
| Na2O | 3.26 |
| K2O | 0.72 |
| MnO | 0.18 |
| TiO2 | 2.17 |
| H2Oa | 2.15 |
| SUM | 100.21 |
- a The appropriated H2O content was estimated using a T-X diagram construted with Perplex_X.
In summary, the petrographic observations indicate a main mineral assemblage of garnet, omphacite, phengite, quartz/coesite, rutile and zircon. Secondary phases are biotite, paragonite, feldspar, pargasitic amphibole, ilmenite and iron oxides. For lack of mutual inclusions, it is not clear whether amphibole amp1 is part of the main mineral assemblage. However, as amp1 appears to have shielded phengite and omphacite inclusions from later alteration and has altered rims compositionally similar to amp2, we infer that amp1 must predate the alteration of the main mineral assemblage.
4 Phase Equilibrium Modelling
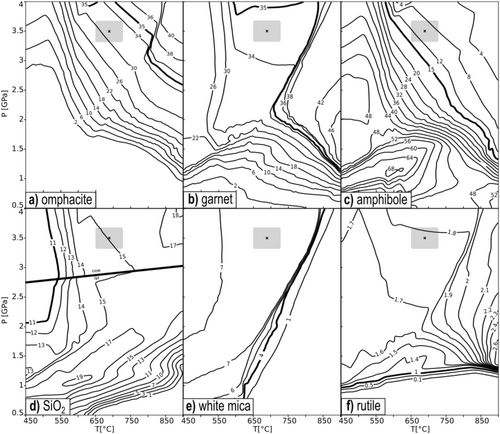
Figure 3 is the pseudosection resulting from the phase equilibrium modelling with Perple_X. The bulk composition used for the model is given in Table 2. According to the model, amphibole is stable at all PT conditions considered. In conjunction with the petrographic evidence described in Section 3.2, we conclude amphibole is part of the main mineral assemblage. Assuming the stable SiO2 phase is coesite (cf. Baldwin et al. 2008), the main mineral assemblage of PNG89321d is stable in the upper right phase field in Figure 3, highlighted in blue.
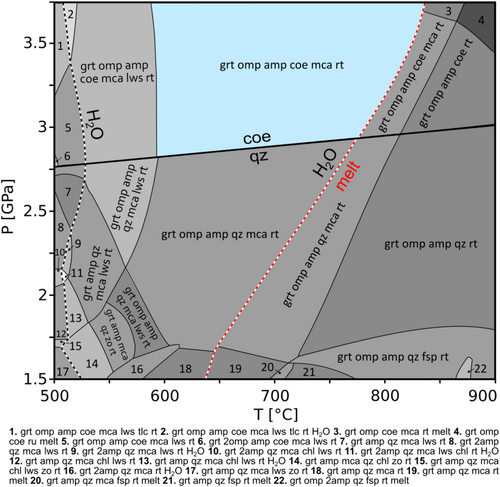
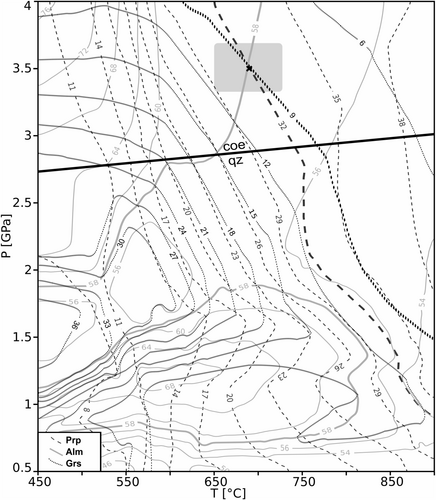
To further constrain the PT conditions at which the main mineral assemblage equilibrated, we used two main criteria: (I) a comparison between the modal abundances of the main mineral assemblage in the sample with the modes predicted by the phase equilibrium model and (II) a comparison between the measured chemical composition of unaltered garnet (Table 1, garnet iclp) with the composition of garnet calculated by phase equilibrium modelling within the stability field of the main mineral assemblage. Furthermore, the stability of coesite, which was found in an aliquot of sample PNG89321 (Baldwin et al. 2008), constrains the minimum formation pressure of the main assemblage. Figure 4 shows the modal volume isopleths of (a) omphacite; (b) garnet; (c) amphibole; (d) coesite and quartz; (e) white mica, that is, phengite; and (f) rutile. The volume of amphibole amp1 (Figure 4c) in the sample was found to be particularly significant to constrain PT formation conditions. As amphibole amp1 shows minimal alteration or traces of decomposition, it is assumed that the amp1 volume fraction (~15%) corresponds to the original fraction at UHP conditions. The abundances of omphacite (~35%, Figure 4a), garnet (~35%, Figure 4b) and phengite (~4%, Figure 4e) were probably different because they were affected by retrograde alteration to a degree. Unaltered garnet, protected from alteration as an inclusion, has a chemical composition of Alm58Prp32Grs9 (Table 1, garnet iclp). Figure 5 combines the compositional isopleths of garnet computed from the phase equilibrium model. Combining the information from the modal abundances and the garnet composition, we estimate that the main mineral assemblage equilibrated at UHP conditions with a peak pressure of p = 3.5 ± 0.2 GPa at T = 690°C ± 40°C.
5 Zircon Geochronology and REE Chemistry
5.1 Results of SHRIMP Dating and REE Content
Because zircon was separated from the original rock before age determination, we cannot directly relate zircon U–Pb ages to specific host minerals. However, textures within zircon were determined using cathodoluminescence (CL) imaging. The zircon grains from PNG89321d have diffuse brighter and/or darker CL banding and, in some cases, cores with lower luminescence that appear darker in CL (Figure 6). The observed textural characteristics of zircon, including a rounded, equidimensional crystal habit and the presence of diffuse banding and rounded relict cores, suggest that zircon experienced high T and P conditions (Corfu et al. 2003; Harley et al. 2007). The relict cores and the surrounding banded zones indicate multiphase growth of the zircon; the small size of the cores as well as the overall small number of cores preserved suggests that zircon cores were resorbed prior to rim growth.
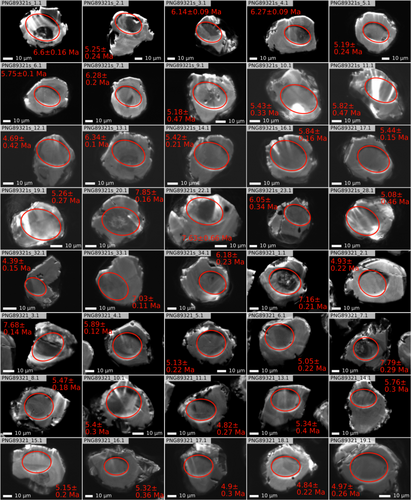
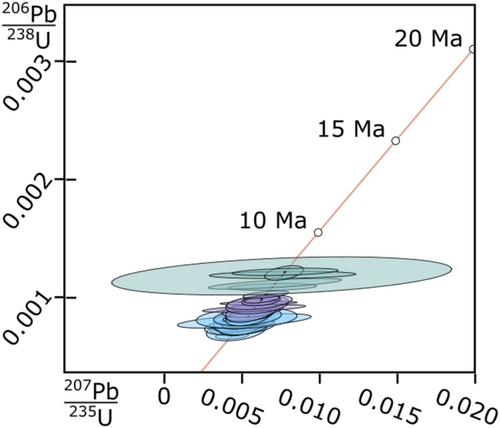
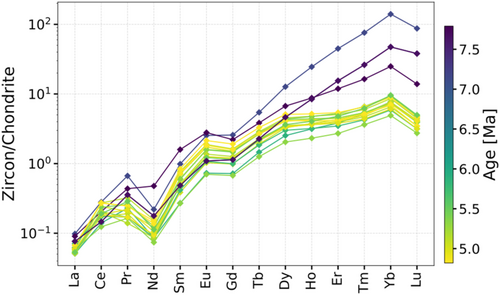
A total of 40 successful Pb-Th-U isotope measurements were carried out on zircon grains using SHRIMP (Table S1). The 206Pb/238U ages of the zircon calculated using the concordia method vary between 4.4 ± 0.3 Ma and 7.9 ± 0.3 Ma (2σ, Figure 7). The Th/U ratios are independent of age and vary between 0.103 and 1.082 (avg. 0.251 ± 0.174). Concentrations of selected REE of 17 zircon grains with grain diameters > 60 μm are given in Table S3; for smaller grains, obtaining reliable REE abundances from the same spot as the U–Pb data was not feasible. In Figure 8, chondrite-normalized REE concentrations are plotted for each grain, showing a positive Eu anomaly, Eu/Eu* = 1.47–1.71, and depletion in Nd relative to the other lanthanides. The positive Eu anomaly is independent of the age of the zircon. We note a consistent negative Nd anomaly in the REE patterns but have not been able to identify a reason for its presence. Older zircon grains have elevated MREE and HREE concentrations, as well as increased (Yb/Gd)ᴺ ratios (Table S3), compared to younger zircon grains.
5.2 Interpretation of Zircon Ages
The ages corresponding to zircon grains < 60 μm in diameter tend to be more often discordant and less precise as compared to the ages of the larger grains (Figure 7). Because the spot size of measurement was 37 μm, it is likely that several growth zones were sampled when analysing grains < 60 μm. The slow diffusion rate for Pb in zircon means that in this study Pb isotope ratios will not be altered by volume diffusion in crystalline zircon (Cherniak and Watson 2003). Therefore, we interpret the ages to date the timing of both younger and older growth zones within the zircon.
All 206Pb/238U ages are plotted together in Figure 9. The zircon ages were grouped by grain texture, in which the older zircon 206Pb/238U ages are associated with cores. Younger ages, on the other hand, are associated with zircon without or with relatively small cores, and zircon grains that are generally brighter in CL. Spots sampling equal parts of core and surrounding zones mainly yield 206Pb/238U ages between the younger and older age groups. The three distinct age groups are highlighted with different coloured backgrounds in Figure 9. About half of the zircon crystals (n = 22) are younger, ranging between 4.4 ± 0.3 Ma and 5.5 ± 0.4 Ma (2σ) with a weighted mean of 5.1 ± 0.2 Ma (2σ). Nearly one sixth (n = 6) of the measured zircon is significantly older, ranging between 7.0 ± 0.2 Ma and 7.9 ± 0.3 Ma (2σ) with a weighted mean of 7.4 ± 0.2 Ma (2σ). The rest (n = 12) plots between the younger and older group. Figure 10 displays the 206Pb/238U zircon ages in a histogram with the corresponding kernel density plot (KDE). The KDE rug plot distinguishes between measurements in more luminescent (red) and less luminescent (blue) zircon regions–zircon ages obtained from other studies were not included in the calculation, as their small number did not significantly contribute to the result. The KDE curve has two maxima, supporting the distinction into a younger and older zircon group based on zircon textures; the younger maximum of the KDE is at 5.3 Ma and associated with more luminescent zircon regions, whereas the older maximum at 7.6 Ma is associated with the less luminescent zircon cores.
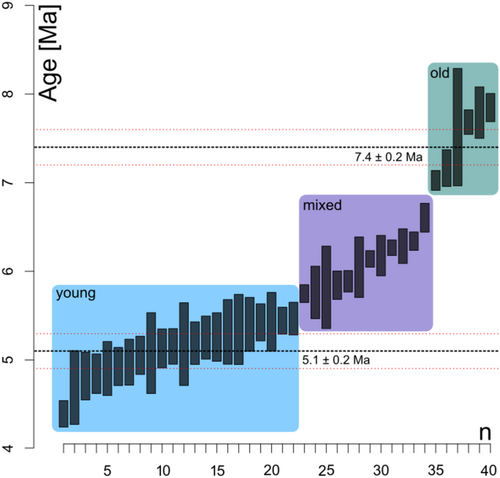
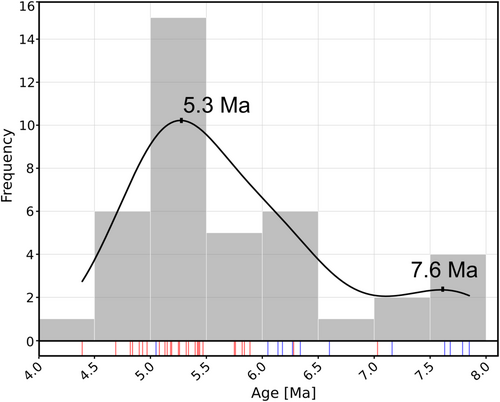
Based on the statistical analysis illustrated in Figures 9 and 10, we conclude that zircon from the PNG89321d sample must have formed in two growth stages. Based on the age distribution, we propose that the first growth phase mainly occurred from 7.6 to 7.4 Ma (avg. ~7.5 ± 0.1 Ma), and in the following, these data are referred to as ‘old’ zircon. The second growth phase mainly occurred between 5.3 and 5.1 Ma (avg. 5.2 ± 0.1 Ma), and in the following, these data are referred to as ‘young’ zircon. We infer that all zircon ages that range between the ‘young’ and ‘old’ zircons represent mixed ages; these are referred to in the following as ‘mixed’ zircon. The identification of distinct growth phases of zircon is supported by the considerable difference in REE contents, in particular MREE and HREE, between ‘young’ and ‘old’ zircon grains (Figure 8). The ‘young’ zircons show a flatter MREE and HREE pattern as compared to the ‘old’ zircons, which generally have higher MREE and HREE abundances. The chondrite-normalized HREE contents of the ‘old’ zircon (≥ 7 Ma) are particularly elevated, containing approximately 2–20 times more HREE than the ‘young’ zircon. It is a common characteristic of zircon from garnet-bearing eclogites to have flat MREE and HREE patterns, as garnet incorporates REE, especially MREE and HREE, reducing their availability for zircon (Kohn and Kelly 2018; Rubatto 2017 and references therein). Accordingly, the overall higher REE and especially steeper MREE and HREE patterns of the ‘old’ zircon imply that the ‘old’ zircon crystallized when garnet was scarce or even absent. Based on the REE patterns, it is not possible to differentiate between the ‘mixed’ and ‘young’ zircon. However, the ‘mixed’ zircon is clearly distinct from the ‘old’ zircon having the same REE pattern as the ‘young’ zircon.
6 Discussion
6.1 PT-Conditions of Formation of the Main Assemblage
By combining Perple_X modelling with observations of modal abundances (Figure 4) and garnet composition (Figure 5), we estimate that the main mineral assemblage in sample PNG89321d equilibrated at a peak pressure of p = 3.5 ± 0.2 GPa at T = 690°C ± 40°C. Perple_X-based pressure and temperature estimates on the coesite eclogite have previously been made on another aliquot of sample PNG89321 (Faryad et al. 2019) and on sample PNG08010F (DesOrmeau et al. 2017) and are compiled in Table S2. A key difference between the previous investigations and this study is that previously, the bulk composition was estimated from mineral modes and mineral chemistry, whereas in this study, the bulk rock composition is determined directly using XRF. This approach was guided by concerns about uncertainties in evaluating bulk rock compositions from X-ray maps. Coarse-grained minerals like poikiloblasts, but also finer grained phases like symplectites, are known to distort the overall chemical composition when estimated by EDS and/or X-ray maps (e.g., Sharma et al. 2021; Tinkham and Ghent 2005).
Furthermore, we use an improved thermodynamic dataset as well as the latest set of mineral solid solution models to calculate the phase equilibrium model. The difference in the methodological approaches to PT modelling is reflected in different results for the PT estimates for the formation of the UHP mineral assemblage. Although the PT conditions estimated by DesOrmeau et al. (2018) with p = 2.7–2.8 GPa and T = 580°C–590°C are significantly lower than those determined in this study, the temperature estimate by Faryad et al. (2019) of T = 660°C–680°C at p > 2.7 GPa aligns well with the temperature conditions obtained in this study for the formation of the UHP mineral assemblage. In contrast, the pressure estimate reported by Osborne et al. (2019) of p = 3.3 ± 0.7 GPa closely aligns with our results, whereas their temperature estimate of T = 763°C ± 65°C is higher than that determined in this study.
6.2 Comparison of Zircon Ages With Zircon Ages From Literature
To relate the two zircon growth phases identified in Section 5.2 to the evolution of the coesite eclogite, we compare our results to garnet, amphibole, phengite and mineral-whole rock ages, as well as to other zircon ages from the literature (Figure 11). The single-grain U–Pb zircon ages determined by CA-TIMS from sample PNG08010F overlap with the ‘young’ zircon and with the younger ‘mixed’ zircon with ages ranging between 4.78 ± 0.17 and 5.82 ± 0.20 Ma (2σ, Gordon et al. 2012) and 5.20 ± 0.33 and 5.98 ± 0.17 Ma (2σ, DesOrmeau et al. 2017), respectively. We propose two possible causes for the observation that the single grain ages dated with CA-TIMS are ‘young’. About 15% of the zircon crystals dated in this study contained ‘old’ cores, and because ‘old’ cores are relatively rare, perhaps only zircon grains without ‘old’ cores were dated with CA-TIMS. Alternatively, the preparation of the zircon grains for CA-TIMS measurements may have removed the ‘old’ cores. Considering that Gordon et al. (2012) and DesOrmeau et al. (2017) together measured 20 zircon grains with CA-TIMS, we consider it unlikely that not a single ‘old’ zircon was analysed. The common method to remove regions with Pb loss for CA-TIMS (Schaltegger et al. 2015) includes an annealing step and the dissolution of zircon in multiple steps (Mattinson 2005). We suggest that ‘older’ regions were lost during sample treatment.
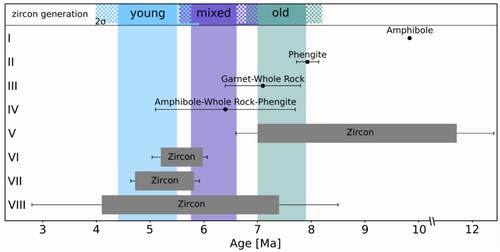
The in situ zircon ages of sample PNG08010F determined by LA-ICP-MS range between 4.1 ± 1.3 and 7.4 ± 1.1 Ma (2σ, Gordon et al. 2012) and show a similar age distribution as the zircon ages determined in this study; however, Gordon et al. (2012) were not able to distinguish zircon populations from either the textural characteristics of the grains or the HREE and MREE abundance patterns of the grains in PNG08010.
Monteleone et al. (2007) performed in situ U–Pb determinations with SIMS on zircon inclusions in garnet from sample PNG89321. They obtained an average zircon age of 7.9 ± 1.9 Ma (2σ, MSWD = 9.2), significantly higher than the ages determined with CA-TIMS. For a better comparison of the SIMS-based zircon ages with those determined in this study, we calculated 238U/206Pb-207Pb/206Pb zircon ages from the U–Pb data of Monteleone et al. (2007), yielding ages between 7.0 ± 0.4 and 11.7 ± 0.7 Ma (2σ). Most of these zircon ages coincide with the older ‘old’ zircon ages from this study, suggesting that zircon included in garnet was protected from resorption and recrystallization, thereby preserving its ‘old’ age and chemical signature. It is unclear why some U–Pb ages of zircon inclusions in garnet are older than those obtained using conventional techniques. It is possible that the ages determined in our study are underestimated due to Pb loss from the ‘old’ cores during a phase of zircon resorption prior to the growth of the younger rims.
In summary, we hypothesize that only the ‘young’ zircon from the second zircon growth phase was sampled with CA-TIMS (DesOrmeau et al. 2017; Gordon et al. 2012), whereas the in situ measurements with SIMS (Monteleone et al. 2007) of the zircon inclusions in the garnet solely sampled ‘old’ zircon from the first growth phase. The zircon dated by LA-ICP-MS (Gordon et al. 2012) covers both the ‘young’ and the ‘old’ phases of zircon growth. By measuring different growth zones of the individual zircon grains using SHRIMP, we have been able to distinguish the separate zircon populations.
6.3 Comparison of the Zircon Ages With Ages of Other Minerals
A comparison of the zircon ages with published ages of the major mineral phases (Figure 11) can provide an indication of how the zircon is related to the main mineral assemblage. However, as different dating methods based on different isotope systems are compared here, direct comparison is limited. Discrepancies in the decay constants between individual systems or the use of different decay constants for the same system in different studies can lead to discrepancies in the resulting ages of ∼1.0% (e.g., Begemann et al. 2001; Kuiper et al. 2008).
At 9.83 Ma, the 40Ar/39Ar age of amphibole from PNG89321 (Baldwin et al. 1993) is the oldest recorded age of a major mineral in the coesite eclogite. This age is older than the ‘old’ zircon population reported here but within the range of the 238U/206Pb-207U/206Pb zircon ages calculated from the U–Pb data of Monteleone et al. (2007). However, Baldwin et al. (1993) interpreted this amphibole age as having been impacted by excess Ar. Our observation supports the assessment that the age is difficult to interpret and we offer the additional argument that amp1 contains inclusions of phases such as garnet and phengite that yielded ages younger than 9.83 Ma (see Section 3.2). In contrast, the published 40Ar/39Ar age of phengite of 7.93 ± 0.10 Ma was interpreted as a crystallization age (Baldwin and Das 2015), which is consistent with the age of the older grains of the ‘old’ zircon population. The phengite age is slightly older than the Lu-Hf garnet-whole rock isochron age of 7.1 ± 0.7 Ma, interpreted as the crystallization age of garnet (Zirakparvar et al. 2011). The age of garnet corresponds to the younger of our ‘old’ zircon but is also within error of the younger grains of the ‘mixed’ zircon age group. Based on Hf and Nd isotopic data, Zirakparvar et al. (2011, 2013) proposed that the coesite eclogite formed from a mantle-derived partial melt intruding subducted continental crust at UHP conditions. If this is the case, then the ‘old’ zircon and phengite were the first to crystallize from the melt. It was shown that zircon crystallization from mafic melt occurs locally in Zr-saturated zones at crystal-melt interfaces when the growth rate of the respective mineral exceeds Zr diffusion (Bea et al. 2022). Because the REE pattern of the ‘old’ zircon indicates it crystallized when garnet was absent or scarce, garnet must have crystallized right after the ‘old’ zircon and, based on its age, also after phengite. The nearly concordant crystallization age of phengite compared to garnet further demonstrates that the closure temperature of the K-Ar system in phengite must be significantly higher than the commonly adopted value of ~600°C (see Itaya 2020). Faryad et al. (2019) argued that the Lu-Hf ages of garnet below 8 Ma are the result of mixing of garnet core and rim; however, the ‘old’ zircon must then be older than 8 Ma. Theoretically, it is possible that the ‘old’ zircon is older than we can derive from our U–Pb dates, as in some cases, the size of the Ion beam of the SHRIMP was larger than the zircon core size apparent from CL imaging (Figure 6) and/or the ‘old’ zircon were subject to Pb loss during a phase of zircon resorption prior to the growth of the younger zircon rim. If the coesite eclogite did not crystallize from a mantle melt but instead was originally a mafic dyke or lense in the continental crust, then all the main mineral phases formed during prograde metamorphism, except amphibole (see Figure 4). In this scenario, the ‘old’ zircon would date the crystallization of the mafic dyke or lense prior to the crystallization of garnet at p < 0.5 GPa (Figure 4b), or the ‘old’ zircon was inherited. The ages of the ‘old’ zircon, garnet and phengite are very close to each other. We consider inheritance unlikely due to the small age difference between zircon and garnet and especially phengite. Similarly, it is unlikely that the ‘old’ zircon crystallized at a pressure below 0.5 GPa in a mafic dyke or lens. Pressure and temperature determinations using the garnet-pyroxene-phengite thermobarometer (Krogh Ravna and Terry 2004) indicate equilibration of the system at PT conditions between 2.7 ± 0.14 GPa and 685°C–717°C (Faryad et al. 2019) and 3.10 ± 0.32 GPa and 640°C ± 85°C (DesOrmeau et al. 2017), respectively. If the ‘old’ zircon formed at p < 0.5 GPa in the absence of garnet, the rock must have been subducted several tens of kilometres within a very short period of time, allowing garnet, omphacite and phengite to equilibrate at the given PT-conditions and have ages close to that of ‘old’ zircon. This is why we infer that the main mineral assemblage of the coesite eclogite did not form during prograde metamorphism but rather from a melt intruding subducted continental crust at UHP conditions as proposed by Zirakparvar et al. (2011, 2013) based on Hf and Nd isotopic data and that the ages of phengite and the ‘old’ zircon reflect the timing of the crystallization. In any case, the existence of the ‘old’ zircon supports the proposed extremely rapid exhumation rate of several cm/year of the coesite eclogite (e.g., Baldwin et al. 2008; DesOrmeau et al. 2017).
Of the two published Rb-Sr isochron ages for the coesite eclogite, only the younger, whole rock-amphibole-white mica (phengite) isochron age of 6.4 ± 1.3 Ma is realistic. The older omphacite-white mica isochron age of 11.7 ± 7.8 Ma (MSWD = 4.7) is not useful due to the high error and an MSWD > 2.57 and indicates a disturbance of the Rb-Sr isotopic equilibrium in the coesite eclogites during exhumation (Korchinski et al. 2014). Within uncertainty, the younger Rb-Sr age could be related to both the ‘young’ and ‘old’ zircon age. Korchinski et al. (2014) interpreted the age as an apparent white mica and amphibole growth age that occurred in the presence of fluid at HP conditions. Our petrological observations and phase equilibrium model indicate that amphibole amp1 was the last addition to the main mineral assemblage present at UHP conditions. Assuming that the ‘old’ zircon and phengite date peak pressure metamorphism or even crystallization prior to UHP metamorphism, we conclude that the average Rb-Sr whole rock-amphibole-white mica isochron of 6.4 Ma underestimates the actual age, which instead appears to lie on the older side of its error interval.
The ‘young’ zircon ages reported here are significantly younger than the ages of the main mineral assemblage determined using other dating methods. The REE pattern of the ‘young’ zircon suggests it formed when garnet was present. Because garnet was present during UHP conditions or even earlier, the ‘young’ zircon likely crystallized after the formation of the main mineral assemblage at shallower depths. This interpretation is supported by data from zircon of the quartzo-feldspathic host gneiss enclosing the coesite eclogite. Zircon U–Pb ages of 3.66 ± 0.13 Ma obtained by depth-profiling analyses (Zirakparvar et al. 2014) are younger than our ‘young’ zircon population, but within error of the youngest single-grain zircon age of 4.1 ± 1.3 Ma determined by LA-ICP-MS (Gordon et al. 2012). Based on the homogeneous age distribution in zircon from the host gneiss, in combination with heterogenous contents of Hf, Y and Ti within the grains, zircon growth in the host gneiss was interpreted to have occurred after UHP conditions but still in the eclogite facies and during subsequent retrogression (Zirakparvar et al. 2014). The younger age of the zircon from the host gneiss compared to our ‘young’ zircon might be related to the difference in bulk composition between the host gneiss and the coesite eclogite. The quartzo-feldspathic host gneiss has a higher SiO₂ and lower alkali content than the coesite eclogite (supplementary data of Zirakparvar et al. 2013). In zircon-melt systems with higher SiO₂ and lower alkali contents, zircon crystallizes at lower temperatures (Boehnke et al. 2013). This lower temperature occurred at a later stage of the exhumation of the coesite eclogite.
Assuming the coesite eclogite formed from a partial mantle melt and that the phase equilibrium model reliably predicted the main mineral assemblage, the following crystallization sequence during the main mineral growth phase under UHP conditions can be inferred based on the combination of mineral ages in the main mineral assemblage and petrological observations. Because the oldest ages were determined in phengite and ‘old’ zircon, it is likely that they were among the first minerals to crystallize from the melt dating the earliest stage of melt crystallization at UHP conditions. As the ‘old’ zircon exhibits steep MREE and HREE patterns, this must have occurred when garnet crystallization was still in its initial stages. No age information is available for coesite, omphacite and rutile, making it impossible to determine the exact timing of their crystallization. However, petrographic observations indicate that garnet, omphacite, phengite and the SiO₂ phase contain mutual inclusions, suggesting that these minerals crystallized simultaneously for some time at least. Amphibole amp1 likely formed towards the end of the formation of the main mineral assemblage. Supporting evidence includes its poikiloblastic texture, which encloses all other minerals, as well as the age of the Rb-Sr amphibole-whole-phengite isochron, which is younger than the garnet but older than the ‘young’ zircon age determined here. The growth of the ‘young’ zircon, on the other hand, likely occurred during exhumation, when garnet and the rest of the main mineral assemblage was already present in the rock, as is evident from the flatter MREE and HREE patterns in the ‘young’ zircon. However, crystallization took place before the breakdown of omphacite to plagioclase, as neither the ‘old’ nor the ‘young’ zircon exhibits a negative Eu anomaly.
6.4 Zirconium Source for ‘Young’ Zircon Growth
In order for zircon to form, sufficient Zr has to be available. Assuming no external Zr was introduced to the coesite eclogite, Zr had to be liberated during retrogression from phases of the UHP mineral assemblage to enable the ‘young’ zircon to crystallize. The Zr source(s) of the second phase of zircon growth cannot be precisely identified. However, predictions can be made based on the petrological observations in PNG89321d and the evolution of modal abundances of the Zr-bearing phases predicted by the phase equilibrium model on the exhumation PT trajectory. Figure 12 shows the paragenesis of the minerals in the coesite eclogite, based on the petrographic and mineral chemical data. Kohn et al. (2015) identified the most important Zr-bearing minerals in metamorphic systems besides zircon. In general, retrograde phases can be excluded as potential Zr sources, as retrograde phases do not break down to release Zr but might rather take up Zr. Thus, biotite, paragonite, feldspar, amphibole amp2, ilmenite and the iron oxides are not potential Zr sources. Of the main mineral assemblage of PNG89321d amphibole amp1, omphacite, garnet and rutile are potential Zr-bearing minerals, whereas quartz/coesite and phengite have no influence on the Zr whole rock mass balance. Although amp1 contains 2.5 ± 0.6 ppm Zr (Table 1), it is not a viable Zr source because amp1 remained stable and should have increased in modal abundance during exhumation (Figure 4c).
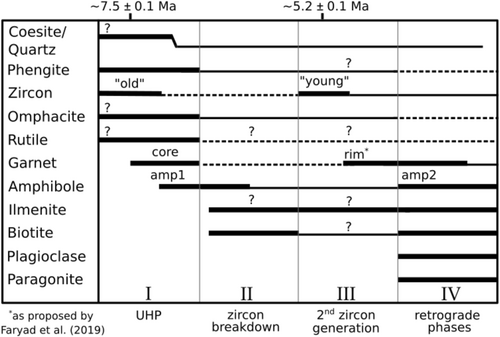
The opposite is true for garnet and omphacite; according to the phase equilibrium model, the modal abundances of these phases decreased in the course of exhumation (Figure 4a,b). Garnet was partially resorbed, which could, in principle, have released Zr for zircon formation. An argument against garnet as Zr source is the low content and variation of Zr in garnet of an average of 0.7 ± 0.4 ppm. We do note that the coesite eclogite contains so little zircon (see Section 3.1) that even the smallest amount of available Zr might have been enough to facilitate the limited zircon formation. In contrast to garnet, omphacite contains an average of 3.94 ± 0.33 ppm Zr, more than five times as much, and partially broke down during retrogression reflected in the formation of amp2-plagioclase-symplectites (Figures 2b and 4a). If Zr was released due to omphacite breakdown, it provided a sufficient amount to enable zircon growth (see Kohn et al. 2015). The positive Eu anomaly, Eu/Eu* = 1.47–1.71, of zircon, independent of the age of zircon is, however, an argument against omphacite as a Zr source. Omphacite breaks down to plagioclase, which is a sink for Eu2+ (Holder et al. 2020 and references therein); accordingly, if the omphacite breakdown facilitated the zircon growth, a negative Eu anomaly would be expected in the ‘young’ zircon. Because this is not the case, we infer that omphacite breakdown occurred only after the ‘young’ zircon had already formed, making garnet a more likely source of Zr than omphacite.
Another possible Zr source for the growth of the second zircon generation is rutile. Similar to omphacite, rutile breaks down during exhumation, as indicated by ilmenite formation in and at the grain boundaries of rutile. Although we do not observe evidence for zircon growth at the edges of rutile remnants, as described in the literature (Kohn and Kelly 2018), the formation of retrograde phases after rutile indicates the liberation of Zr. In addition, the computed volume isopleths (Figure 4f) of rutile indicate the breakdown of rutile during decompression. As rutile in Sample PNG89321c contains 299 ± 3 ppm Zr (n = 232; Osborne et al. 2019), even limited rutile breakdown, with only a fraction of the released Zr escaping incorporation into newly formed ilmenite, could provide a significant Zr source despite the low modal abundance of rutile. Further, we cannot exclude from petrological observations that the ‘old’ zircon served as a Zr source for the second zircon growth phase but found no evidence supporting this possibility either. Accordingly, based on the petrographic evidence, we consider rutile to be the most likely source of Zr for the growth of the second zircon generation.
The PT conditions at which this second zircon generation crystallized cannot be deduced from our observations. Thermodynamic modelling for the rims of garnet from Sample PNG89321 shows that they must have formed at higher temperatures and lower pressure than the inner zones of the garnet formed under UHP conditions (Faryad et al. 2019). Modelling of the Zr mass balance of metabasites, on the other hand, showed that temperature increase in combination with pressure reduction leads to the dissolution of zircon (Kohn et al. 2015). As a result, it is not feasible to assess whether significant variations in exhumation rates of this ultrayoung coesite eclogite occurred during exhumation. It is clear, though, that using ‘young’ ages in conjunction with peak pressure conditions would overestimate average exhumation rates.
7 Conclusions
By integrating a phase equilibrium model using XRF-derived bulk rock compositional data with petrographic observations of the UHP mineral paragenesis of garnet, omphacite, amphibole, coesite, phengite and rutile and the chemical composition of unaltered garnet, we propose that the main mineral assemblage of the coesite eclogite PNG89321 formed at UHP conditions of p = 3.5 ± 0.2 GPa and T = 690°C ± 40°C. Zircon U–Pb SHRIMP ages imply two distinct zircon growth phases. The ages of zircon of the first growth phase range between 7.0 ± 0.2 Ma and 7.9 ± 0.3 Ma (2σ), with the main phase of formation occurring between 7.4 and 7.6 Ma (avg = ~7.5 ± 0.1 Ma). The majority of this first zircon generation is present in relict cores. A second zircon growth phase occurred mainly between 5.1 and 5.3 Ma ago (avg = 5.2 ± 0.1 Ma), with zircon ages ranging between 4.4 ± 0.3 Ma and 5.5 ± 0.4 Ma (2σ). The first zircon generation has steep MREE and HREE patterns, implying zircon growth when garnet was scarce or absent. The oldest zircon grains of the first generation seem to date the earliest UHP conditions when the minerals of the coesite eclogite started to crystalize from a melt, slightly preceeding garnet and amphibole. The second zircon generation shows in comparison flatter MREE and HREE patterns and crystallized after the formation of the UHP mineral assemblage in the presence of garnet. Retrograde breakdown of rutile is the most likely Zr source to facilitate the second zircon growth phase, with possible minor contributions from garnet and omphacite. Identification of multiple growth phases and linking them to PT conditions is key to enable calculations of exhumation rates, as the youngest zircon growth phase clearly occurred after peak UHP conditions.
Acknowledgements
We thank Helen de Waard (LA-ICP-MS) and Tilly Bouten and Eric Hellebrand (EPMA) from the Geolab at the Utrecht University for assisting with analytical work. We also would like to thank Roel van Elsas for zircon separation and Bouke Laçet for thin section preparation. This research is supported by Grant ALWOP.608 of the Dutch Science Foundation (NWO). SHRIMP analyses at KBSI were supported by the European Union Horizon 2020 research and innovation programme under Grant Agreement No. 871149. We also appreciate the constructive feedback from the reviewers Hao Cheng and Hafiz Rehman, the handling editor Chunjing Wei and the editor Richard White. Additionally, we thank Chris Mattinson and Pieter Vroon for their feedback on the PhD thesis chapter that formed the basis of this manuscript.
Conflicts of Interest
The authors declare no conflicts of interest.
Open Research
Data Availability Statement
The data that support the findings of this study are available in the Supporting Information.


