Two Tertiary metamorphic events recognized in high-pressure metapelites of the Nevado-Filábride Complex (Betic Cordillera, S Spain)
Abstract
Two phengite–garnet-bearing metapelites from the Nevado-Filábride Complex, Betic Cordillera, one from the Ragua unit (sample 23085) and the other (sample 23098) from the Calar Alto unit, were studied in detail to elucidate their metamorphic evolution. We calculated various P–T pseudosections for different O2 and H2O-CO2 contents and Fe3+/Fe2+ ratios with PERPLE_X . On the basis of the compositions of the garnet core and the highest Si content in potassic white mica, different peak pressures of 12.7 ± 0.7 kbar at 525 ± 10°C (23085) and 17.4 ± 1.2 kbar at 526 ± 17°C (23098) resulted (errors refer to an estimated 1σ range). The suggested clockwise P–T loop was followed in both cases by another loop caused by a reheating process. On the basis of garnet rim compositions, peak temperatures of 596 ± 10°C at 10.7 ± 1.4 kbar (23085) and 629 ± 11°C at 8.5 ± 0.7 kbar (23098) resulted, supported by Zr-in-rutile thermometry (23085: 591 ± 11°C; 23098: 607 ± 10°C). In situ dating of monazite (23085) with the electron microprobe yielded ages between c. 48 and 14 Ma. On the basis of the monazite composition and histogram analysis, two age populations with mean ages of 40.2 ± 1.7 (1σ) and 24.1 ± 0.8 Ma could be defined. Low Y2O3 contents (<0.6 wt%) in monazite point to its formation after initial growth of garnet. The older generation was therefore assigned to the formation of the garnet core and the early P–T loop. The younger monazite population was related to the late P–T loop. A geodynamic scenario is hypothesized that assigns the Eocene metamorphism to subduction of a continental margin to depths of 50–65 km, followed by exhumation in an exhumation channel accompanied by mixing of slices of different rock types including mantle rocks. This process ended with stacking of such slices causing reheating of the studied rocks in the Early Miocene. The noted time gap of c. 15 Ma between subduction and nappe stacking is similar to the continent–continent collisional orogeny of the Himalaya.
1 INTRODUCTION
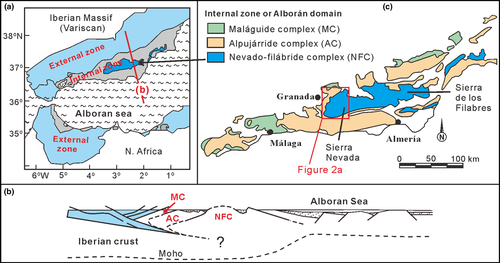
In order to reconstruct mountain-building processes resulting from continent–continent collision, one of the key tasks is to unravel the pressure (P)–temperature (T)–time (t) paths for metamorphic rocks in crystalline areas, that are usually exposed after significant denudation of the orogenic chain formed by this collision. Precise P–T–t trajectories that were, for example, recently derived for the Central Himalaya have significantly contributed to the understanding of the tectonic history of this mountain chain (Carosi et al., 2016; Iaccarino et al., 2015; Leloup et al., 2015; Shrestha, Larson, Guilmette, & Smit, 2017; Wang, Rubatto, & Zhang, 2015). The Betic Cordillera in southern Spain is, in fact, not only a much smaller orogenic chain but it also formed in the Tertiary, being the result of the collision of the African plate and the southwestern edge of the Eurasian plate (DeMets, Gordon, & Argus, 2010; Koulali et al., 2011; Pla-Pueyo, Viseras, Soria, Tent-Manclús, & Arribas, 2011; Platt, Behr, Johanesen, & Williams, 2013). However, the evolution of this orogenic chain is less well understood than that of the Himalaya. For instance, the Ragua unit in the Nevado-Filábride Complex (NFC) was rarely addressed in petrological studies and a high pressure (HP: >10 kbar) imprint has never been clearly demonstrated. We have studied rocks from the NFC, which represents the lowest part of the nappe stack of the Betic Cordillera (Figure 1) that, like the central Himalaya, exposes crystalline rocks in its central axis.
The NFC is characterized by HP metabasites (Bodinier, Morten, Puga, & Díaz de Federico, 1987; Gómez-Pugnaire & Fernández Soler, 1987; Gómez-Pugnaire, Visona, & Franz, 1985; Morten, Bargossi, Martínez-Martínez, Puga, & Díaz de Federico, 1987; Puga, Nieto, & Díaz de Federico, 2000; Ruiz-Cruz, Sanz de Galdeano, & Santamaría, 2015), metasediments (Augier, Booth-Rea, et al., 2005; Augier, Jolivet, & Robin, 2005; Booth-Rea, Martínez-Martínez, & Giaconia, 2015; Gómez-Pugnaire & Franz, 1988; Ruiz-Cruz et al., 2015) and orthogneisses (Gómez-Pugnaire et al., 2004; Ruiz-Cruz et al., 2015). The timing of HP metamorphism in the NFC is still currently debated, due to conflicting geochronological data using different methods. One group of researchers asserts that the HP metamorphism in the NFC occurred before 40 Ma according to Ar-Ar dating on phengite (Augier, Agard, et al., 2005; Monié, Galindo-Zaldivar, González Lodiero, Goffé, & Jabaloy, 1991). Other researchers believe that younger ages (<20 Ma) are related to the HP metamorphism in the NFC. These younger ages are supported by Lu-Hf garnet dating (18–14 Ma: Platt, Anczkiewicz, Soto, Kelley, & Thirlwall, 2006), U-Pb dating on zircon (17–15 Ma: Gómez-Pugnaire et al., 2012; López Sánchez-Vizcaíno, Rubatto, Gómez-Pugnaire, Trommsdorff, & Müntener, 2001) and multimineral 87Rb/86Sr isochron dating (20–13 Ma) by Kirchner, Behr, Loewy, and Stockli (2016). Although Kirchner et al. (2016) favoured the younger dates (<20 Ma), they questioned the correlation between metamorphism and Lu-Hf dating of garnet and zircon because (1) the Lu-Hf system can be problematic due to trace mineral inclusions, multiple stages of garnet growth or disequilibria due to incomplete isotopic homogenization, and (2) zircon may not grow during all metamorphic events.
We present new metamorphic data on HP metasedimentary rocks of the NFC. These data include ages obtained by in situ U-Th-Pb monazite dating using the electron microprobe (EMP). This method, combined with the P–T determination using, for instance, the changing chemical composition of garnet from core to rim, has been shown to be particularly useful to derive P–T–t paths of Ca-poor, medium-grade metasedimentary rocks (e.g. Lo Pò et al., 2016; Massonne, 2014, 2016a; Massonne, Cruciani, Franceschelli, & Musumeci, 2018). These methods were applied to constrain a P–T path relating the HP metamorphism in the NFC to an Eocene event (>40 Ma) in contrast to previous views (see references in Section 2.2), which suggested that this metamorphism took place in the late Oligocene–Miocene. However, this period is referred to here as a second metamorphic event interpreted to be caused by nappe stacking.
2 GEOLOGICAL SETTING
2.1 Betic Cordillera
The Betic Cordillera in southern Spain, representing the westernmost portion of the Alpine orogenic belt, was formed by continent–continent collision. Two major zones in the Betic Cordillera are designated (Figure 1a): the non-metamorphic external zone and the predominantly metamorphic internal or Betic zone (also called: Alborán domain; Bodinier et al., 1987; Weijermars, 1991). The External zone corresponds to the folded and detached sedimentary cover of the southern Iberian margin deposited during the Mesozoic and part of the Cenozoic (Sanz de Galdeano & Alfaro, 2004). The Alboran domain is considered as a collisional belt that underwent a large-scale gravitational collapse during late orogenic phases, that is contraction was followed by an orogenic extension (Balanyá, García-Dueñas, Azañón, & Sánchez-Gómez, 1997; García-Dueñas, Balanyá, & Martínez-Martínez, 1992; Platt et al., 2006). This domain is an allochthonous terrane (Sanz de Galdeano & Vera, 1992) with subducted rocks of thinned continental and oceanic material that originally resided between Eurasia and Africa prior to their convergence. Presently, most of the Alborán domain is believed to be beneath the Alboran Sea (Figure 1a), but its outer margins are exposed along the southern coast of Spain and the northern coast of Morocco (Behr & Platt, 2012; García-Dueñas et al., 1992).
The Alborán domain is traditionally subdivided into nappe complexes that include the NFC, Alpujárride Complex (AC) and Maláguide Complex (MC) in ascending order (Figure 1b,c) (Booth-Rea, Azañón, & García-Dueñas, 2004; Booth-Rea, Azañón, Martínez-Martínez, Vidal, & García-Dueñas, 2005; Rodríguez-Fernández, Azor, & Miguel Azañón, 2012). However, some geoscientists exclude the NFC from the Alborán domain (e.g. Booth-Rea et al., 2015), because recent work showed that the NFC and AC yielded different metamorphic ages (e.g. Kirchner et al., 2016: <20 Ma for the NFC and c. 50 Ma for the AC). Similar zircon ages between NFC and the Iberian massif basement suggest that the NFC could be formed by rocks of the subducted south Iberian margin (Gómez-Pugnaire et al., 2012). The present-day contacts of NFC and AC are extensional detachments and low-angle normal faults that formed during late exhumation processes (e.g. Agard, Augier, & Monié, 2011; Aldaya et al., 1991; Fernández-Fernández, Jabaloy-Sánchez, Nieto, & González-Lodeiro, 2007; Jabaloy, Galindo-Zaldívar, & González-Lodeiro, 1993; Lonergan & Platt, 1995).
The AC and NFC were metamorphosed during the Alpine orogeny, when their current structure was formed (Platt, Kelley, Carter, & Orozco, 2005; Platt et al., 2006). The AC most clearly shows a complex metamorphic history, involving early HP–low-temperature (LT) metamorphism associated with subduction and accretion, followed by an evolution at low pressures and locally very high temperatures (Massonne, 2014; Platt et al., 2013 for a summary). The MC, characterized by extended Palaeozoic and local Mesozoic and Tertiary rocks, was only slightly affected by the Alpine metamorphism (Abad, Nieto, Peacor, & Velilla, 2003).
2.2 The Nevado-Filábride complex
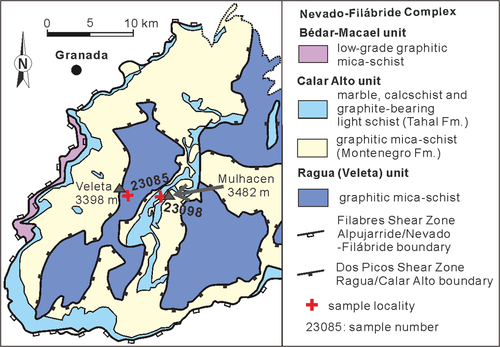
Due to the scarcity of stratigraphic marker horizons in the NFC, the number and precise location of tectonic subunits remain controversial (Aerden & Sayab, 2008), although the order of these subunits is well known. Presently, two unit divisions of the NFC are used widely. One division concerns the Mulhacén and underlying Veleta units and is based either on an erosion surface between the two units, that is overlain by conglomerates (Sanz de Galdeano, López-Garrido, & Santamaría-López, 2016), or ophiolites only existing in the Mulhacén unit (Puga et al., 2017). The other division includes (from bottom to the top) the Ragua (or ~Veleta), the Calar Alto (or ~lower part of Mulhacén) and the Bédar-Macael (or ~upper part of Mulhacén) units and differences in metamorphic features (Martínez-Martínez, Soto, & Balanyá, 2002) and were, thus, adopted by us (Figure 2). In addition, the presence of the Dos Picos shear zone between the Ragua and the Calar Alto units makes the second division more reasonable (Augier, Booth-Rea, et al., 2005; Booth-Rea et al., 2015).
Pre-Alpine metamorphic events have been overprinted extensively by Alpine metamorphic assemblages in the NFC (Puga, Díaz de Federico, & Nieto, 2002). The two upper units (Calar Alto and Bédar-Macael) are characterized by higher metamorphic P–T conditions than those determined for the Ragua unit (Augier, Booth-Rea, et al., 2005; Booth-Rea, Azañón, & Martínez-Martínez, 2003; de Jong, 1993a; Kirchner et al., 2016; Vázquez, Jabaloy, Barbero, & Stuart, 2011). The structural thicknesses of the Ragua, Calar Alto and Bédar-Macael units are in the order of 6, 2 and 1 km (Martínez-Martínez & Azañón, 1997) or 4, 4.5 and 0.6 km (Augier, Agard, et al., 2005) respectively. The relevant rock sequences of these units following the detailed summaries in Augier, Agard et al. (2005), Behr and Platt (2012), Booth-Rea et al. (2015) and Jabaloy-Sánchez, Gómez-Pugnaire, Padrón-Navarta, López Sánchez-Vizcaíno, and Garrido (2015) are (1) Palaeozoic graphitic mica-schists with minor intercalated quartzites and rare lenses of graphitic marble in the Ragua unit, (2) similar rocks (Montenegro Formation) with a higher grade of metamorphic recrystallization capped by ~1,500 m of light-coloured schists with low amounts of graphite, quartzites and meta-conglomerates of probable Permo-Triassic age (Taha Formation) and a Triassic marble and calcschist sequence being up to 150 m thick of the Calar Alto unit, and (3) several thrust sheets and fold nappes being consistent with those of the Calar Alto unit, but significantly thinner in the Bédar-Macael unit. The latter unit was locally intruded by Permian granites that are metamorphosed. A discontinuous set of lenses and pods of metabasic and meta-ultrabasic rocks occurs within the Bedar-Macael and the upper part of the Calar Alto units, including along the contact between these units.
The HP metamorphism in the Calar Alto and Bédar-Macael units developed at eclogite facies conditions of 15–25 kbar and 500–750°C for ultrabasic and basic rocks (Augier, Agard, et al., 2005; Jabaloy-Sánchez et al., 2015; López Sánchez-Vizcaíno et al., 2001; Platt et al., 2006; Puga, Nieto, Díaz de Federico, Bodinier, & Morten, 1999; Puga et al., 2000; Ruiz-Cruz et al., 2015), and at 10–20 kbar and 450–590°C for metapelites (Augier, Agard, et al., 2005; Bakker, de Jong, Helmers, & Biermann, 1989; Booth-Rea et al., 2015; Ruiz-Cruz et al., 2015), or higher temperatures of 651 ± 117°C at 14.1 ± 2.8 kbar (Gómez-Pugnaire et al., 2004). The distinct peak-P conditions of different rock types were explained by their juxtaposition after peak metamorphism (Jabaloy-Sánchez et al., 2015). The geometries of the P–T trajectories for the decompression stage of the metapelites are contrasting, including isothermal (Augier, Agard, et al., 2005; Jabaloy-Sánchez et al., 2015) and reheating (Bakker et al., 1989; Booth-Rea et al., 2015) paths.
The Ragua unit at the base of the NFC was initially supposed to have experienced Alpine metamorphism at intermediate-pressure amphibolite facies and subsequent greenschist facies conditions (de Jong, 1993a; Puga et al., 1999, 2002). More recently, HP metamorphism was identified with a peak-P of 11.5–13 kbar at 400–530°C (Aerden et al., 2013; Augier, Booth-Rea, et al., 2005; Booth-Rea et al., 2003). The inverted metamorphic peak pressures from the lowest to the highest unit of the NFC are ascribed to the increasing subduction depths of these units. The generally inverted temperature gradient was interpreted to have formed (1) during subduction of the NFC beneath the hot AC (Behr & Platt, 2012), or (2) resulting from a late-stage thermal overprint (Bakker et al., 1989) related to either reheating by internal shear, fluid flow or heat transport from above (Aerden et al., 2013) during emplacement of the AC, or (3) upwelling of hot mantle material and associated magmatism during tectonic extension and crustal shortening (de Jong, 1993a, 1993b, 2003), or (4) just because of a simple relation that pressure is higher at higher temperature if rocks equilibrated along a single geothermal gradient.
Monié et al. (1991) published an age of 50–48 Ma obtained from 40Ar/39Ar geochronology as a minimum age of the HP event in the Mulhacén nappe (samples were either from the Calar Alto unit or Bédar-Macael unit), but did acknowledge the possibility of excess argon. In contrast, de Jong, Wijbrans, and Feraud (1992) reported 40Ar/39Ar step-heating ages of 31–30 Ma for the core and 26–25 Ma for the rim of phengite from HP (up to 10.5 kbar) gneiss of the Mulhacén nappe. Augier, Agard, et al. (2005) applied the same method on phengite grains located in various microstructural domains in the Calar Alto and Bédar-Macael units. They reported the metamorphism took place between 44 and 8 Ma, with the HP event between 44 and 30 Ma, and in any case before 20 Ma. However, Behr and Platt (2012) argued that the Ar method is not suitable for the dating of NFC rocks, because excess Ar occurred in white mica from rocks of the NFC but not in those of the overlying AC, for the reason that excess Ar could have resulted from rapid cooling and high P/T ratios during metamorphism. Younger HP metamorphism was also suggested from Lu-Hf (18–14 Ma: Platt et al., 2006), U-Pb (c. 15 Ma: López Sánchez-Vizcaíno et al., 2001 and 16.5–17 Ma: Gómez-Pugnaire et al., 2004, 2012), and multimineral 87Rb/86Sr isochron (20–13 Ma: Kirchner et al., 2016) dating methods.
3 ANALYTICAL METHODS
Bulk-rock compositions for pseudosection modelling were obtained with a PHILIPS PW2400 X-ray fluorescence (XRF) spectrometer. The analytical procedure is described by Massonne (2016a). Rock powder of the samples was analysed for total carbon and water contents with a LECO® RC-412 analyser. The analytical results are given in Table S1.
Chemical compositions of minerals were obtained by using a CAMECA SX100 EMP with five wavelength-dispersive spectrometers. Contents of Na, K, Mg, Ca, Fe, Al, Si, Mn, Ti and Ba in silicates were quantitatively determined. The conditions for the analyses were 15 kV acceleration voltage, 10 (hydrous minerals, plagioclase) or 15 nA beam current and 20 s counting time per element on peak and background each (for analytical errors see Massonne, 2012). For carbonate minerals, contents of Mg, Ca, Fe, Mn and Sr (C was calculated) were determined at 15 kV acceleration voltage and 5 nA beam current. The mineral formulae and the molar fractions of components from EMP analyses were calculated with the program CALCMIN (Brandelik, 2009).
For rutile, the contents of Nb, Si, Fe, Zr and Cr (Ti was calculated) were achieved with a beam current and acceleration voltage of 150 nA and 15 kV respectively. The counting time for the Zr Lα-radiation, using natural zircon as standard, at the peak and the background was 360 s each. According to counting statistics, the analytical 1σ-error was ±18 ppm for Zr. When SiO2 contents were above 0.3 wt%, the corresponding analyses were discarded as these data were probably influenced by nearby silicates (Zack, Moraes, & Kronz, 2004). In cases of Fe2O3 contents above 0.6 wt%, the analyses were also abandoned, because ilmenite, a replacement product of rutile, could have disturbed the results.
The analytical procedure to determine the composition and age of monazite with the EMP was described by Massonne et al. (2018) and Massonne, Dristas, and Martínez (2012). This procedure resulted in a good agreement with monazite and zircon ages obtained by mass spectrometric methods (see Massonne, 2014, 2016a; Massonne et al., 2018; van Leeuwen et al., 2016; Waizenhöfer & Massonne, 2016). A wide range of elements (Si, P, S, Ca, Y, La, Ce, Pr, Nd, Sm, Eu, Gd, Pb, Th and U) was analysed in situ on thin sections which were hand-polished with polycrystalline diamond (size ~1 μm). A beam current of 150 nA was employed. The 1σ uncertainty was calculated by propagation of the 1σ errors of the counting rates of the peak and background intensities of the relevant elements. The detection limit (3σ) for Pb related to the single analysis is ~50 ppm. As monazite compositions in the studied sample contains 2.9–6.2 wt% ThO2, a 1σ error between 3.4 and 9.1 Ma resulted for the single analysis. The age and corresponding error of all monazite analyses were calculated with the Mincalc program (Bernhardt, 2007). Mean ages and errors of monazite populations were determined with the ISOPLOT program by Ludwig (2003).
Back-scattered electron (BSE) images were taken with the EMP to document specific textural features. X-ray maps for garnet and potassic white mica were also produced with the EMP. The elements Mn, Ca, Mg, Fe and Y were considered for the simultaneous production of X-ray maps of garnet using 15 kV accelerating voltage and 60 nA beam current. X-ray maps for potassic white mica (Mg, Fe, Ti, Na, Ba) were produced with 15 kV accelerating voltage and 30 nA beam current. Other parameters for the X-ray mapping were 3–6 μm step width and 70–100 ms per step for garnet and 2 μm step width and 100 ms per step for white mica.
4 PETROGRAPHY AND MINERAL CHEMISTRY
The mica-schists studied in detail were sampled near the Cerro de los Machos in the Calar Alto unit (sample 23085, coordinates: 37°3′22″N, 3°21′39″W) and at Laguna de la Caldera in the Ragua unit (sample 23098, coordinates: 37°3′21.5″N, 3°19′43.5″W), ~3 km east of the locality of sample 23085 (Figure 2).
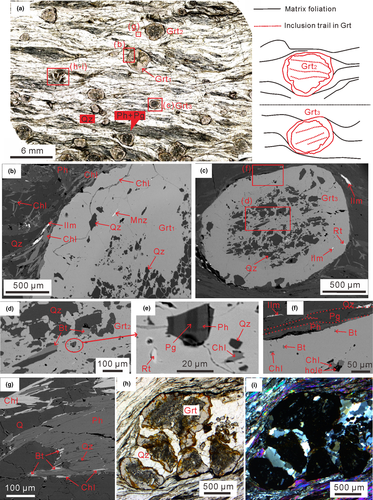
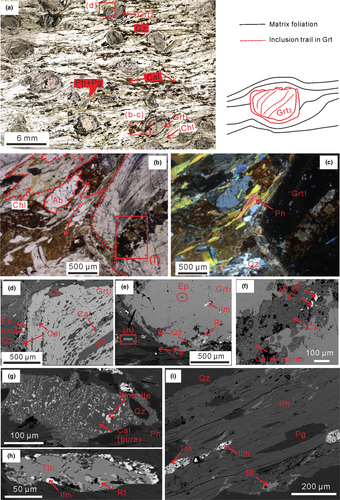
Photomicrographs of thin sections of the two samples are shown in Figures 3 and 4. Representative EMP analyses of minerals in the rocks except rutile (see section 6) and monazite (section 7) are given in Table 1 (garnet) and Tables S2 and S3 (other minerals in samples 23085 and 23098). Mineral abbreviations used in the text, figures and tables are those given by Whitney & Evans (2010). In addition, Carb was taken as abbreviation for calcite group minerals with magnesite-siderite-calcite-rhodochrosite components. For the subsequent description of the chemical compositions of minerals, we used the contents of elements per formula unit (pfu) and the following parameters: (1) XMg = Mg/(Mg+Mn+Fe) for chlorite, (2) XMg = Mg/(Mg+Fe) for biotite, (3) Xpar = (Na/(Ca+Ba+Na+K) for paragonite, (4) XNa = Na/(Na+K+Ca) in albite, and (5) Xpis (pistacite component in Ep) = Fe/(Fe+Al). The volume proportions of minerals (vol%) were estimated from thin section by point counting using an optical microscopy.
| Sample | 23085 | 23098 | ||||||
|---|---|---|---|---|---|---|---|---|
| Inner core | Outer core | Inner rim | Outer rim | Inner core | Outer core | Inner rim | Outer rim | |
| SiO2 | 35.92 | 36.09 | 36.15 | 36.46 | 36.20 | 36.24 | 36.41 | 37.35 |
| TiO2 | 0.16 | 0.10 | 0.07 | 0.04 | 0.15 | 0.11 | 0.05 | 0.05 |
| Al2O3 | 20.60 | 20.68 | 20.67 | 21.16 | 20.86 | 21.02 | 20.87 | 21.28 |
| Cr2O3 | 0.02 | 0.02 | 0.01 | 0.01 | 0.01 | 0.06 | 0.03 | 0.02 |
| Fe2O3 | 1.13 | 1.04 | 0.85 | 0.65 | 0.93 | 0.71 | 1.13 | 0.74 |
| FeO | 29.11 | 33.13 | 36.99 | 38.76 | 29.87 | 29.11 | 28.36 | 28.86 |
| MnO | 2.69 | 1.22 | 1.40 | 0.18 | 1.47 | 0.55 | 0.68 | 0.68 |
| MgO | 0.70 | 1.07 | 1.55 | 3.25 | 0.89 | 1.62 | 1.71 | 1.93 |
| CaO | 9.39 | 6.92 | 2.84 | 0.69 | 9.69 | 10.03 | 10.58 | 10.11 |
| Na2O | 0.00 | 0.01 | 0.02 | 0.00 | 0.00 | 0.03 | 0.01 | 0.03 |
| Total | 99.73 | 100.27 | 100.54 | 101.21 | 100.08 | 99.48 | 99.83 | 101.04 |
| Si | 5.71 | 5.74 | 5.78 | 5.73 | 5.72 | 5.72 | 5.72 | 5.82 |
| Ti | 0.02 | 0.01 | 0.01 | 0.00 | 0.02 | 0.01 | 0.01 | 0.01 |
| Al | 3.86 | 3.87 | 3.90 | 3.92 | 3.89 | 3.91 | 3.86 | 3.91 |
| Cr | 0.00 | 0.00 | 0.00 | 0.00 | 0.00 | 0.01 | 0.00 | 0.00 |
| Fe3+ | 0.14 | 0.12 | 0.10 | 0.08 | 0.11 | 0.08 | 0.13 | 0.09 |
| Fe2+ | 3.87 | 4.40 | 4.95 | 5.10 | 3.95 | 3.84 | 3.72 | 3.76 |
| Mg | 0.17 | 0.25 | 0.37 | 0.76 | 0.21 | 0.38 | 0.40 | 0.45 |
| Ca | 1.60 | 1.18 | 0.49 | 0.12 | 1.64 | 1.69 | 1.78 | 1.69 |
| Mn | 0.36 | 0.16 | 0.19 | 0.02 | 0.20 | 0.07 | 0.09 | 0.09 |
| Na | 0.00 | 0.00 | 0.01 | 0.00 | 0.00 | 0.01 | 0.00 | 0.01 |
| Py | 0.03 | 0.04 | 0.06 | 0.13 | 0.04 | 0.06 | 0.07 | 0.07 |
| Grs+Adr | 0.27 | 0.20 | 0.08 | 0.02 | 0.27 | 0.28 | 0.30 | 0.28 |
| Sps | 0.06 | 0.03 | 0.03 | 0.00 | 0.03 | 0.01 | 0.02 | 0.01 |
| Alm | 0.65 | 0.73 | 0.83 | 0.85 | 0.66 | 0.64 | 0.62 | 0.63 |
4.1 Metapelite 23085
Metapelite 23085 is a fine-grained and strongly foliated schist (Figure 3a) consisting of quartz (45 vol%), potassic white mica (30 vol%), garnet (8 vol%), paragonite (10 vol%), chlorite (4 vol%) and biotite (1.5 vol%). Accessories are graphite, tourmaline, apatite, rutile, ilmenite, zircon, monazite, allanite and Fe-oxides. Layers (width up to ~3 mm) of oriented white mica and chlorite define the main foliation (Figure 3a). Quartz layers (width up to ~2 mm) alternate with phyllosilicate layers (Figure 3a). These layers are slightly folded influenced by ductile shearing.
Most garnet grains occur as euhedral or rounded porphyroblasts (1–3 mm in diameter) with an inclusion-rich inner core and outer core and a rim containing less inclusions (Figure 3a–c). These inclusions are (1) apatite, biotite (XMg = 0.48–0.55; Si = 2.81–2.85 pfu), chlorite (XMg = 0.27–0.55), paragonite (Xpar = 0.89–0.92), potassic white mica (Si = 3.06–3.11 pfu), rutile, ilmenite and quartz in the inner core (Figure 3c–e), (2) apatite, chlorite (XMg = 0.24–0.53), rutile, ilmenite and quartz in the outer core, (3) ilmenite, rutile and quartz in the inner rim, and (4) biotite (only one analysis: XMg = 0.42; Si = 2.76 pfu), chlorite (XMg = 0.24–0.50), ilmenite, rutile and quartz in the outer rim (Figure 3c,f). In addition, some garnet grains have been broken after the growth of the core. The fragments are elongated along the foliation and overgrown by the garnet rim (Figure 3h,i).
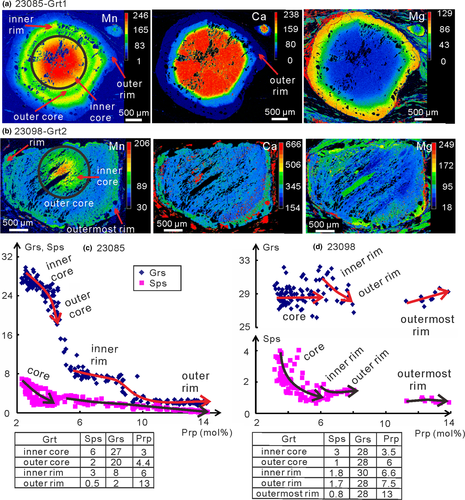
Porphyroblastic garnet exhibits a compositional zonation (Figure 5a,c) with an increase in pyrope and a decrease in grossular (+andradite) from core (the average compositions for the inner core: Alm64Prp3Grs27Sps6, outer core: Alm73.6Prp4.4Grs20Sps2) to rim (inner rim: Alm83Prp6Grs8Sps3, outer rim: Alm84.5Prp13Gros2Sps0.5). However, this chemical trend does not reflect a continuous change in the garnet composition. At the boundary between core and rim a significant change especially of the Ca content was noted (Figure 5). In addition, elemental maps show no idiomorphic shape of the garnet core and, locally, embayments into the core domain suggesting a minor corrosion event before the growth of the rim. In general, spessartine shows a similar tendency as grossular, but the spessartine content of the inner rim is somewhat higher than that in the outer core. The compositions of the (elongated and) smaller garnet grains are equivalent to those of the outer core and rim of the porphyroblastic garnet.
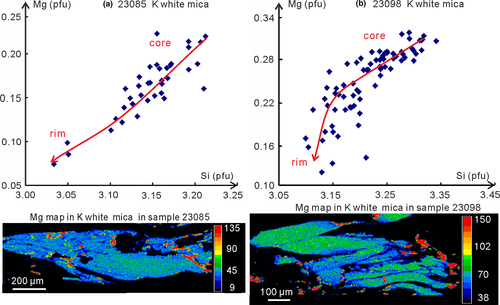
Oriented potassic white mica in the matrix shows a zonation with Si between 3.14 and 3.21 pfu in the core and 3.03–3.14 pfu in the rim (Figure 6a). Paragonite is characterized by Xpar = 0.92–0.95. Tiny anhedral biotite (XMg = 0.42–0.45; Si = 2.77–2.85 pfu) irregularly replaced white mica at grain boundaries (Figure 3g). Oriented chlorite (Figure 3g) shows a narrow compositional range with XMg = 0.40–0.42. Most ilmenite occurs in garnet as a single grain (Figure 3c), but locally has replaced outer parts of rutile enclosed in the garnet rim. Ilmenite was found in the matrix as single grains or replacing rutile (Figure 3b,c). Allanite partially replaced monazite in the matrix.
4.2 Calcite-bearing metapelite 23098
Metapelite 23098 is mineralogically and texturally similar to sample 23085, but contains albite (~7 vol%), epidote (<0.5 vol%), titanite (1 vol%) and calcite (~9 vol%) in the matrix. Phyllosilicate (~36 vol% white mica and 2 vol% chlorite) and quartz (~32 vol%) layers (up to 1 and 2 mm thick respectively) (Figure 4a–c), which are slightly folded, alternate.
Garnet (12 vol%) grains are porphyroblastic and up to 5 mm in diameter (Figure 4a). Such grains are usually euhedral or rounded; only a few grains are elongated. The porphyroblasts are characterized by (1) an inclusion-rich core with apatite, calcite, ilmenite, phengite (Si = 3.23–3.29 pfu), rutile and quartz enclosed in the inner core (Figure 4c), and chlorite (XMg = 0.25–0.37), calcite, epidote (Xpis = 0.15–0.19), paragonite (Xpar = 0.89–0.92), phengite (Si = 3.14–3.25 pfu), ilmenite and quartz in the outer core (Figure 4c,d) and (2) an inclusion-poor rim containing calcite, rutile and quartz (Figure 4c,d). According to the X-ray maps (Figure 5b,d), garnet is zoned with a clear boundary between core and rim. In addition, the core can be subdivided into an inner and outer core (see the Mn map of Figure 5b). The core is characterized by constant Ca, increasing Mg and decreasing Mn contents from the inner to the outer zone (inner core: Alm65.5Prp3.5Grs28Sps3, outer core: Alm65Prp6Grs28Sps1). After a possible corrosion event (see the above arguments related to garnet in 23085) and a jump in Ca and Mn at the core-rim boundary, the average garnet compositions vary as follows: inner rim Alm61.6Prp6.6Grs30Sps1.8, outer rim Alm62.8Prp7.5Grs28Sps1.7. Small garnet grains show compositions similar to the rim (or outer core+rim) of large garnet. In large garnet, an outermost rim occurs locally with inverted Mn and Mg contents compared to the rim (Figure 5b). As the extent of chemical equilibration between the local outermost rim and the surrounding matrix is unknown, we did not use the composition of this garnet domain for phase diagram calculations reported below.
Oriented potassic white mica contains 3.13–3.33 Si pfu with phengite in the core and muscovite at the rim (Figure 6b). Paragonite in the phyllosilicate domain is characterized by Xpar = 0.90–0.93. Accessory biotite (XMg = 0.54–0.62, Si = 2.63–2.85 pfu) occurs only around phengite or along its cleavage planes (Figure 4i). Oriented chlorite shows XMg = 0.47–0.56.
All observed carbonate is anhedral calcite that occurs enclosed in garnet, in the matrix, and as filling of cracks in and around garnet as retrograde mineral (Figure 4a–d,f). Calcite shows a somewhat variable composition (FeO = 0.1–3.7 wt%, MgO = 0.3–1.4 wt%), but no relation to the different textural positions could be established. Matrix calcite and calcite enclosed in garnet can appear as symplectite together with tiny limonite crystals (Figure 4f,g).
Matrix albite is elongated along the main foliation (Figure 4b,c) with XNa = 0.73–0.78. Epidote is enclosed in garnet (see above), but occurs also oriented in the matrix (Xpis = 0.12–0.19). Titanite in the matrix is oriented along the main foliation. It contains rutile as an inclusion and is replaced by ilmenite at its rim (Figure 4h). Ilmenite as inclusion in garnet usually encloses rutile in its core (replacing rutile, Figure 4e).
5 PSEUDOSECTION MODELLING
The method for the calculation of the P–T pseudosections is described in Appendix S1. Four P–T pseudosections (Figures 7a and 8a; Figures S1 and S2) were processed in detail for the compositions given in Table S1 (M1 and M2) considering the P–T ranges 3–15 kbar at 450–650°C (sample 23085, Figure 7a) and 3–20 kbar at 450–650°C (sample 23098, Figure 8a). These pseudosections were contoured by isopleths for molar fractions of garnet components, Si (pfu) in phengite, and the modal content of garnet. Intersections of these isopleths were used to define P–T conditions. The (smaller) angle between the intersecting isopleths affects the extension of error ellipses, which were drawn around the intersections in Figures 7 and 8 by visual estimation although considering, for instance, compositional errors for the corresponding minerals. These errors (given below) are consistent with estimated error quotations (2σ) proposed by Massonne (2013).
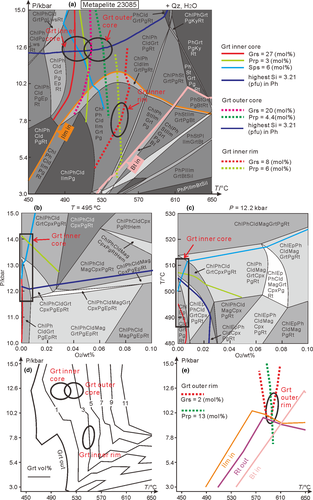
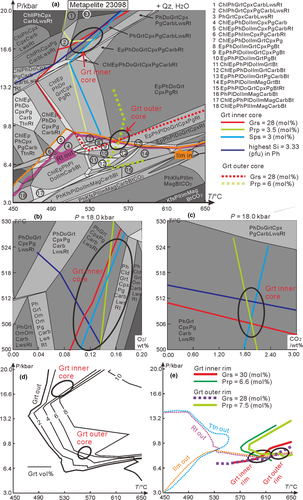
Two P–T pseudosections (Figure 7a and Figure S1) for different effective bulk-rock compositions (see above) of metapelite 23085 (Table S1, 23085-M1 and M2) were used to determine the P–T conditions of the formation of the inner core, outer core and inner rim domains of garnet and the late metamorphic stage (garnet outer rim). In the P–T pseudosection (Figure 7a) for 23085-M1, the intersections of isopleths for the inner core (Sps6Prp3Grs27), outer core (Prp4.4Grs20) and inner rim (Prp6Grs8) of garnet occur at 502 ± 12°C and 12.5 ± 0.8 kbar, 525 ± 10°C and 12.7 ± 0.7 kbar, and 553 ± 7°C and 7.8 ± 1 kbar respectively. The highest Si content in phengite (3.21 pfu) is compatible with the P–T conditions derived from the garnet core composition (Figure 7a). P–T conditions of 596 ± 10°C and 10.7 ± 1.4 kbar (Figure 7e) were determined for the garnet outer rim based on intersecting isopleths of Prp13 and Grs2, but the relevant pseudosection, related to the bulk-rock composition 23085-M2, is shown in Figure S1. The associated mineral assemblages in the corresponding pseudosections are chlorite+phengite+chloritoid+garnet+paragonite+rutile+quartz (core), chlorite+phengite+chloritoid+ilmenite+garnet+paragonite+quartz (inner rim) and chlorite+phengite+staurolite+ilmenite+magnetite+garnet+paragonite+rutile+quartz (outer rim) at the P–T conditions under which the given specific garnet domain formed. The isopleth for the garnet volume (3 vol%) at the above derived P–T conditions (12.7 kbar, 525°C; Figure 7d) is compatible with the observed modal content for the garnet core.
Two P–T pseudosections (Figure 8a and Figure S2) for different compositions of the calcite-bearing metapelite 23098 (Table S1, 23098-M1 and -M2) were constructed to estimate the P–T conditions for the formation of the garnet core and rim. The intersection of isopleths (Figure 8a) for the garnet inner core (Sps3Prp3.5Grs28) and the highest Si content in phengite (3.33 pfu) suggests P–T conditions of 526 ± 17°C and 17.4 ± 1.2 kbar. The P–T conditions of 560 ± 10°C and 8 ± 1 kbar were derived for the outer core by intersecting isopleths of Prp6 and Grs28 (Figure 8a). For the derivation of the P–T conditions of the garnet rim, we considered isopleths for Prp6.6Grs30 (garnet inner rim) and Prp7.5Grs28 (garnet outer rim) obtaining 602 ± 14°C at 7.9 ± 0.9 kbar and 629 ± 11°C at 8.5 ± 0.7 kbar respectively (Figure 8e and Figure S2). The associated mineral assemblages in the corresponding pseudosections are phengite+garnet+clinopyroxene+paragonite+carbonate+lawsonite+rutile+quartz, epidote+phengite+plagioclase+dolomite+garnet+clinopyroxene+paragonite+biotite+rutile+quartz, epidote+phengite+plagioclase+dolomite+garnet+clinopyroxene+carbonate+biotite+rutile+quartz and phengite+plagioclase+dolomite+ilmenite+garnet+clinopyroxene+carbonate+biotite+rutile+quartz at the P–T conditions related to the garnet inner core, outer core, inner rim and outer rim respectively. The isopleth for the garnet volume (6 vol%) at the derived P–T conditions (8 kbar, 560°C; Figure 8d) is compatible with the observed modal content for the garnet core.
6 Zr-IN-RUTILE THERMOMETRY
Four calibrations of the Zr-in-rutile thermometer, which requires the assemblage rutile–zircon–quartz, have been published. The first three ones (Ferry & Watson, 2007; Watson, Wark, & Thomas, 2006; Zack et al., 2004) focused only on the increasing incorporation of Zr into rutile with increasing temperature. The latest calibration (Tomkins, Powell, & Ellis, 2007), which is applied in our study, also demonstrated that the Zr content in rutile decreases with increasing pressure.
Rutile occurs in three microstructural positions in sample 23085: (1) Elongated rutile with a grain size up to 300 × 30 μm2, surrounded by ilmenite, was found in the matrix. (2) Tiny rutile crystals (<5 × 3 μm2) enclosed in garnet cores were too small for obtaining reliable Zr contents with the EMP. (3) Rutile enclosed in the garnet rim with a size of up to 60 × 20 μm2 is corroded showing euhedral relicts or subhedral forms. No compositional zoning of rutile was recognized in BSE images, but rutile grains, for which several spot analyses were achieved, exhibit the tendency that Zr contents in the core (71–116 ppm) were lower than in the outer zone (90–159 ppm) of a single grain.
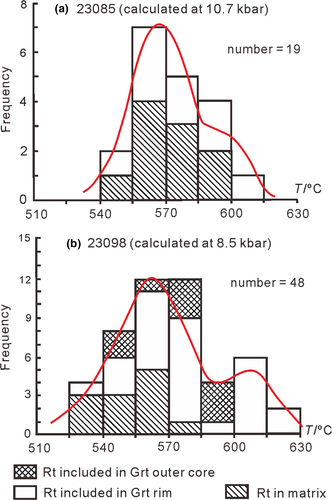
Six and three rutile grains were investigated by 10 and 9 spot analyses for matrix rutile (75–136 ppm) and rutile in the garnet rim (71–159 ppm) respectively. The corresponding temperatures are 542–598°C and 549–609°C, applying the Zr-in-rutile calibration by Tomkins et al. (2007) at 10.7 kbar. This pressure relates to the peak temperature in sample 23085 obtained by contoured pseudosections (Figure 7e). The highest temperatures of 582–609°C (mean: 591 ± 11 [1σ]°C; n = 5), determined with the Zr-in-rutile thermometer, are consistent with the peak temperature (596 ± 10°C) resulting from the application of the pseudosection method.
Rutile also occurs as three different textural types in sample 23098. (1) Rutile (Zr = 71–107 ppm) in the matrix is anhedral and surrounded by titanite (Figure 4h) with a size of up to 200 × 100 μm2. (2) Rutile (Zr = 81–164 ppm) with ilmenite lamellae enclosed in the garnet outer core is long oval with a maximum length of 60 μm. This rutile type is always armoured by a thin ilmenite rim. (3) Rutile (Zr = 64–243 ppm) enclosed in the garnet rim is round or anhedral (Figure 4e) with a size of up to 250 × 50 μm2. Such large rutile crystals show ilmenite lamellae. BSE images of rutile grains give no evidence for compositional zoning for all three types of rutile. Due to the anhedral shape, it is difficult to distinguish the original core of rutile, despite variable Zr contents in single grains.
Two (matrix), three (in garnet outer core) and seven (in garnet rim) rutile grains were investigated by the analyses of 12, 9 and 27 spots respectively. The corresponding temperatures are 552–598°C, 515–559°C and 533–626°C, calculated with the Zr-in-rutile calibration by Tomkins et al. (2007) at 8.5 kbar (Figure 9b). The used pressure refers to the peak temperature (629 ± 11°C) derived for sample 23098 with the pseudosection method (Figure 8e). The highest temperatures of 595–626°C (mean: 607 ± 10 [1σ]°C; n = 10), obtained from the Zr-in-rutile thermometer, are again consistent with the peak temperature (629 ± 11°C) obtained from the application of the pseudosection method.
7 MONAZITE TEXTURE, CHEMICAL COMPOSITION AND U–Th–Pb DATING
Monazite, (LREE)PO4, (Spear & Pyle, 2002; Williams, Jercinovic, & Hetherington, 2007) has become one of the primary tools for constraining the metamorphic evolution of Ca-poor metapelitic rocks (e.g. Hoisch, Wells, & Grove, 2008; Lo Pò et al., 2016; Massonne, 2014). Due to the high Th and to a lesser extent U contents in monazite, U-Th-Pb dating of this mineral is an established method in geochronology. Because of the negligible content of common Pb in monazite, this mineral can also be dated with the electron microprobe (EMP), although with relatively large uncertainties. In garnet-bearing metapelites, monazite ages have been successfully related to the growth of garnet (e.g. Chatterjee, 2017; Massonne, 2016a; Regis, Warren, Mottram, & Roberts, 2016).
Ninety-eight EMP analyses were achieved on 39 grains of monazite in sample 23085. For constraining metamorphic ages, we considered only 70 ages from analyses having Th/U ratios of <7 in monazite (see below). Selected monazite analyses are given in Table 2. Monazite occurs in three different microstructural domains: enclosed in the garnet outer core (Figure 10a), shielded in the garnet rim (Figure 10b) without fractures, and in the matrix (= matrix monazite) where monazite either is included in phengite, paragonite and quartz, or occurs as intergranular grain (Figure 10c–f). One matrix monazite grain was found to occur together with apatite (Figure 10f) indicating coexistence of these phosphates. The partial replacement of matrix monazite by allanite was also observed (Figure 10c,d). Most of the monazite grains are corroded and exhibit elongated small relicts of prismatic crystals with long dimensions of 10–70 μm and short dimensions of 5–20 μm.
| Mnz1 | Mnz2 | Mnz3 | Mnz4 | Mnz5 | Mnz6 | ||||||||
|---|---|---|---|---|---|---|---|---|---|---|---|---|---|
| Position | In Grt outer core | In Grt rim | In Ph | In Pg | In Qz | Inter. | |||||||
| Spot no. | 1-1 | 1-2 | 1-3 | 2-1 | 2-2 | 3-1 | 3-2 | 4-1 | 4-2 | 5-1 | 5-2 | 5-3 | 6-1 |
| SiO2 | 0.30 | 0.36 | 0.37 | 0.28 | 0.62 | 0.45 | 0.40 | 0.26 | 0.45 | 0.33 | 0.32 | 0.27 | 0.21 |
| P2O5 | 29.3 | 29.5 | 29.4 | 29.3 | 29.7 | 30.3 | 30.0 | 29.2 | 29.1 | 28.3 | 29.3 | 29.2 | 30.3 |
| SO3 | 0.02 | 0.02 | 0.03 | 0.02 | 0.03 | 0.04 | 0.02 | 0.01 | 0.03 | 0.02 | 0.01 | 0.01 | 0.01 |
| CaO | 0.73 | 0.88 | 0.73 | 0.71 | 0.73 | 0.78 | 0.70 | 0.72 | 0.97 | 0.77 | 0.69 | 0.59 | 0.65 |
| Y2O3 | 0.44 | 0.43 | 0.39 | 0.25 | 0.27 | 0.50 | 0.50 | 0.97 | 0.79 | 0.10 | 0.18 | 0.17 | 0.32 |
| La2O3 | 13.2 | 12.9 | 13.3 | 15.0 | 14.8 | 14.1 | 14.0 | 13.6 | 13.1 | 14.6 | 15.0 | 15.4 | 15.5 |
| Ce2O3 | 27.3 | 26.5 | 27.3 | 29.5 | 29.5 | 29.1 | 28.1 | 27.4 | 26.1 | 29.8 | 29.7 | 30.4 | 30.6 |
| Pr2O3 | 3.22 | 3.22 | 3.25 | 3.18 | 3.18 | 3.28 | 3.22 | 3.16 | 3.00 | 3.24 | 3.15 | 3.20 | 3.25 |
| Nd2O3 | 12.7 | 12.4 | 12.3 | 10.8 | 10.9 | 11.5 | 11.8 | 11.3 | 10.8 | 12.0 | 11.4 | 11.5 | 11.8 |
| Sm2O3 | 2.60 | 2.62 | 2.47 | 1.65 | 1.67 | 1.93 | 2.09 | 2.04 | 1.85 | 2.04 | 1.91 | 1.92 | 1.85 |
| Gd2O3 | 1.97 | 1.96 | 1.79 | 0.94 | 0.92 | 1.31 | 1.42 | 1.47 | 1.32 | 1.15 | 1.16 | 1.19 | 1.07 |
| Dy2O3 | 0.38 | 0.38 | 0.34 | 0.26 | 0.29 | 0.43 | 0.35 | 0.57 | 0.50 | 0.20 | 0.27 | 0.26 | 0.35 |
| Er2O3 | 0.05 | 0.04 | 0.03 | 0.04 | 0.04 | 0.05 | 0.06 | 0.10 | 0.08 | 0.05 | 0.05 | 0.04 | 0.07 |
| PbO | 0.014 | 0.017 | 0.016 | 0.012 | 0.011 | 0.016 | 0.013 | 0.023 | 0.026 | 0.011 | 0.014 | 0.017 | 0.015 |
| ThO2 | 3.83 | 4.90 | 3.85 | 4.09 | 3.67 | 3.87 | 4.21 | 3.12 | 5.07 | 4.53 | 4.47 | 3.42 | 3.09 |
| UO2 | 0.84 | 0.84 | 0.89 | 0.64 | 0.65 | 0.77 | 0.44 | 1.69 | 2.32 | 0.63 | 0.72 | 0.70 | 0.75 |
| Total | 96.83 | 96.95 | 96.42 | 96.61 | 97.00 | 98.35 | 97.36 | 95.62 | 95.50 | 97.79 | 98.31 | 98.36 | 99.73 |
| Si | 0.012 | 0.014 | 0.015 | 0.011 | 0.025 | 0.018 | 0.016 | 0.011 | 0.018 | 0.013 | 0.013 | 0.016 | 0.008 |
| P | 1.000 | 1.003 | 1.002 | 1.000 | 1.000 | 1.005 | 1.007 | 1.005 | 1.002 | 0.976 | 0.992 | 0.985 | 1.003 |
| S | 0.001 | 0.000 | 0.001 | 0.001 | 0.001 | 0.001 | 0.001 | 0.000 | 0.001 | 0.001 | 0.000 | 0.001 | 0.000 |
| Ca | 0.031 | 0.038 | 0.032 | 0.031 | 0.031 | 0.033 | 0.030 | 0.032 | 0.042 | 0.034 | 0.029 | 0.031 | 0.027 |
| Y | 0.009 | 0.009 | 0.008 | 0.005 | 0.006 | 0.010 | 0.011 | 0.021 | 0.017 | 0.002 | 0.004 | 0.009 | 0.007 |
| La | 0.196 | 0.190 | 0.197 | 0.223 | 0.217 | 0.204 | 0.205 | 0.203 | 0.195 | 0.219 | 0.221 | 0.215 | 0.223 |
| Ce | 0.402 | 0.389 | 0.403 | 0.436 | 0.430 | 0.418 | 0.409 | 0.406 | 0.387 | 0.444 | 0.434 | 0.433 | 0.438 |
| Pr | 0.047 | 0.047 | 0.048 | 0.047 | 0.046 | 0.047 | 0.047 | 0.047 | 0.044 | 0.048 | 0.046 | 0.047 | 0.046 |
| Nd | 0.182 | 0.177 | 0.177 | 0.156 | 0.155 | 0.161 | 0.168 | 0.164 | 0.157 | 0.175 | 0.163 | 0.170 | 0.165 |
| Sm | 0.036 | 0.036 | 0.034 | 0.023 | 0.023 | 0.026 | 0.029 | 0.029 | 0.026 | 0.029 | 0.026 | 0.029 | 0.025 |
| Gd | 0.026 | 0.026 | 0.024 | 0.013 | 0.012 | 0.017 | 0.019 | 0.020 | 0.018 | 0.015 | 0.015 | 0.017 | 0.014 |
| Dy | 0.005 | 0.005 | 0.004 | 0.003 | 0.004 | 0.005 | 0.004 | 0.008 | 0.007 | 0.003 | 0.003 | 0.004 | 0.004 |
| Pb | 0.0002 | 0.0002 | 0.0002 | 0.0001 | 0.0001 | 0.0002 | 0.0001 | 0.0002 | 0.0003 | 0.0001 | 0.0002 | 0.0001 | 0.0002 |
| Th | 0.035 | 0.045 | 0.035 | 0.038 | 0.033 | 0.035 | 0.038 | 0.029 | 0.047 | 0.042 | 0.041 | 0.039 | 0.027 |
| U | 0.008 | 0.007 | 0.008 | 0.006 | 0.006 | 0.007 | 0.004 | 0.015 | 0.021 | 0.006 | 0.006 | 0.004 | 0.006 |
| Age/Ma | 22.19 | 24.30 | 30.25 | 17.33 | 16.13 | 29.52 | 17.24 | 36.53 | 27.37 | 12.65 | 22.64 | 47.99 | 38.78 |
| 1σ-error | 6.57 | 5.66 | 6.41 | 6.91 | 7.35 | 6.70 | 7.62 | 5.08 | 3.46 | 6.49 | 6.31 | 7.54 | 7.77 |
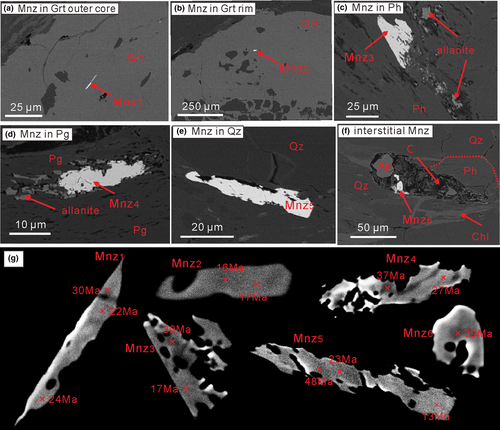
Monazite enclosed in the garnet outer core and rim does not show zonation in BSE images (Figure 10g), whereas matrix monazite exhibits irregular zoning, locally connected with fractures in the host mineral (see above), or a zonation characterized by a dark core and a brighter rim (Figure 10g). The visual zonation in BSE images can be attributed to a large variation in Th contents in monazite grains (see Be Mezeme, Cocherie, Faure, Legendre, & Rossi, 2005; Harlov, Wirth, & Hetherington, 2011; Swain, Hand, Teasdale, Rutherford, & Clark, 2005; Taylor, Kirkland, & Clark, 2016; Turrillot, Augier, & Faure, 2009). The dark domain in BSE images contains less Th than the brighter domain in the individual monazite grains.
The chemical data and obtained ages are summarized in Figures 11 and 12. The ages range between 48.2 ± 6.2 (1σ) and 13.8 ± 5.6 (1σ) Ma (Th/U < 7) without any significant age difference between enclosed monazite and matrix monazite (Figure 12a–c). However, monazite included in the garnet rim yields younger ages (13.8 ± 5.6–26.4 ± 5.3 [1σ] Ma) than that in the garnet outer core (23.1 ± 6.4–44.3 ± 6.4 [1σ] Ma) (Figure 12a,b). In general, the dark domains in BSE images gave older ages in individual monazite grains (Figure 10g: Mnz3–6). Considering that Th/U in monazite can have a discriminant function for geological conditions (Janots et al., 2012), we separated the monazite ages into low Th/U < 7 (ratios: 1.84–6.96) and high Th/U > 7 (ratios: 7.2–14.0) ages (Figure 11c). The high Th/U ratios are only related to a portion of matrix monazite. Furthermore, because high Th/U ratios should generally result from fluid-related alterations (Hoisch et al., 2008; Janots et al., 2012; Seydoux-Guillaume et al., 2012; Williams, Jercinovic, Harlov, Budzyń, & Hetherington, 2011), we ignored the ages of high-Th/U monazite for further considerations.
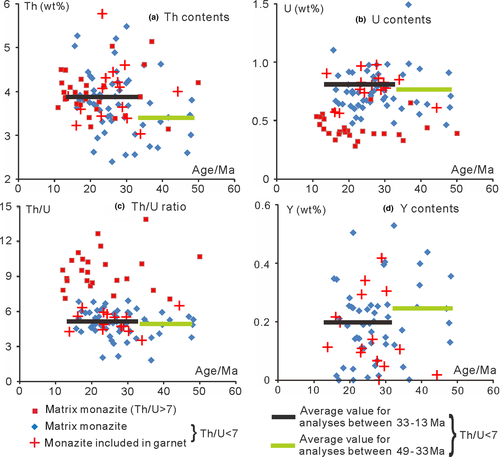
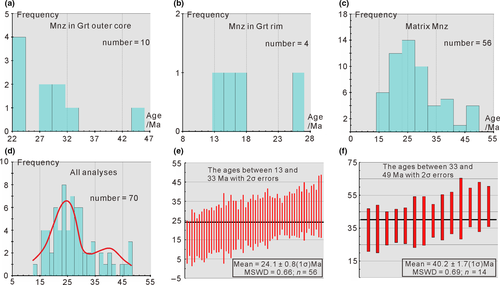
Two populations of the low-Th/U monazite were found in terms of chemical composition (Figure 11) and histogram analysis (Figure 12d). The older population includes ages from 48.2 ± 6.2 (1σ) Ma to 33.9 ± 6.5 (1σ) Ma with a weighted mean age of 40.2 ± 1.7 (1σ) Ma (MSWD = 0.69; n = 14) (Figure 12f). This population is characterized by Th/U ratios between 1.84 and 6.54 (mean: 4.73, Figure 11c), Th contents of 2.29–4.04 wt% (mean: 3.03 wt%, Figure 11a), U contents of 0.41–1.32 wt% (mean: 0.69 wt%, Figure 11b), and Y contents of 0.01–0.61 wt% (mean: 0.20 wt%, Figure 11d). The younger population shows ages from 32.5 ± 16.4 (1σ) Ma to 13.8 ± 5.7 (1σ) Ma with a weighted mean age of 24.1 ± 0.8 (1σ) Ma (MSWD = 0.66; n = 56) (Figure 12e). Its characteristics are: Th/U = 2.06–6.96 (mean: 5.10, Figure 11c), Th = 2.11–5.10 wt% (mean: 3.42 wt%, Figure 11a), U = 0.42–1.81 wt% (mean: 0.71 wt%, Figure 11b) and Y = 0.00–0.51 wt% (mean: 0.16 wt%, Figure 11d).
8 DISCUSSION
8.1 P–T conditions and paths
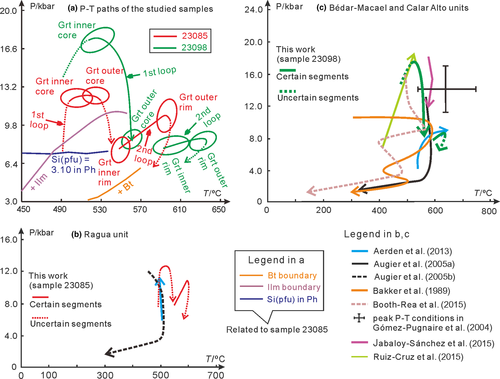
According to the applied method using intersecting isopleths mainly of garnet components only those P–T conditions could be determined that reflect the growth of garnet. The application of Zr-in-rutile thermometry (~591°C and ~607°C for samples 23085 and 23098, respectively) supported the derived peak temperatures (~596°C and ~629°C for samples 23085 and 23098 respectively). The pseudosection modelling, however, can deliver also semiquantitative information on the evolution of a metamorphic rock before, after and between stages of garnet growth considering, for instance, inclusions in minerals such as garnet or late mineral decomposition products. Moreover, a continuous garnet growth (e.g. garnet in eclogite from the western Erzgebirge, central Europe; see Massonne, 2012) would reflect a single P–T loop, whereas a discontinuous growth (e.g. garnet in eclogite from the Chinese Tianshan; see Li, Klemd, Gao, & John, 2016) could suggest two metamorphic events with two different loops. The corresponding change in the volume of garnet can be monitored with isopleths as shown in Figure 7d. For instance, the observation that garnet was only slightly corroded after the core formation in sample 23085 (roughly estimated loss of the garnet volume from <3.2 to >2.8 vol%) would be compatible with heating of <30°C during a pressure release from 12.5 to 8 kbar (Figure 13a). Thus, the compositional zoning of garnet excludes a single prograde P–T loop with a continuous dP/dT change leading to permanent garnet growth from core towards the rim. Instead, P–T conditions along the same P–T loop, however, with a late reheating event (Bakker et al., 1989), or two different P–T loops for each of the studied samples (Figure 13a; Table 3) are evident.
| Sample | P–T Path | Garnet | T/°C | P/kbar | Calculated mineral assemblage | Inclusion assemblage in garnet |
|---|---|---|---|---|---|---|
| 23085 | Early loop | Inner core | 502 ± 12 | 12.5 ± 0.8 | Chl+Ph+Cld+Grt+Pg+Rt+Qz | Ap+Bt+Chl+Pg+Ph+Rt+Ilm+Qz |
| Outer core | 525 ± 10 | 12.7 ± 0.7 | Chl+Ph+Cld+Grt+Pg+Rt+Qz | Ap+Chl+Rt+Ilm+Qz | ||
| Late loop | Inner rim | 553 ± 7 | 7.8 ± 1 | Chl+Ph+Cld+Ilm+Grt+Pg+Qz | Ilm+Rt+Qz | |
| Outer rim | 596 ± 10 | 10.7 ± 1.4 | Chl+Ph+St+Ilm+Mt+Grt+Pg+Rt+Qz±Ilm | Bt+Ch+lIlm+Rt+Qz | ||
| 23098 | Early loop | Inner core | 526 ± 17 | 17.4 ± 1.2 | Ph+Grt+Cpx+Pg+Carb+Lw+Rt+Qz | Ap+Cal+Ilm+Ph+Rt+Qz |
| Outer core | 560 ± 10 | 8 ± 1 | Ep+Ph+Pl+Do+Grt+Cpx+Pg+Bt+Rt+Qz | Chl+Cal+Ep+Pg+Ph+Ilm+Qz | ||
| Late loop | Inner rim | 602 ± 14 | 7.9 ± 0.9 | Ep+Ph+Pl+Do+Grt+Cpx+Carb+Bt+Rt+Qz±Ilm | Cal+Rt+Qz | |
| Outer rim | 629 ± 11 | 8.5 ± 0.7 | Ph+Pl+Do+Ilm+Grt+Cpx+Carb+Bt+Rt+Qz±Ilm |
The beginning of the trajectory of each sample is based on the compositions of the garnet inner core and the highest Si content in potassic white mica leading to contrasting peak pressures at ~525°C (23085: ~12.7 kbar, 23098: ~17.4 kbar). The peak pressure event was followed by nearly isothermal exhumation paths to ~8 kbar at ~550°C (Figure 13a). The later parts of the two P–T trajectories were derived from the garnet rim compositions. These trajectories are characterized by a prograde evolution reaching peak temperatures close to 600°C at ~10.7 kbar (23085) and 630°C at ~8.5 kbar (23098) consistent with Zr-in-rutile thermometry (~591°C and ~607°C for samples 23085 and 23098 respectively).
There are some differences between the calculated mineral assemblages in the pseudosections and the observed ones (Table 3) in sample 23085: (1) Biotite and ilmenite did not appear in the calculated mineral assemblages for the P–T area at HP conditions related to the formation of the garnet core (Figure 7a), but occur as inclusions in this core (Figure 3c,d). The most likely explanation is that biotite, ilmenite and an enclosed low-Si potassic white mica (see above) had already grown at low pressures (<7 kbar) at ~500°C before the onset of garnet growth (Figure 13a). Unfortunately, these P–T conditions could not be better defined, but they are important for the understanding of the very early metamorphic evolution of sample 23085. (2) Chloritoid appears in the calculated P–T area for the formation of the garnet core and inner rim (Figure 7a), but no chloritoid was found in sample 23085. We assume that this mineral was replaced by other minerals during the late metamorphism, because chloritoid is not stable below 10 kbar and above 580°C according to the calculated pseudosection of Figure 7a. (3) Biotite in the garnet outer rim (Figure 3f) shows a different composition compared to biotite enclosed in the garnet core (see Section 4.1), but does not appear in the calculated mineral assemblage coexisting with the garnet outer rim (Table 3). However, P–T fields with biotite-bearing assemblages are very near the averaged P–T conditions derived for the garnet outer rim (Figure 7e). Thus, within the P–T errors, the growth of biotite together with the outermost garnet rim is compatible with our P–T results.
In general, the calculated mineral assemblages in the pseudosections for sample 23098 are in agreement with the observed mineral assemblages (Table 3), except for ilmenite and carbonate minerals. As in sample 23085, ilmenite is enclosed in the garnet core (Figure 4e), but does not appear in the calculated HP assemblages relevant for the formation of garnet. Again, we interpret the occurrence of ilmenite as a hint of the P–T conditions of an early metamorphic event. Calcite is included in the garnet core and rim (Table 3; Figure 4d), which matches the calculated mineral assemblages coexisting with the various garnet domains. However, dolomite (with ankerite component) appears in addition to calcite (with magnesite, siderite and rhodochrosite components) in the relevant P–T area of the calculated pseudosections (Table 3; Figure 8a), but was not found in sample 23098. The reason for this discrepancy could be that the predicted carbonate was replaced by symplectites of calcite and limonite (Figure 4f,g). This reaction was assisted by hydrous fluids, which also penetrated garnet along fractures, as a result of late-stage metamorphism (retrogression) after the formation of the garnet rim.
8.2 Comparison with previously derived P–T histories
The derived peak-P difference between sample 23098 (~17 kbar) from the upper Calar Alto unit and sample 23085 (~13 kbar) from the lower Ragua unit is consistent with earlier P–T estimates (Augier, Booth-Rea, et al., 2005; de Jong, 1993a; Kirchner et al., 2016; Vázquez et al., 2011) summarized in Section 2.2. The lower temperatures in samples from the lower unit in the nappe pile of the NFC (Behr & Platt, 2012) is also compatible with different peak-T derived for samples 23085 (~596°C) and 23098 (~629°C). The peak-T of the late P–T trajectory (Figure 13a) was ascribed to a late reheating event by previous authors (Aerden et al., 2013; Behr & Platt, 2012; de Jong, 1993a, b, 2003). In spite of these consistent results there are some differences compared to the P–T results of previous authors, which are discussed subsequently.
8.2.1 Ragua unit
The here constrained peak-P conditions of 12.7 ± 0.7 kbar at 525 ± 10°C fit within errors with previous results of 11.5 kbar at 500°C (Aerden et al., 2013) and 12.0 ± 0.8 kbar at 480 ± 31°C (Augier, Booth-Rea, et al., 2005) for metapelites in the Ragua unit (Figure 13b). In addition, Aerden et al. (2013) derived an isothermal (~500°C) prograde P–T segment from ~7 kbar (garnet core) to ~11.5 kbar (garnet rim) applying the garnet isopleth method using P–T pseudosections calculated with the THERMOCALC program. Their garnet rim composition (Alm76Prp4Sps4Grs15) is similar to our garnet core (Alm64–73.6Prp3–4.4Sps2–6Grs20–27), but their core composition (Alm62Prp3Sps9Grs25) was not found in our sample 23085. Therefore, we presume that the prograde isothermal P–T segment from Aerden et al. (2013) reflects our uncertain prograde P–T trajectory (Figure 13a,b) and, thus, explains the occurrence of inclusions of ilmenite in our garnet core.
Augier, Booth-Rea, et al. (2005) reconstructed a nearly isothermal decompression P–T path (Figure 13b) constrained by multiequilibrium thermobarometry, using the TWEEQU software, and Raman spectroscopic thermometry on carbonaceous matter (graphite) for a rock from the base of the Ragua unit. This path starts at 10–12 kbar and 485°C and ends at 3 kbar and 510°C considering garnet core to rim compositions of Alm63–82Prp3–5Sps6–7Grs28–7. Although the Si contents in potassic white mica of 3.20–3.25 pfu (for S2) are slightly higher in the rock studied by Augier, Booth-Rea, et al. (2005) than in our sample from the Ragua unit (22085 with Si ≤ 3.21 pfu) we estimated slightly higher peak pressures for this mica coexisting with the garnet core. However, our estimated temperature peak of close to 600°C using pseudosection modelling (garnet isopleth intersections) is significantly higher than those estimated by Augier, Booth-Rea, et al. (2005: ~510°C), but matches the temperature of ~591°C calculated by Zr-in-rutile thermometry.
8.2.2 Bédar-Macael and Calar Alto units
Since the Bédar-Macael and Calar Alto units are treated as one unit (Mulhacén nappe) by some authors, we compare our results for the Calar Alto unit with the P–T conditions for the Mulhacén nappe in general. The here constrained peak-P conditions of 17.4 ± 1.2 kbar at 526 ± 17°C are close to previous results of ~18–19 kbar at ~550°C (Ruiz-Cruz et al., 2015), ~16 kbar/450–500°C (Booth-Rea et al., 2015), 14.4 ± 2.8 kbar at 651 ± 117°C (Gómez-Pugnaire et al., 2004) and ~19 kbar at 570–590°C (Jabaloy-Sánchez et al., 2015) for metapelites in the Bédar-Macael and Calar Alto units (Figure 13c). However, the P–T data estimated by Ruiz-Cruz et al. (2015) resulted from their modelling of garnet growth at H2O-absent conditions (see their figure 11, for example, garnet+kyanite at 300°C at >15 kbar). We think that such conditions would not lead to garnet porphyroblasts, but to very small irregularly zoned garnet around decomposing minerals such as plagioclase and biotite at HP conditions as reported, for instance, by Compagnoni and Rolfo (2003) and Rubbo, Borghi, and Compagnoni (1999).
The peak pressures of 9–11 kbar for various rock types of the Mulhacén nappe using traditional geobarometers (Bakker et al., 1989: jadeite-albite-quartz, rutile-ilmenite-garnet-quartz-plagioclase, presence of aragonite) are considered here as minimum pressures. A maximum pressure of 8.5 kbar at 575°C, which is significantly lower than the peak pressure estimated here and by other authors (see above), was derived by Aerden et al. (2013) using the garnet isopleth method (see Section 8.2.1). Because of the striking similarity of the P–T trajectory obtained by these authors and our late trajectory with a peak pressure of 8.5 kbar (Figure 13), it is possible that these authors have missed compositions such as those of the garnet core in sample 23098, representative of the early conditions, and were, thus, not able to deduce HP conditions for metapelites of the Mulhacén nappe. Our late P–T trajectory, based on detailed garnet element mapping, was not recognized by other authors (Augier, Agard, et al., 2005; Booth-Rea et al., 2015; Gómez-Pugnaire et al., 2004; Jabaloy-Sánchez et al., 2015), but again the temperature of ~607°C resulting from the Zr-in-rutile geothermometry confirms the higher peak temperatures of more than 600°C estimated here, and by Aerden et al. (2013) applying the garnet isopleth method.
8.3 Metamorphic ages
After discarding the suspicious ages with high Th/U ratios (>7, see Section 7), two age populations in sample 23085 could be defined applying compositional data of monazite (Figure 11), but mainly the histogram analysis with ISOPLOT (Figure 12d,e: 24.1 and 40.2 Ma). For linking these ages to the growth of garnet, the Y content of monazite can be considered (Foster, Kinny, Vance, Prince, & Harris, 2000; Hoisch et al., 2008; Massonne, 2016a; Williams et al., 2007). Low Y contents (e.g. Y2O3 < 0.6 wt% in Foster et al., 2000; <0.4 wt% in Massonne, 2016a) in monazite indicate that this mineral formed after the crystallization of garnet. The analysed monazite grains show such low Y contents (Y2O3 < 0.8 wt%) and a difference in the Y content for the two age groups is not distinct. Thus, we conclude that the growth of monazite started after the inner core of garnet had crystallized. Consequently, this early garnet formed before the older population (mean age: 40.2 ± 1.7 [1σ] Ma) compatible with the inclusion of monazite only in the garnet outer core and rim (Figure 12a,b). Hence, the first metamorphic event reaching HP conditions occurred still in Eocene times. The process of the formation of early monazite is elucidated by the observations that (1) apatite and a monazite grain with an age of 38.8 ± 7.8 (1σ) Ma was found to coexist in the matrix (Figure 10f,g) and (2) apatite is enclosed only in the garnet core. We assume that the early monazite formed from a reaction that involved the breakdown of apatite and a REE-bearing mineral that could have been allanite. This silicate grew again from monazite during retrogression.
The subsequent exhumation (garnet outer core) and the second P–T loop must have taken place around the age of the younger population (mean age: 24.1 ± 0.8 [1σ] Ma). Regarding the ages with the high Th/U ratios (>7), they are distributed over the entire obtained age range from 13 to 48 Ma, but concentrated at the younger ages (22–13 Ma). The corresponding monazite is characterized by the lowest U concentrations (0.28–0.66 wt%, mean: 0.43 wt%) (Figure 11b), which could be caused by hot fluids preferentially leaching U compared to Th from the host rock during late-stage metamorphism (Hoisch et al., 2008; Janots et al., 2012; Seydoux-Guillaume et al., 2012; Williams et al., 2011). Surprisingly, this fluid-mediated alteration does not seem to have resulted in the complete removal of Pb (see also Williams et al., 2011), so that the age of this event could not be determined.
The here-obtained age of the oldest population of 40.2 ± 1.7 [1σ] Ma is similar to those previously reported by 40Ar/39Ar dating on phengite from rocks of the NFC (see Section 2.2: for example, 50–48 Ma by Monié et al., 1991). However, other dating methods used on rocks from the NFC (see section 2.2) and other medium- to high-grade metamorphic units of the Betic Cordillera (e.g. 19.7 ± 2.2 Ma, U-Pb SHRIMP dating on zircon rims by Zeck & Williams, 2001) yielded only early Miocene ages (see also Platt & Whitehouse, 1999) compatible with our younger age population (mean age of 24.1 ± 0.8 [1σ] Ma). We assume that, for instance, zircon growth did not occur during the late Eocene metamorphic event (first P–T loop in Figure 13a), so that the early metamorphism could not be dated by using zircon.
8.4 Tectonic implications
In this work, we could demonstrate that two different metamorphic events occurred in rocks from the NFC in the Eocene and the late Oligocene–early Miocene. Thus, we contradict the view, that the entire medium- to high-grade metamorphic Betic Cordillera, including subduction of continental crust and its exhumation, occurred within a short time interval (late Oligocene to middle Miocene) as proposed by Behr and Platt (2012), López Sánchez-Vizcaíno et al. (2001), and Platt et al. (2003, 2006). On the contrary, we suggest that the final subduction of oceanic crust (Neotethys) had already taken place in the Eocene. This final subduction of oceanic crust also concerns a section of this crust, which was adhered to the continental plate and, thus, was not further subducted after slab break-off (see Davies & von Blanckenburg, 1995) had separated both oceanic and continental crust. This subducted oceanic crust which was adhered to the continental plate consisted of a significant pile of sediments, because of its vicinity to the continental crust, and the underlying basalts and gabbros of the oceanic crust. These mafic rock types are exposed in the NFC as HP metamorphic rocks (diverse eclogites, garnet-phengite-bearing metapelites, etc.), which were not subducted deeper than 60–70 km (pressure climax between 17 and 20 kbar, see this work and Section 2.2). The adhered continental crust that was already metamorphosed in late Hercynian times (zircon core dating by Zeck & Whitehouse, 1999: 285 ± 5 [2σ] Ma of an orthogneiss from the AC; monazite in granulitic garnet from the Jubrique Unit: 287 ± 9 [2σ] Ma, Massonne, 2014) was subducted to depths of only ~50 km (~13 kbar, see Massonne, 2014). Thus, a scenario is proposed here that was outlined in Massonne (2016b) for the beginning of a continent–continent collision.
For the exhumation process of the NFC, that took place after continent–continent collision, two tectonometamorphic evolution models exist in the literature, which are mainly based on the conflicting metamorphic ages given previously for the NFC. One group of researchers think that there was only one extensional event so that the NFC and the overlying AC should have experienced the same exhumation history starting before 40 Ma according to Ar-Ar dating on phengite (Augier, Agard, et al., 2005; Monié et al., 1991). Probably the majority of researchers believe, however, that the NFC started to exhume from greater depths at a later period (≤ 20 Ma) after the AC had just been (partially) exhumed. This scenario seems to be supported by dating results (see above) concerning, for instance, Lu-Hf in garnet (Platt et al., 2006) and U-Pb in zircon (Gómez-Pugnaire et al., 2012; López Sánchez-Vizcaíno et al., 2001). Following the aforementioned geodynamic scenario by Massonne (2016b), rocks previously involved in a subduction process experienced early exhumation in an exhumation channel, in which various kinds of HP crustal slices, but also mantle slices, like the Ronda peridotite of the AC (e.g. Johanesen & Platt, 2015; Obata, 1980), are brought together. This event, which coincided with the onset of Alpine metamorphism in the late Eocene to Oligocene (Massonne, 2014; Platt et al., 2005), was accompanied by a significant deformation of the rocks (e.g. broken early garnet: Figure 3h,i). Stacking of such slices (nappe formation) and another deformation event followed. During this process, hot (>700°C) slices caused reheating, demonstrated by the late P–T loop derived for both studied samples (Figure 13a), as suggested by Aerden et al. (2013), Behr and Platt (2012), and Booth-Rea et al. (2005). According to these authors, this process, resulting in the growth of the garnet rim in the studied samples, occurred at 13–22 Ma or possibly, based on our younger monazite population (24.1 Ma), somewhat earlier.
The time gap between first and second metamorphic event is c. 15 Ma. Similar gaps were also noted for other orogens of which the Himalaya is a prominent example. In this case, the peak metamorphism of eclogites, exposed in the Higher Himalayan Crystalline (HHC) as representatives of deeply subducted material, occurred c. 55 Ma (de Sigoyer, Guillot, & Dick, 2004) or somewhat later (46.2 ± 0.7 Ma according to U-Pb SHRIMP dating of a coesite-bearing zircon by Kaneko et al., 2003; 44 ± 3 Ma, zircon rim dated by Spencer & Gebauer, 1996; 49 ± 6 Ma, Sm-Nd garnet–omphacite isochron by Tonarini et al., 1993). Dating of the subsequent cooling applying the K–Ar and Ar–Ar methods yielded ages between 43 and 35 Ma followed by a second metamorphism (Massonne & O'Brien, 2003; and references therein). According to Carosi, Montomoli, Rubatto, and Visonà (2010), Carosi et al. (2016), and Imayama et al. (2012), U–Th–Pb in situ LA-ICP-MS and SHRIMP dating on monazite point to activation of major ductile shear zones related to stacking of nappes within the HHC in the time interval 41–28 Ma. Younger ages also confirm that the activity of such shear zones is a relatively long-lasting event resulting in significant exhumation (e.g. Carosi et al., 2010; Robyr, Epard, & El Korh, 2014). Under these circumstances, the various ages obtained by Kirchner et al. (2016) applying multimineral 87Rb/86Sr isochron dating (20.1, 16.0, and 13.3 Ma) to rocks from the NFC (see section 2) become better understandable, as they are related to the metamorphism during the second P–T loop (Figure 13a) caused by nappe stacking and subsequent orogenic extension (Balanyá et al., 1997; García-Dueñas et al., 1992; Platt et al., 2006). Also Gómez-Pugnaire et al. (2004) commented that the age (16.5 ± 0.4 Ma), which they obtained by zircon U–Pb dating, is likely to be related to decompression, as suggested by titanite inclusions found in zircon.
9 CONCLUSIONS
Two P–T loops and two monazite age populations (mean ages: 40 ± 2 [1σ] and 24 ± 1 Ma) were deduced from a detailed study of two metapelites from the Ragua (sample 23085) and Calar Alto units (sample 23098) of the NFC. For sample 23085, the older P–T loop includes peak-P conditions of 13 ± 1 kbar at 525 ± 10°C. Higher peak pressures (17 ± 1 kbar) at the same temperature were derived for sample 23098, confirming previous works that suggested a deeper burial of the Calar Alto unit compared to the Ragua unit. The corresponding HP metamorphism in the Eocene is related to subduction of the interface between continental and oceanic crust. The limited depths (≤60 km) reached by subduction are hypothesized above to be caused by slab break-off that additionally resulted in immediate exhumation of the continental margin. Within the corresponding exhumation channel, slices of different rock types, representing oceanic and continental crust as well as the mantle, were mixed and stacked. This nappe stacking caused the younger P–T loop reaching conditions of 11 ± 1 kbar (sample 23085) and 9 ± 1 kbar (sample 23098) at ~600 and 630°C respectively. The reheating of the studied rocks was probably caused by the overlying hot AC, because the Calar Alto unit, being closer to the AC, became hotter than the Ragua unit.
The above comparison with rocks from the crystalline belt of the Himalaya demonstrates that two different metamorphic events related to subduction and nappe stacking occurred there as well. The time gap between both processes is in a similar range as found here (c. 15 Ma). It seems to be that such a feature is typical for a continent–continent collisional process.
ACKNOWLEDGEMENTS
We thank M. Schmelz, G. Kwiatkowski and M. Leiss (all Stuttgart) for their technical assistance. Samples of the NFC were kindly provided by H.-P. Schertl from the collection of the Institut für Geologie, Mineralogie und Geophysik at Ruhr-Universität Bochum. The manuscript benefited from the careful editorial handling and suggested improvements by D. Robinson and constructive comments by G. Franz (Berlin), G. Booth-Rea (Granada) and R. Augier (Orleans).


