New mineral activity–composition relations for thermodynamic calculations in metapelitic systems
Abstract
New activity–composition (a–x) relations for minerals commonly occurring in metapelites are presented for use with the internally consistent thermodynamic dataset of Holland & Powell (2011, Journal of Metamorphic Geology, 29, 333–383). The a–x relations include a broader consideration of Fe2O3 in minerals, changes to the formalism of several phases and order–disorder in all ferromagnesian minerals where Fe–Mg mixing occurs on multiple sites. The a–x relations for chlorite, biotite, garnet, chloritoid, staurolite, cordierite, orthopyroxene, muscovite, paragonite and margarite have been substantially reparameterized using the approach outlined in the companion paper in this issue. For the first time, the entire set of a–x relations for the common ferromagnesian minerals in metapelitic rocks is parameterized simultaneously, with attention paid to ensuring that they can be used together to calculate phase diagrams of geologically appropriate topology. The a–x relations developed are for use in the Na2O–CaO–K2O–FeO–MgO–Al2O3–SiO2–H2O–TiO2–O2 (NCKFMASHTO) system for both subsolidus and suprasolidus conditions. Petrogenetic grids in KFMASH and KFMASHTO are similar in topology to those produced with earlier end-member datasets and a–x relations, but with some notable differences. In particular, in subsolidus equilibria, the FeO/(FeO + MgO) of garnet is now greater than in coexisting staurolite, bringing a number of key staurolite-bearing equilibria into better agreement with inferences from field and petrographic observations. Furthermore, the addition of Fe3+ and Ti to a number of silicate phases allows more plausible equilibria to be calculated in relevant systems. Pseudosections calculated with the new a–x relations are also topologically similar to equivalent diagrams using earlier a–x relations, although with many low variance fields shifting in P–T space to somewhat lower pressure conditions.
Introduction
Quantitative phase petrology has developed over the last decades into a widely used approach for understanding the evolution of metamorphic rocks and for deriving P–T information. Such progress has been firmly rooted in the development of better thermodynamic data for the end-members of minerals, fluid and melt, improved and extended activity–composition (a–x) relations for minerals and the improvement of software to undertake calculations. Using these tools, metamorphic petrologists have increased understanding of many metamorphic processes and placed better quantitative constraints on the conditions of formation of metamorphic rocks. Despite this progress, there remain many limitations and sources of uncertainty in the approach. In particular, it is the lack of, or limits on, the a–x relations that currently represents the greatest constraint on the efficacy of the approach. Existing sets of a–x relations of minerals (e.g. White et al., 2001 2007; Diener & Powell, 2012) were built up over more than a decade using a range of approaches, different dataset versions and different a–x relations for the other minerals involved. This has resulted in inherent inconsistencies between the a–x relations for the different minerals of interest. This is reflected in calculated mineral compositions and mineral proportions being unreliable, even if fields in pseudosections can commonly be found to match those observed in rocks.
The release of the newly updated internally consistent thermodynamic dataset of Holland & Powell (2011) offers an opportunity for reparameterizing and substantially improving a–x relations. In fact, the previous family of a–x relations as used with the Holland & Powell (1998) dataset are not valid for use with the new dataset and must be replaced, for the following reasons: (i) An advance in dataset generation means that a wider range of experimental data involving solid solutions are used, requiring that parts of the overall a–x relations must be defined in the derivation of the dataset. (ii) Some end-members in the dataset, for example the biotite end-member, annite, are handled differently, leading to an improved calibration. All experiments involving annite sensu lato involve a biotite that contains ferric iron even under the most reducing conditions and this ferric iron was treated as ferrous iron in previous dataset generation. Given the pivotal position of biotite in many phase equilibria calculations, this change to annite is significant in the establishment of a new set of a–x relations. (iii) Most of the thermodynamic properties of ‘fictive’ or ‘made’ end-members, or those of dataset end-members considered in need of modification, are no longer appropriate. They have been calibrated against a specific set of end-member data (e.g. Holland & Powell, 1998) and extant a–x relations. Exceptions are anorthite in plagioclase and those involved in ilmenite. Any significant change to the dataset being used, or any attempt to use these a–x relations with different datasets, should involve recalibration of these fictive end-member properties. With the development of the new dataset of end-member thermodynamic data by Holland & Powell (2011), the usefulness of the existing a–x relations for ongoing development has expired.
In this paper, we present a set of a–x relations for common metapelitic minerals that are designed for use with the latest Holland & Powell dataset, ds6 (Holland & Powell, 2011). These a–x relations employ a more consistent approach to generation of a–x relations with an extension of the composition space for several minerals. The approach followed is described in the companion paper (Powell et al., 2014). One major requirement of the calibration strategy is that, ultimately, the a–x relations for various minerals must be adjusted such that appropriate phase diagrams can be calculated with the a–x relations as a set. Thus, parameterizing all of the a–x relations together, rather than piecemeal as before, is in itself an advance, especially with regard to the fictive end-members. Calculated petrogenetic grids and pseudosections, in key systems ranging from K2O–FeO–MgO–Al2O3–SiO2–H2O (KFMASH) to Na2O–CaO–K2O–FeO–MgO–Al2O3–SiO2–H2O–TiO2–O2 (NCKFMASHTO), are used to validate and apply the new set of a–x relations. The phase diagrams show the key equilibria present in common metapelite compositions. Given that a much larger set of minerals are considered than in earlier calculations, the calculations are more comprehensive than earlier ones in NCKFMASHTO. Extension of the NCKFMASHTO system to include MnO will be dealt with in a forthcoming paper.
Activity–Composition Relations
While recognizing that for petrological calculations for metapelites the chemical system of interest is at least as large as NCKFMASHTO, there are significant problems in generating a set of thermodynamic descriptions of minerals that is appropriate for this system because the experimental data that underpin the calibration of end-member properties and a–x relations are simply not extensive enough. Most earlier studies (e.g. White et al., 2001 2007) considered only limited extension of minerals away from their ‘core’ compositions. For example, Fe3+ was only considered in garnet, biotite, chloritoid and the Fe–Ti oxides for subsolidus calculations, despite the importance of Fe3+ in other minerals such as chlorite and staurolite (e.g. Dyar et al., 2002). However, a greater range of components should be included in the minerals for reliable phase equilibria modelling. In addition, order–disorder needs to be considered in all minerals where Mg–Fe2+ mix on more than one site.
In general, there is insufficient information in petrologically realistic systems to calibrate the a–x relations via a formal fitting approach. For this reason, Powell et al. (2014) proposed instead to parameterize the a–x relations based on what is believed to be known about these properties, i.e. about the shape of Gibbs energy as a function of composition, pressure and temperature. The process, referred to as regularization in Powell et al. (2014), allows extension of a–x relations from where data exist and may be used in calibration, to where little or nothing is known. In this, heuristics1are used to approximate values for poorly constrained or unconstrained properties, either based on previous experience or by analogy with other better-understood phases.
To start with, following for example Powell & Holland (1993), a–x relations are written in terms of ideal-mixing-on-sites and, separately, activity coefficients. The activity coefficients are written in terms of macroscopic interaction energies, Wij, between each pair of end-members, that can be considered to be constructed from the same-site and cross-site microscopic pair-wise interactions between cations on sites, wkℓ (see Powell & Holland, 1993).
A key aspect in regularization is to disassemble the macroscopic W into their constituent microscopic w, then make simplifications and approximations to them, before reassembling the macroscopic W. In principle, if this is done judiciously, then the number of unknowns compared with the number of W is dramatically reduced. Then, if possible, analogies are made with thermodynamically better-understood minerals to provide values for the unknowns.
 (1)
(1)
In all these examples, the enthalpy changes are implemented as dqf parameters (in thermocalc data files). Such enthalpies commonly require refinement via comparing the results of phase equilibrium calculations with mineral assemblage and mineral composition data for rocks. Among all the aspects of a–x relation parameterization, it is with respect to finding appropriate values for the dqfs, especially for ‘made’ end-members, that it is most critical to consider the whole set of a–x relations simultaneously, for it is only in a few cases that there are data available to constrain a particular dqf in isolation. Typically, any dqf for made end-members constrained via fitting natural data has large uncertainties and may require further fine-tuning within those uncertainties. Therefore, at the appropriate stage in the parameterization process, key phase diagrams were repeatedly recalculated until a set of dqfs were established for which all of the calculated phase compositions in terms of the dqf-adjusted end-members were consistent with natural constraints over a wide P–T range. Particular attention was paid to the relative conversion ratios of Fe2+ to Fe3+ among the phases, with the relevant parameters being adjusted to give increasing proportions of Fe3+ in the order cordierite (no Fe3+) < garnet < chloritoid < orthopyroxene < chlorite ≈ staurolite < biotite, broadly consistent with that of Dyar et al. (2002).
Using the approach outlined in Powell et al. (2014) and summarized above, new a–x relations have been developed for the common minerals occurring in metapelitic rocks. These a–x relations include extension of the composition space of the solid solutions, changes to formalism and inclusion of Mg–Fe2+ order–disorder, along with new parameterization of the macroscopic W. Full thermodynamic descriptions and explanatory information for minerals and melt are given in the . In addition to the reparameterization of the mixing properties, the key changes to the a–x relations compared with the ds55-set are: inclusion of Ca and an asymmetric mixing model (asf, Holland & Powell, 2003) for orthopyroxene, a symmetric model (sf, Powell & Holland, 1993) for cordierite, inclusion of Ti and Fe3+ in staurolite, inclusion of Fe3+ and Mg–Fe2+ order–disorder in chlorite and inclusion of Mg in ilmenite–hematite. The composition space, order–disorder parameters and formalisms for the a–x relations are summarized in Table 1.
| phase | form. | H2O | SiO2 | Al2O3 | CaO | MgO | FeO | K2O | Na2O | TiO2 | O | O–D |
|---|---|---|---|---|---|---|---|---|---|---|---|---|
| g | asf | ∘ | ∘ | ∘ | ∘ | ∘ | ∘ | |||||
| opx | asf | ∘ | ∘ | • | ∘ | ∘ | ∘ | Fe–Mg | ||||
| sp | sf | ∘ | ∘ | ∘ | ∘ | ∘ | ||||||
| cd | sf | ∘ | ∘ | ∘ | ∘ | ∘ | ||||||
| st | sf | ∘ | ∘ | ∘ | ∘ | ∘ | • | • | ||||
| chl | sf | ∘ | ∘ | ∘ | ∘ | ∘ | • | Mg–Al, Fe–Mg | ||||
| ctd | sf | ∘ | ∘ | ∘ | ∘ | ∘ | ∘ | |||||
| bi | sf | ∘ | ∘ | ∘ | ∘ | ∘ | ∘ | ∘ | ∘ | Fe–Mg | ||
| mu–pa | asf | ∘ | ∘ | ∘ | ∘ | ∘ | ∘ | ∘ | ∘ | ∘ | ||
| ma | asf | ∘ | ∘ | ∘ | ∘ | ∘ | ∘ | ∘ | ∘ | ∘ | ||
| ksp–pl | asf | ∘ | ∘ | ∘ | ∘ | ∘ | ||||||
| ep | sf | ∘ | ∘ | ∘ | ∘ | ∘ | Al–Fe3+ | |||||
| ilm–hem | sf | • | ∘ | ∘ | ∘ | Ti–Fe3+ | ||||||
| mt (low T) | sf | ∘ | ∘ | ∘ | Fe–Fe3+ | |||||||
| mt (high T) | sf | ∘ | ∘ | ∘ | ∘ | ∘ | ||||||
| liq | sf | ∘ | ∘ | ∘ | ∘ | ∘ | ∘ | ∘ | ∘ |
Phase Diagram Calculations
The phase diagrams involving the new a–x relations were calculated using thermocalc version 3.36 and the internally consistent end-member dataset of Holland & Powell (2011), ds61 (created 13 November 2011). In the following, this is referred to as the ‘ds6-set’. Diagrams calculated with the dataset of Holland & Powell (1998), ds55 (created 22 November 2003), for comparison with the newer ones, used thermocalc version 3.33 and the most recent set of ds55-era a–x relations (see the thermocalc website, http://www.metamorph.geo.uni-mainz.de/thermocalc/). In the following, this is referred to as the ‘ds55-set’. Calculations were undertaken in chemical systems ranging from KFMASH to NCKFMASHTO. The phases and phase abbreviations included in the modelling are: garnet (g), orthopyroxene (opx), sillimanite/kyanite/andalusite (sill/ky/and), sapphirine (sa), spinel (sp), cordierite (cd), staurolite (st), chlorite (chl), chloritoid (ctd), biotite (bi), muscovite (mu), paragonite (pa), margarite (ma), K-feldspar (ksp), plagioclase (pl), albite (ab), epidote (ep), sphene (sph), ilmenite (ilm), hematite (hem), magnetite (mt), rutile (ru), quartz (q) and melt (liq).
The impetus for the new diagrams that follow comes from recognizing that the thermodynamic dataset of Holland & Powell (2011) and the new regularized a–x relations represent an improvement over the older calculational framework. The calculated diagrams presented in the next sections are designed to illustrate the effect of these changes. Because critical experimental data are lacking, reliance on rock-based phase equilibria and mineral compositions inevitably underpins the modifications to dataset enthalpies and a–x relations used in both the earlier and the newer calculations. Bulk rock compositions for the pseudosections are given in Table 2.
| mol. % | H2O | SiO2 | Al2O3 | CaO | MgO | FeO | K2O | Na2O | TiO2 | O |
|---|---|---|---|---|---|---|---|---|---|---|
| Fig. 4 | 6.56* | 68.76 | 9.87 | – | 4.01 | 7.64 | 3.16 | – | – | – |
| Fig. 5a | + | 74.363 | 9.496 | 0.297 | 3.862 | 7.565 | 3.045 | 0.605 | 0.662 | 0.106 |
| Fig. 5b | + | 74.021 | 9.452 | 0.296 | 3.844 | 7.530 | 3.031 | 0.602 | 0.659 | 0.565 |
| Fig. 7 | + | 68.545 | 16.576 | 0.274 | 3.560 | 6.973 | 2.807 | 0.557 | 0.610 | 0.098 |
| Fig. 8a x = 0 | + | 74.434 | 9.505 | 0.297 | 3.866 | 7.572 | 3.048 | 0.605 | 0.663 | 0.011 |
| x = 1 | + | 73.744 | 9.417 | 0.295 | 3.830 | 7.502 | 3.020 | 0.600 | 0.657 | 0.938 |
| Fig. 8b,c x = 0 | + | 74.019 | 9.452 | 0.296 | 0.011 | 11.363 | 3.031 | 0.602 | 0.659 | 0.568 |
| x = 1 | + | 74.441 | 9.506 | 0.297 | 11.428 | 0.011 | 3.048 | 0.605 | 0.663 | 0.0005 |
| Fig. 8d x = 0 | + | 68.511 | 16.568 | 0.274 | 0.010 | 10.518 | 2.805 | 0.557 | 0.610 | 0.147 |
| x = 1 | + | 68.612 | 16.593 | 0.274 | 10.533 | 0.010 | 2.809 | 0.558 | 0.611 | 0.00014 |
| Fig. 9a | 6.544 | 69.496 | 8.874 | 0.278 | 3.609 | 7.070 | 2.846 | 0.565 | 0.619 | 0.099 |
| Fig. 9c | 6.516 | 69.198 | 8.836 | 0.276 | 3.594 | 7.039 | 2.833 | 0.563 | 0.616 | 0.528 |
| Fig. 10a x = 0 | 6.550 | 69.559 | 8.882 | 0.278 | 3.612 | 7.076 | 2.848 | 0.566 | 0.619 | 0.010 |
| x = 1 | 6.493 | 68.956 | 8.805 | 0.275 | 3.581 | 7.015 | 2.824 | 0.561 | 0.614 | 0.877 |
| Fig. 10b x = 0 | 6.516 | 69.198 | 8.836 | 0.276 | 0.010 | 10.623 | 2.833 | 0.563 | 0.616 | 0.528 |
| x = 1 | 6.516 | 69.198 | 8.836 | 0.276 | 9.577 | 1.056 | 2.833 | 0.563 | 0.616 | 0.528 |
| Fig. 11a | + | 64.693 | 13.676 | 1.589 | 5.538 | 8.040 | 2.948 | 2.006 | 0.906 | 0.603 |
| Fig. 11c | 5.815 | 60.930 | 12.880 | 1.497 | 5.216 | 7.572 | 2.777 | 1.890 | 0.855 | 0.568 |
- +, H2O in excess; *, H2O taken as in-excess for subsolidus part of diagram
P–T projections
KFMASH
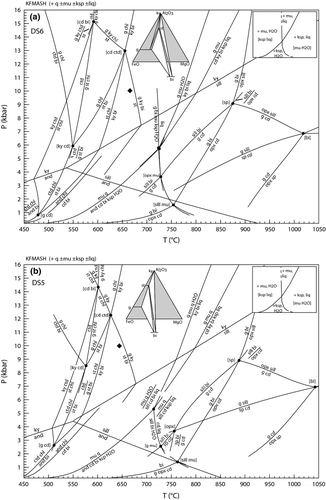
KFMASH is the simplest system in which the key univariant equilibria in metapelites can be represented and was calibrated semi-quantitatively in the classic study of Harte & Hudson (1979). This system was also used in the first calculated pseudosection for rocks by Powell & Holland (1990). Figure 1a shows a petrogenetic grid in this system calculated using the ds6-set that extends from subsolidus (450 °C) to suprasolidus conditions (1050 °C) and from 0.2 kbar to 16 kbar. The in-excess phases in the diagram involve combinations of quartz, muscovite, H2O-fluid, K-feldspar and melt, with quartz always present, and the disposition of the other in-excess phases controlled by the muscovite + quartz breakdown reactions for muscovite v. K-feldspar and the wet solidus for H2O v. melt, as shown in the inset in Fig. 1a. As a–x relations for osumilite have not yet been developed for use with the Holland & Powell (2011) dataset, the grid does not include it. This means that some of the higher temperature equilibria, especially the reactions emanating from the [bi] invariant, may be metastable along part or all of their length relative to osumilite-bearing equilibria. Higher temperature equilibria involving sapphirine are also not shown, but these relationships are presented in Wheller & Powell (2014).
 (2)
(2) (3)
(3) (4)
(4) (5)
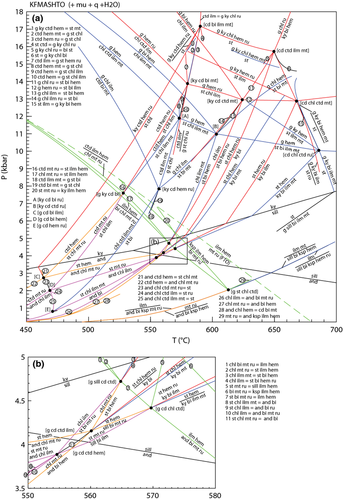
(5)KFMASHTO
 (6)
(6) (7)
(7) (8)
(8) (9)
(9)
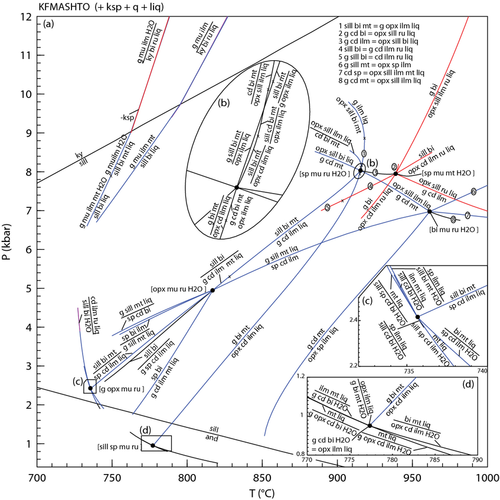
In the high-T grid (Fig. 3), no ru–mt-bearing equilibria are stable and above ∼740 °C, a complete solid solution exists between hematite and ilmenite. Thus, the equilibria can involve an ilm–hem solid solution (hereafter labelled ilm) coexisting with either rutile (red lines) or magnetite (blue lines) and the grid is somewhat simpler than that at lower temperature. Furthermore, only one of the stable KFMASH invariant points [sp] occurs as a pair of invariant points in KFMASHTO ([sp mu ru H2O] and [sp mu mt H2O]), each at a higher temperature than their KFMASH equivalents. The inclusion of Fe3+ and Ti has a profound effect on the P–T conditions of equilibria involving biotite and/or spinel, resulting in the stabilization of the [opx mu ru H2O] invariant point at around 815 °C and 5 kbar – the equivalent KFMASH [opx] point is not stable. Compared with ilm–mt-bearing equilibria, only a limited number of ilm–ru-bearing univariant equilibria are stable, restricted to high P–T.
Pseudosections
While P–T grids are useful for showing the overall stability of low variance assemblages, they do not show higher variance equilibria or show those equilibria seen by a fixed bulk composition. Furthermore, as the number of compositional components considered in the modelling increases, there is a tendency towards the stabilization of higher variance equilibria, which limits the usefulness of petrogenetic grids.
KFMASH
Figure 4 shows P–T pseudosections for a model metapelite composition in KFMASH constructed using the a–x relations here and the ds6 dataset (Fig. 4a), and the older a–x relations and the ds55 dataset (Fig. 4b). Both pseudosections show similar mineral assemblage fields with a small chloritoid field stable additionally in Fig. 4b. With the ds6-set, the stability of staurolite-bearing assemblages has shifted to higher temperature and lower pressure, with univariant reaction 3 now seen by the bulk composition in the sillimanite field. At the core of the differences in the pseudosections are (i) the change in some of the reactions (e.g. reaction 2 v. 3) and the shifting of the key univariant equilibria in Fig. 1, with reaction 3 now terminating in KFASH at lower pressure; and (ii) the composition range of the enclosing quadrilateral as defined by the four AFM minerals in each reaction occupying a different, more magnesian, space on an AFM compatibility triangle. This can be seen in the AFM plots presented in Fig. 1, each calculated at the same pressure, and at the same temperature below the reaction (shown as a filled diamond in Fig. 1). The predicted composition of the ferromagnesian minerals with the ds6-set is somewhat more magnesian than for the earlier a–x relations used for Fig. 4b, such that a single bulk composition will now see this reaction at lower pressure.
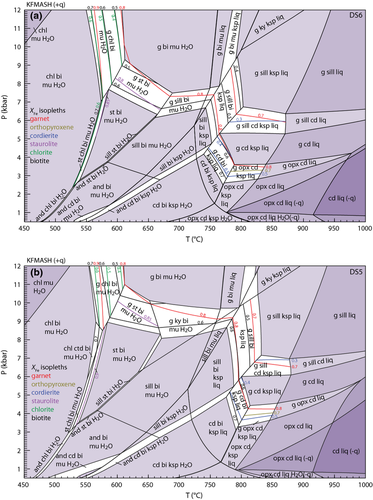
Selected divariant fields in Fig. 4 are contoured for the FeO/(FeO + MgO) of the main ferromagnesian phases to highlight the compositions of coexisting phases. As can be seen, the compositions in equivalent fields in both pseudosections are similar, reflecting the fact that each divariant field reflects the passing of a AFM tie-triangle across the fixed rock composition. However, these divariant fields and the composition contours lie at lower pressure in ds6-set compared with ds55-set, especially for the near-isobaric trending g–st–bi and g–sill/ky–bi fields. For example, at 600 °C, the biotite xFe = 0.6 contour in the g–st–bi field lies at ≈7.8 kbar in Fig. 4a and at ≈9.1 kbar in Fig. 4b.
The suprasolidus equilibria in Fig. 4 for the ds6-set and the ds55-set are topologically more similar than those at lower temperature. However, there is also a shift to lower pressure for equivalent divariant equilibria in the suprasolidus parts of the diagrams, although this shift is relatively small with most assemblage boundaries shifting down pressure by <1 kbar. As with the subsolidus equilibria, the xFe of the main ferromagnesian phases in key divariant fields are similar. However, here the shift down pressure of a given composition isopleth is less than that in the subsolidus fields discussed above.
Subsolidus NCKFMASHTO
The a–x relations presented here permit calculations in the NCKFMASHTO system, allowing more realistic modelling of common mineral assemblages present in metapelitic rocks than with smaller systems. The addition of Fe3+ and Ti introduces the oxide minerals, and the inclusion of Na and Ca allows plagioclase, albite (below the peristerite gap), paragonite, margarite, epidote and sphene to be additionally considered in the calculations. However, most of these minerals are restricted to subsolidus conditions with the exception of plagioclase and, at temperatures just above the solidus, paragonite. Thus, calculations for greenschist to amphibolite facies conditions potentially involve a moderate to large number of low variance fields, whereas those at higher grade are dominated by higher variance fields.
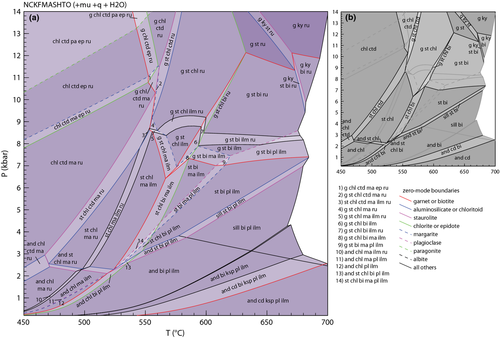
Calculated pseudosections in the NCKFMASHTO system for subsolidus conditions using the ds6-set are shown in Fig. 5. As these diagrams involve a large number of fields, making them potentially difficult to read clearly, summary diagrams outlining the stability of the main sets of minerals are given in Fig. 6. For each pseudosection in Fig. 5, three summary diagrams are presented. The first of each (Fig. 6a,d) shows the distribution of the main AFM silicate assemblages (e.g. g–st–bi), the second shows the distribution of oxide assemblages along with epidote and sphene (Fig. 6b,e) and the third shows the stability of white mica and feldspar assemblages (Fig. 6c,f).

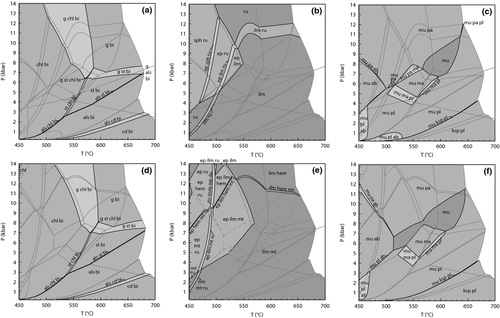
The P–T pseudosections in Fig. 5a,b are constructed for Fe3+/(Fe3+ + Fe2+) proportions of 0.03 and 0.15 respectively. The main assemblages in the two diagrams differ little, with the exception of the sets of oxide minerals present and the absence of sphene in Fig. 5b. The low Fe3+ diagram is dominated by ilmenite, rutile and sphene-bearing assemblages, with rutile limited to high pressures and to low temperatures (Figs 5a & 6b). By contrast, the more oxidized composition shows a more diverse set of oxide assemblages (Figs 5b & 6e), with magnetite and hematite also present. Ilmenite is present in all but the lowest temperature fields. A series of univariant equilibria at about 9 kbar and 450–500 °C involve three or four Fe–Ti oxide minerals that together broadly approximate reaction 9. While the differences in Fe3+/(Fe3+ + Fe2+) contents between Fig. 5a and Fig. 5b result in markedly different oxide mineral stabilities, the effects on the key ferromagnesian assemblages are relatively minor, with both pseudosections in Fig. 5 having nearly identical silicate assemblages (Fig. 6). However, the different Fe3+/(Fe3+ + Fe2+) proportions, and consequently the slightly different xFe values, result in differences in where these assemblages occur in P–T space, with the equivalent assemblages in Fig. 5b occuring at slightly higher P–T conditions than those in Fig. 5a. The AFM silicate assemblages in NCKFMASHTO can also be compared with those in the simple KFMASH system (Fig. 4). Calculations in the two systems have the same overall topology with regard to the AFM silicate assemblages, but again exhibit a shift in their overall P–T locations.
In both P–T pseudosections in Fig. 5, muscovite commonly coexists with combinations of paragonite, margarite, plagioclase and albite (Fig. 6). Paragonite is limited to higher pressures, and margarite is predicted to be present in small amounts in a series of P–T fields at 4–8 kbar and 520–600 °C (Figs 5a,b & 6c). All three white mica are predicted within a small set of fields close to 7 kbar and 550 °C. At low-P and high-T plagioclase is present and K-feldspar is additionally present below about 3 kbar. Albite and plagioclase are both stable in a series of narrow fields at low P–T, representing the peristerite solvus, with albite-bearing assemblages to lower temperature and plagioclase-bearing ones to higher temperature (Figs 5a,b & 6c,f).
Metapelites may also exhibit a significant range of Al2O3 contents, with highly aluminous metapelites common in many metamorphic terranes. Figure 7 shows a P–T pseudosection for such a metapelite composition derived by increasing the Al2O3 content of that used for Fig. 5a. Compared with the less aluminous compositions (Fig. 5), Fig. 7 shows a much more diverse range of ferromagnesian silicate assemblages, summarized in Fig. 7b. The most notable difference is the appearance of chloritoid-bearing assemblages in Fig. 7, changes to biotite stability, which is here restricted to amphibolite facies conditions, as the bulk composition now lies above the g–chl tie-line in an AFM diagram, and the expansion of staurolite stability to higher pressure. As expected, increasing the Al2O3 content increases the stability field for the aluminosilicates. Andalusite is stable at low pressure (< 2.5 kbar) across the temperature range considered and kyanite is present in the top right corner of the diagram. However, the the overall stability increase of aluminosilicate, as reflected in the larger number of aluminosilicate-bearing fields, is less than might be expected considering the higher Al2O3 contents. This is because most bulk compositions that plot below staurolite in AFM will not develop aluminosilicate while staurolite is stable, it effectively forming a compositional barrier in AFM. This feature can be seen in its simplest form in the AFM triangle in Fig. 1a. The new tie-triangle and tie-line relationships mean that assemblages involving ky–st–bi will require bulk compositions with slightly higher xMg in comparison with the ds55-set results. Given that the modelled composition here is a Fe-rich one (xMg = 0.34), such higher xMg contents are likely to be relatively common, especially in moderately oxidized rocks.
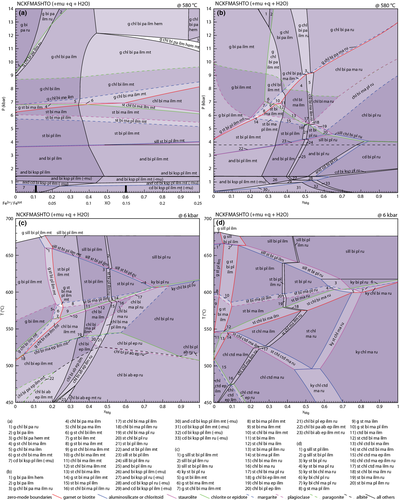
The relationship between the Fe3+ content of the bulk composition and the stable oxide minerals is further highlighted in a P–xO pseudosection calculated at 580 °C (Fig. 8a). At this temperature, the main effect of increasing the Fe3+ content of the bulk composition is to stabilize magnetite in addition to ilmenite. However, at higher pressure, rutile is stable at lower Fe3+ contents and hematite is stable at higher Fe3+ contents. The stabilities of the major silicate assemblages are only weakly affected over this P–xO range, although the stability fields of garnet and staurolite do change, largely due to the consequent decrease in xFe as Fe2+ is converted to Fe3+.
Despite the addition of Na2O, CaO, TiO2 and Fe2O3 and the consequent inclusion of a number of additional minerals, the core equilibria present in the KFMASH pseudosections persist relatively unchanged into the NCKFMASHTO pseudosections. The influence of considering these extra components on the stability of the common AFM ferromagnesian phases can be seen by comparing Figs 4, 6. For the bulk compositions used here, the two systems result in very similar topological distribution of key ferromagnesian assemblages, although with differences in the P–T conditions of each assemblage. However, this similarity is not universal, especially for bulk compositions containing higher proportions of non-KFMASH components (e.g, Johnson et al., 2008) and/or those with higher Fe2O3 contents. For example, White et al. (2001), Johnson et al. (2008), Diener & Powell (2010), Korhonen et al. (2012) and Boger et al. (2012) all showed that high Fe2O3 contents may have an important influence on the stability of the main ferromagnesian assemblages.
The primary compositional controls on the stable ferromagnesian silicate mineral assemblage at a given P–T in metapelites are the relative proportions of Al2O3, FeO and MgO (e.g. Thompson, 1957). The pseudosections presented in Fig. 5 were constructed for a typical metapelite composition in terms of the components Al2O3, FeO and MgO and that in Fig. 7 for a typical aluminous metapelite. However, metapelitic rocks show significant variation in these components. The influence of xMg on the stability of key assemblages is shown in a P–xMg pseudosection (Fig. 8b) and a T–xMg pseudosection (Fig. 8c) based on the composition used in Fig. 5. A T–xMg pseudosection (Fig. 8d) based on the composition used in Fig. 7 shows the effect of varying xMg for aluminous compositions. For Fig. 8b–d, the value for O was adjusted so that the Fe3+/(Fe3+ + Fe2+) proportion was constant (at 0.1) across the diagram.
In Fig. 8b, as expected from AFM diagrams, the compositions with lower xMg are dominated by garnet-bearing and staurolite-bearing assemblages and those with higher xMg by chlorite-bearing and cordierite-bearing assemblages. Biotite is stable across the diagram. Garnet-bearing assemblages show a substantial shift in stability with garnet present above about 4 kbar at x = 0, shifting to above ≈13 kbar at x = 1. Staurolite-bearing assemblages are restricted to pressures of ≈3–7 kbar and xMg values below approximately 0.6. The stability of cordierite-bearing assemblages increases from <1 kbar to >4 kbar with increasing xMg. The change in xMg across the diagram also results in changes in the oxide phases as less Fe2+ iron is available and a greater proportion of the Fe3+ can be incorporated in the silicate minerals, a feature present in Fig. 8c,d as well. At low xMg, the silicate assemblage coexists with ilmenite and magnetite. With increasing xMg magnetite is lost (at xMg≈0.3) and rutile becomes present at xMg > 0.4–0.5 with ilmenite lost from the assemblage at an xMg < 0.1 above the rutile-in line.
In the T–xMg pseudosection at 6 kbar (Fig. 8c), greenschist facies assemblages are chlorite–biotite-bearing with garnet additionally present at low xMg and chlorite-bearing fields stable up to higher temperature with increasing xMg. Staurolite-bearing assemblages occupy a broadly triangle-shaped set of fields at ≈ 560–660 °C and xMg of 0.2–0.7 coexisting with combinations of garnet, aluminosilicate and biotite. Garnet-bearing assemblages are restricted to low xMg < 0.25 and aluminosilicate to temperatures above ≈ 600 °C, with kyanite-bearing assemblages restricted to higher xMg.
In the T–xMg pseudosection for the aluminous composition (Fig. 8d), biotite has a substantially restricted stability field compared with the less aluminous compositions – biotite is present at > 510 °C for FeO-rich compositions and moving up temperature to about 600 °C for MgO-rich compositions. Below this, assemblages are dominated by combinations of chlorite, chloritoid, staurolite and kyanite with chlorite stable across the xMg range, chloritoid restricted to low xMg, staurolite present at intermediate xMg and kyanite occurring at high xMg. Garnet is restricted overall to low xMg and aluminosilicate is only present in all compositions at the highest temperature conditions.
Suprasolidus NCKFMASHTO
 (10)
(10) (11)
(11)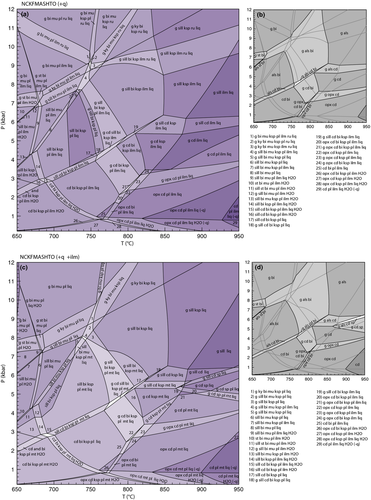
Compared with pseudosections constructed with earlier sets of a–x relations (e.g. fig. 7, White et al., 2007), those constructed with the ds6-set are topologically similar, although the small cluster of spinel-bearing fields in fig. 7 of White et al. (2007) is not replicated here. The only other notable difference is the appearance of a small set of suprasolidus staurolite-bearing fields just above the wet solidus at 7–8 kbar (Fig. 9), reflecting the increased up-temperature stability of staurolite. The phase relationships controlling staurolite stability also limit the stability of kyanite in these compositions, with kyanite now appearing just above the solidus compared with just below it using the earlier a–x relations. The presence of staurolite at P–T conditions just above the solidus has been noted in several experimental studies (e.g. Thompson & Connolly, 1995; García-Casco et al., 2003; Ferri et al., 2009).
The effect of increasing the bulk Fe3+/(Fe3+ + Fe2+) ratio can be seen in the P–xO pseudosection calculated for 820 °C (Fig. 10a). Varying the Fe3+/(Fe3+ + Fe2+) ratio over the range shown in Fig. 10a (0–0.25) has only a minor effect on the stability of the silicate assemblages which form subhorizontal (near isobaric) bands across the diagram (Fig. 10a). However, increasing the Fe3+/(Fe3+ + Fe2+) ratio to much higher values will more strongly affect the xFe and hence the position of fields in P–T. The diagram is dominated by assemblages containing combinations of garnet, sillimanite and biotite at pressures above 5–6 kbar. A near-horizontal divariant field marks the incoming of cordierite and represents the multivariant equivalent of reaction 10 and at pressures below this biotite–sillimanite-bearing assemblages are no longer stable. The main effect of varying the Fe3+ /(Fe3+ + Fe2+) ratio is on the coexisting oxide minerals. Ilmenite is stable across the diagram, except for a field at the highest pressure and lowest Fe3+ contents. Additionally, the ilmenite–hematite solid solution is closer to a hematite composition in the high-P–high-Fe3+ part of the diagram (ilm is the abbreviation for ilmenite sensu lato, representing the complete ilmenite-hematite solid solution). The fields in the low-P–high-Fe3+ part of the diagram all contain magnetite and those in the high-P–low-Fe3+ part of the diagram all contain rutile.
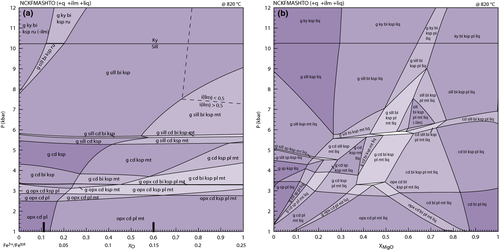
The effect of xMg on the stable assemblage is shown in a P–xMg pseudosection calculated for 820 °C (Fig. 10b) The assemblages show more change as a function of xMg at pressures below 5kbar. Here, garnet–spinel-bearing assemblages are stable up to xMg = 0.3. These assemblages typically also involve sillimanite and/or cordierite. Orthopyroxene-bearing assemblages occupy a triangular stability field at intermediate xMg and pressures below about 3 kbar. The small near horizontal divariant field with the assemblage g–opx–cd–bi–ksp–pl–mt–liq is equivalent to univariant reaction 11. This field also controls the stability of garnet-bearing assemblages with garnet-absent, cordierite–biotite-bearing assemblages extending to higher xMg.
As with the subsolidus P–xMg pseudosection (Fig. 5), varying xMg at a constant Fe3+/(Fe3+ + Fe2+) ratio also results in changes in the oxide minerals present at high-T, but the changes are less profound. Ilmenite is present in all fields except a few fields close to 7kbar and xMg = 0.65, and magnetite is restricted to pressures below about 9kbar and xMg < 0.88.
An average metapelite composition
The synthetic compositions used in the preceding pseudosections highlight the main phase diagram features of the ds6-set and provide a useful comparison with earlier studies that used the same compositions (e.g. White et al., 2007). However, they are not necessarily representative of natural compositions. A subsolidus (Fig. 11a) and a suprasolidus (Fig. 11c) pseudosection were calculated for the average amphibolite facies metapelite composition given in Ague (1991). For the calculations here, the Fe3+/(Fe2+ + Fe3+) was set at 0.15 (Table 2). Compared with the synthetic compositions, this composition has a higher MgO/(FeO + MgO) and is richer in CaO and Na2O. For the subsolidus pseudosection, the higher MgO/(FeO + MgO) results in a more restricted field of garnet stability and expanded stability of kyanite–staurolite-bearing assemblages (Fig. 11a,b). However, overall, the diagram has many topological similarities with pseudosections constructed for the less-aluminous synthetic compositions. As with the pseudosections constructed for the synthetic compositions, Fig. 11a also contains a series of margarite-bearing fields.
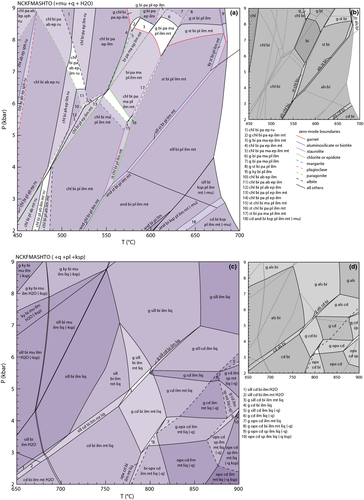
The P–T pseudosection for suprasolidus conditions (Fig. 11c) is also topologically similar to those presented earlier for sub-aluminous metapelites (e.g. Fig. 9) with the key low variance equilibria involving g–sill–cd–bi and g–opx–cd–bi both present and controlling the main higher variance assemblages (Fig. 11c,d). The higher xMg of this composition means that these equilibria occur at slightly higher P–T than in Fig. 9. The higher Na2O and CaO content for Fig. 11c results in a much more extensive stability field for plagioclase and the lower SiO2 content results in a series of quartz-absent fields and some spinel-bearing fields at high-T–low-P conditions.
Discussion and Conclusions
The new Holland & Powell (2011) internally consistent dataset now requires a revised set of consistent a–x relations for minerals to make reliable calculations for rocks. The work presented here is a first attempt to generate the a–x relations for a large number of phases that commonly co-exist in metapelites so that they behave well together in terms of replicating common metapelitic assemblages. Calculated phase diagrams using the ds6-set are topologically similar to those calculated with the ds55-set, and thus match observations on rocks in a general way. However, there are shifts in the absolute P–T conditions of invariant and univariate equilibria, which lead to similar shifts in the P–T stability of higher variance equilibria in pseudosections. Thus, the ds6-set succeeds in reproducing the main equilibria seen in the metapelitic bulk compositions. Although the new calculated phase diagrams are more consistent with observations for staurolite-bearing equilibria, especially regarding the terminal staurolite reaction, and are almost certainly more realistic for equilibria in Fe3+- and Ti-bearing systems, there remains much scope for further refinement in relation to what is observed in rocks.
In comparison with earlier studies (e.g. White et al., 2001, 2002, 2007), a more complete set of phases is considered here, especially for calculations at subsolidus conditions. A consequence of this is that the calculated phase diagrams may be much more complicated than earlier ones and somewhat harder to read. For example, Fig. 5a, in the largest system considered here (NCKFMASHTO), has over 80 multivariant mineral assemblage fields. Such complexity is an inherent feature of the greater number of phases considered, but the diagrams still maintain the key topological structure of the subsystem relationships that underpin them. The diagram in NCKFMASHTO can be viewed as the superposition of three main mineralogical/compositional systems, linked by phases in common to more than one system. For this system, there are the classic KFMASH relationships between the ferromagnesian silicates, the Fe2O3–FeO–TiO2 equilibria between the oxide minerals and the equilibria between the CaO–Na2O–K2O-bearing feldspars and white mica, along with sphene and epidote. Interdependencies arise, for example, from (a) the core ferromagnesian minerals that show the classic AFM relationships linking with the Fe2O3–FeO–TiO2 equilibria via the inclusion of Fe2O3 and TiO2 in many of the ferromagnesian silicates, and from (b) MgO in ilmentite–hematite and spinel–magnetite, but the key features of each of these two subsets remain. These relationships can be more easily seen in the assemblage summary diagrams (Fig. 6) than in the full pseudosections on which they are based.
A feature of the ds6-set is that for the same P–T conditions, calculations result in more Mg-rich compositions for the ferromagnesian minerals compared with calculations using the ds55-set. This is mainly because an attempt has been made to include a realistic amount of Fe3+ in the minerals in the ds6-set. This arises in part from changes in the end-member data in the Holland & Powell (2011) dataset, particularly with the handling of the annite end-member of biotite, as discussed above, and in part from the approach used in making the ds6-set a–x relations. Importantly, in application of the ds6-set to rocks, a realistic estimation of bulk Fe2O3 content is required, in which case an increase of the calculated xMg in the minerals will result. The treatment of Fe3+ in minerals and bulk compositions, in rocks as well as in the ds6-set, is an ongoing issue that will require continued attention as more data become available. Nevertheless, simply ignoring the potential effect of Fe3+ via assuming all iron is Fe2+ is not tenable. Ignoring Fe2O3 in either the chemical system used or using an inappropriate amount in a bulk composition used to model a rock is likely to result in biased, or even spurious results.
All four subsolidus NCKFMASHTO pseudosections ( Figs 5a,b 7 & 11) show a small- to moderate-sized field of margarite stability, albeit with a low mode of margarite (<2%). Relatively few studies report the presence of margarite in common metapelitic rocks, and the majority that do report it as a replacement mineral on aluminosilicate (e.g. Guidotti & Cheney, 1976; Guidotti, 1984). The presence of the margarite-bearing fields here may reflect either a geologically unrealistic choice of CaO and Na2O contents for the synthetic pelite compositions used or infelicities in the a–x relations used. In application to rocks such problems may arise if, for example, sequestration of CaO in apatite is not accounted for in constraining the bulk composition used (e.g. Indares et al., 2008). However, several studies do report peak metamorphic margarite in greenschist to amphibolite facies metapelites (e.g. Winkler, 1979; Frey et al., 1982; Gal & Ghent, 1991) where it occurs in small amounts intergrown with other white mica (e.g. Gal & Ghent, 1991). Given the ubiquitous presence of margarite in the calculations compared with its likely natural occurence, there would appear to be further work required on better constraining the equilibria between the various Na–Ca-bearing phases.
The ds6-set of diagrams is based both on the internally consistent parameterization of mixing properties using the approach advocated in the companion paper (Powell et al., 2014), and on the derivation and adjustment of the properties of the fictive end-members (e.g. the Ti end-member of biotite). Given that a–x relations almost always involve many more parameters than can be estimated from direct measurement, it is not feasible to calibrate them robustly through formal optimization methods. The principles used here represent the practical approach – combining heuristic thermodynamic expectations of parameter values, based on known behaviour – while ultimately ensuring that the resulting phase diagrams are plausible. Significant improvement in these parameterizations is needed for more realistic rock calculations, and further development of theoretical models together with experimental measurement of properties will eventually start to replace the temporary, albeit useful, regularization involved.
A key aspect in further developing a–x relations is to use natural data constraints, including experiments on natural compositions. Because of the strong structure and relatively small number of variables regularization brings to the a–x relations, the best approach to using natural data would be to make adjustments to the values used for key variables (w and ϕ) and compare the recalculated results with the natural data rather than trying to calibrate directly from this data. To this end, monte carlo simulations probably provide a quick and easy way to adjust the a–x parameters and constrain values that reproduce natural compositions faithfully, and efforts to implement such an approach are already underway.
Acknowledgements
RP acknowledges support from Australian Research Council grants DP0451770, DP0557013 and DP0987731. We thank J. Diener, D. Pattison, M. Brown and the late N. Hudson for numerous fruitful discussions on metapelitic equilibria. M. Caddick, L. Tajčmanová and D. Waters are thanked for helpful reviews and M. Brown for his editorial handling and suggestions. C. Diel and R. Weil are thanked for assistance with the calculations.
Note
Appendix
The thermodynamic descriptions of the metapelitic minerals used in this paper are outlined here. The assumed stoichiometry of each is given in terms of a set of independent end-members, the site fraction and end-member proportions expressions, the interaction energies (W), and the dqf parameters of end-members. Interaction energies are those of SF (symmetric formalism; Powell & Holland, 1993), except where labelled as ASF (asymmetric formalism; Holland & Powell, 2003). In most cases, the DQFi of an end-member i is the ΔHi value added to the expression for Gi, with i being a non-dataset end-member that is ‘made’ by linearly combining n dataset end-members (see main text). For such end-members, the full expression for Gi is written out in the form  , where νk is the number of moles of end-member k combining to give 1 mole of i. In other cases, the dqf represents a modification to the G of a dataset end-member, and the value of the dqf alone is given.
For the Fe3+ end-members, the dqfs have been established so that the degree of Fe2+ to Fe3+ conversion for the phases increases in the order (cordierite) < garnet < chloritoid < orthopyroxene < chlorite ≈ staurolite < biotite.
References
Garnet
The garnet thermodynamic description, in terms of the garnet formula, X3Y2Z3O12, involves Mg, Fe2+ and Ca on the X site, Al and Fe3+ on Y, with Z being filled with Si. Showing only those sites where mixing occurs.
| X | Y | ||||
|---|---|---|---|---|---|
| Mg | Fe | Ca | Al | Fe3 | |
| py | 3 | 0 | 0 | 2 | 0 |
| alm | 0 | 3 | 0 | 2 | 0 |
| gr | 0 | 0 | 3 | 2 | 0 |
| kho | 3 | 0 | 0 | 0 | 2 |


The asf interaction energies adopted are
| W kJ | alm | gr | kho |
|---|---|---|---|
| py | 2.5 | 31 | 5.4 |
| alm | 5 | 22.6 | |
| gr | −15.3 |
and the asymmetry parameters are αpy = αalm =αkho = 1, αgr = 2.7. Earlier models used sf, but with White et al. (2007), the ASF was adopted, with αgr = 9. It was discovered quickly that such asymmetry did not work well for felsic granulite calculations (P. Stípská, pers. comm.) and a less-asymmetric value was adopted in Diener et al. (2008). The W values are based on the calorimetric-based ones in Fe2+–Mg–Ca that were refined in Green et al. (2012) for CMAS, although with some simplification made by removing the P-dependant terms as the Green et al. (2012) model was designed for a much greater pressure range, providing Wpygr, and αpy = 1 and αgr = 2.7. Extension into the Fe2+ system is by analogy with the model used in White et al. (2007), but with the smaller αgr value.
Chlorite
The chlorite thermodynamic description is based on the following end-members:
| M1 | M23 | M4 | T2 | ||||||||
|---|---|---|---|---|---|---|---|---|---|---|---|
| Mg | Fe | Al | Mg | Fe | Mg | Fe | Fe3 | Al | Si | Al | |
| afchl | 1 | 0 | 0 | 4 | 0 | 1 | 0 | 0 | 0 | 2 | 0 |
| ames | 0 | 0 | 1 | 4 | 0 | 0 | 0 | 0 | 1 | 0 | 2 |
| clin | 1 | 0 | 0 | 4 | 0 | 0 | 0 | 0 | 1 | 1 | 1 |
| daph | 0 | 1 | 0 | 0 | 4 | 0 | 0 | 0 | 1 | 1 | 1 |
| f3clin | 1 | 0 | 0 | 4 | 0 | 0 | 0 | 1 | 0 | 1 | 1 |
| ochl1 | 1 | 0 | 0 | 0 | 4 | 0 | 1 | 0 | 0 | 2 | 0 |
| ochl4 | 0 | 1 | 0 | 4 | 0 | 1 | 0 | 0 | 0 | 2 | 0 |

where QAl, Q1 and Q4 are in the range −1 to 1.

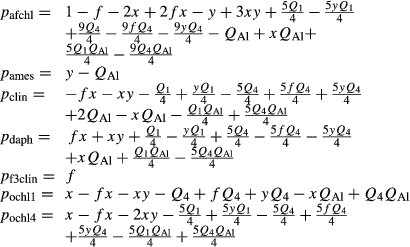
The interaction energies adopted are
| W | ames | clin | daph | f3clin | ochl1 | ochl4 |
|---|---|---|---|---|---|---|
| afchl | 16 | 17 | 37 | 15 | 20 | 4 |
| ames | 17 | 30 | 19 | 29 | 13 | |
| clin | 20 | 2 | 30 | 21 | ||
| daph | 22 | 18 | 33 | |||
| f3clin | 28.6 | 19 | ||||
| ochl1 | 24 |
The Fe2+-Mg order–disorder between M1, M23 and M4 is handled via the ochl1 and ochl4 end-members, with Gochl1 = Gafchl + Gdaph − Gclin + 3 kJ and  . The Fe3+ end-member, Gf3clin, is made with
  See Powell et al. (2014) for an account of this overall parameterization.
Biotite
The biotite thermodynamic description is based on
| M3 | M12 | T | V | ||||||||
|---|---|---|---|---|---|---|---|---|---|---|---|
| Mg | Fe | Fe3 | Ti | Al | Mg | Fe | Si | Al | OH | O | |
| phl | 1 | 0 | 0 | 0 | 0 | 2 | 0 | 1 | 1 | 2 | 0 |
| ann | 0 | 1 | 0 | 0 | 0 | 0 | 2 | 1 | 1 | 2 | 0 |
| obi | 0 | 1 | 0 | 0 | 0 | 2 | 0 | 1 | 1 | 2 | 0 |
| east | 0 | 0 | 0 | 0 | 1 | 2 | 0 | 0 | 2 | 2 | 0 |
| tbi | 0 | 0 | 0 | 1 | 0 | 2 | 0 | 1 | 1 | 0 | 2 |
| fbi | 0 | 0 | 1 | 0 | 0 | 2 | 0 | 0 | 2 | 2 | 0 |


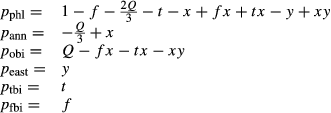
The interaction energies adopted are
| W kJ | ann | obi | east | tbi | fbi |
|---|---|---|---|---|---|
| phl | 12 | 4 | 10 | 30 | 8 |
| ann | 8 | 15 | 32 | 13.6 | |
| obi | 7 | 24 | 5.6 | ||
| east | 40 | 1 | |||
| tbi | 40 |
The KFMASHO subsystem of this is as well established in biotite as it is in, for example, chlorite, with the constraint that Wphl,east = 10 kJ from the calorimetry of Circone & Navrotsky (1992), and as used in Holland & Powell (2006). But handling the Ti composition dimension is difficult as it involves microscopic w pairs that are effectively specific to biotite, meaning that analogies with other minerals cannot be brought to bear. Circumstantial evidence in the form of the behaviour of phase equilibria calculations in KFMASHTO suggests that the W involving tbi are not small (pace Tajc˘manová et al., 2009, who took tbi interactions to be zero). The ϕ approach gives Wann,tbi ≈ Wphl,tbi, if wMgTi is taken to be 2wMgAl, and then also Wobi,tbi = Wphl,tbi− 8 kJ. Separately, Weast,tbi = Wtbi,fbi. To proceed, we can take Wphl,tbi = 30 kJ and Weast,tbi = 40 kJ, on the suspicion that the second should be rather larger than the first. This arises from KFMASHTO calculations on rutile-bearing aluminous pelites that involve biotites with a wide range range of Ti content. There is obviously room for refinement in these numbers.
For the ordered end-member, obi,  (Holland & Powell, 2006). For the Fe3+ end-member, fbi,
  , and for the Ti end-member, tbi, Gtbi = Gphl + Gru − Gbr + 55 kJ. In addition, the enthalpy of annite had to be modified by DQFann = −3 kJ to make the phase equilibria behave sensibly, in particular because otherwise a number of well-constrained biotite-breakdown melting reactions occurred to unreasonably low T for FeO-rich biotite compositions. The necessity for this modification suggests a shortcoming in the a–x relations for biotite, but attempts to adjust the a–x relations to remove the necessity for this modification have so far been unsuccessful. Because of this dqf on annite, the DQF on obi in thermocalc coding becomes −3 kJ because it incorporates the contribution from the dqf of annite (from
  ).
).
Staurolite
Of all of the common minerals in metapelites, staurolite requires the most imagination in generating a–x relations because the dependence of its crystal chemistry and internal organization on P, T and composition are not well known. Nevertheless, from analyses of staurolite in rocks it is known that it incorporates Fe3+ and Ti, and for it to behave well with the other other minerals, these elements have to be incorporated into its thermodynamics. The admittedly crude staurolite thermodynamic description here is based on
| X | Y | |||||
|---|---|---|---|---|---|---|
| Mg | Fe | Al | Fe3 | Ti | □ | |
| mst | 4 | 0 | 2 | 0 | 0 | 0 |
| fst | 0 | 4 | 2 | 0 | 0 | 0 |
| msto | 4 | 0 | 0 | 2 | 0 | 0 |
| mstt | 4 | 0 | 0 | 0 |

|

|


The interaction energies adopted are
| W kJ | fst | msto | mstt |
|---|---|---|---|
| mst | 16 | 2 | 20 |
| fst | 18 | 36 | |
| msto | 30 |
For the Fe3+ end-member, msto, Gmsto = Gmst + Gandr − Ggr + 9 kJ. For the Ti end-member, mstt,  . Because it is suspected that mst does not have the same structure as fst, and staurolite as it commonly occurs, the enthalpy of mst was modified by DQFmst = −8 kJ to more closely approach Mg–Fe2+ exchange with garnet in rock data.
Chloritoid
The chloritoid thermodynamic description here is based on
| M1A | M1B | |||
|---|---|---|---|---|
| Al | Fe3 | Fe | Mg | |
| mctd |

|
0 | 0 | 1 |
| fctd |

|
0 | 1 | 0 |
| ctdo | 0 |

|
0 | 1 |


The interaction energies adopted are
| W | fctd | ctdo |
|---|---|---|
| mctd | 4 | 1 |
| fctd | 5 |
For the Fe3+ end-member, ctdo, 
Cordierite
In the ds55-set, this was the only remaining ideal-mixing phase, dating back originally to the end of the 1980s. Here, the cordierite thermodynamic description is simply.
| X | H | |||
|---|---|---|---|---|
| Fe | Mg | H2O | □ | |
| crd | 0 | 2 | 0 | 1 |
| fcrd | 2 | 0 | 0 | 1 |
| hcrd | 0 | 2 | 1 | 0 |


The interaction energies adopted are:
| W | fcrd | hcrd |
|---|---|---|
| crd | 8 | 0 |
| fcrd | 9 |
Wcrd,hcrd is used in the generation of the Holland & Powell (2011) dataset, so this value is considered to be fixed.
Orthopyroxene
The orthopyroxene thermodynamic description is based on
| M1 | M2 | T | |||||||
|---|---|---|---|---|---|---|---|---|---|
| Mg | Fe | Fe3 | Al | Mg | Fe | Ca | Al | Si | |
| en | 1 | 0 | 0 | 0 | 1 | 0 | 0 | 0 | 2 |
| fs | 0 | 1 | 0 | 0 | 0 | 1 | 0 | 0 | 2 |
| fm | 1 | 0 | 0 | 0 | 0 | 1 | 0 | 0 | 2 |
| mgts | 0 | 0 | 0 | 1 | 1 | 0 | 0 | 1 | 1 |
| fopx | 0 | 0 | 1 | 0 | 1 | 0 | 0 | 1 | 1 |
| odi | 1 | 0 | 0 | 0 | 0 | 0 | 1 | 0 | 2 |


The ASF interaction energies adopted are
| W kJ | fs | fm | mgts | fopx | odi |
|---|---|---|---|---|---|
| en | 7 | 4 | 13 − 0.15P | 11 − 0.15P | 32.2 + 0.12P |
| fs | 4 | 13 − 0.15P | 11.6 − 0.15P | 25.54 + 0.084P | |
| fm | 17 − 0.15P | 15 − 0.15P | 22.54 + 0.084P | ||
| mgts | 1 | 75.4 − 0.94P | |||
| fopx | 73.4 − 0.94P |
with P in kbar, and αodi = 1.2, with all other α values unity. These values are based on the CMAS values from Green et al. (2012), combined with the values in FMS coming from the site distribution fitting as in Holland & Powell (1996), but with wFeMg = 4 kJ. Then, the ϕ approach was used to find the remaining values.
Green et al. (2012) also provide the way to make the Ca end-member, orthodiopside (odi), for which Godi = Gdi − 0.1 + 0.000211T + 0.005PkJ (T in K, P in kbar). From Holland & Powell (1996), the ordered end-member, fm, has  from fitting the site distribution data. The G of the Fe3+ end-member, fopx, Gfopx, is made with
  .
.
Muscovite, paragonite and margarite
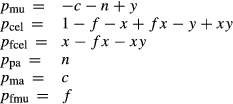
The muscovite–paragonite and margarite thermodynamic descriptions are based on:
| A | M2A | T1 | |||||||
|---|---|---|---|---|---|---|---|---|---|
| K | Na | Ca | Al | Mg | Fe | Fe3 | Al | Si | |
| mu | 1 | 0 | 0 | 1 | 0 | 0 | 0 | 1 | 1 |
| cel | 1 | 0 | 0 | 0 | 1 | 0 | 0 | 0 | 2 |
| fcel | 1 | 0 | 0 | 0 | 0 | 1 | 0 | 0 | 2 |
| pa | 0 | 1 | 0 | 1 | 0 | 0 | 0 | 1 | 1 |
| ma | 0 | 0 | 1 | 1 | 0 | 0 | 0 | 2 | 0 |
| fmu | 1 | 0 | 0 | 0 | 0 | 0 | 1 | 1 | 1 |


The ASF interaction energies adopted for muscovite–paragonite are
| W | cel | fcel | pa | ma | fmu |
|---|---|---|---|---|---|
| mu | w 1 | w 1 | w 2 | 35 | 0 |
| cel | 0 | w 3 | 50 | 0 | |
| fcel | w 3 | 50 | 0 | ||
| pa | 15 | 30 | |||
| ma | 35 |
in which w1 = 0.2P is taken to be fixed because it is incorporated into the Holland & Powell (2011) dataset generation; w2 = 10.12 + 0.0034T + 0.353P kJ fitting the muscovite-paragonite solvus (Coggon & Holland, 2002); and w3 = 45 + 0.25PkJ effecting little celadonite substitution into paragonite as in Smye et al. (2010). In addition, αpa = 0.37, and the other α are 0.63, as given in Smye et al. (2010). The W pre-date the ϕ approach and are identical to those in Smye et al. (2010), except for Wcel,ma = Wfcel,ma, which have been increased to give better results over a wide range of compositions. The modification to the enthalpy of the margarite, end-member for incorporation in muscovite–paragonite is DQFma = 6.5 kJ; the Fe3+ end-member fmu is made with  .
.
The Smye et al. (2010) parameterization did not behave appropriately when margarite coexisted with muscovite and/or paragonite, with the y(ma) values being too low compared to natural occurrences. The W and α and fmu enthalpy adjustment used in margarite are identical to those in muscovite–paragonite apart from Wmu,ma = 34 and Wpa,ma = 18. In margarite the enthalpy modifications are DQFmu = 1 kJ, DQFcel = DQFfcel = 5 kJ, and DQFpa = 4 kJ.
Melt
The a–x relations for melt have the same end-members and variables as those in White et al. (2001, 2007). However, in refitting the melting relationships in Holland & Powell (2011) to the Holland & Powell (2011) dataset, several W and G modifications have changed. The interaction energies are now:
| W kJ | abL | kspL | anL | silL | foL | faL | h2oL |
|---|---|---|---|---|---|---|---|
| qL | 12 − 0.4P | −2 − 0.5P | 5 | 12 | 12 − 0.4P | 14 | 17 − 0.5P |
| abL | −6 + 3.0P | 0 | 12 | 10 | 2 | −1.5 − 0.3P | |
| kspL | − 1.0P | 12 | 12 | 12 | 9.5 − 0.3P | ||
| anL | 0 | 0 | 0 | 7.5 − 0.5P | |||
| silL | 12 | 12 | 11 | ||||
| foL | 18 | 11 − 0.5P | |||||
| faL | 12 |
The G modifications are DQFsilL = −23 kJ, DQFfoL = −10 kJ, and DQFfaL =−9 − 1.3PkJ.
Others
Of the remaining phases, a–x relations for feldspar are retained from Holland & Powell (2003), order–disorder magnetite from White et al. (2000), and spinel–magnetite from White et al. (2002). Ilmenite has the a–x relations from White et al. (2000), but with solid solution towards geikielite now allowed with Mg allowed onto the A site, with Woilm,geik = Woilm,geik = 4 kJ and Whem,geik = 36 kJ. The sapphirine a–x relations are from Wheller & Powell (2014) and epidote from Holland & Powell (2011).


