Non-specific phospholipase C4 hydrolyzes phosphosphingolipids and phosphoglycerolipids and promotes rapeseed growth and yield
Edited by: Keke Yi, Institute of Agricultural Resources and Regional Planning, CAAS, China
ABSTRACT
Phosphorus is a major nutrient vital for plant growth and development, with a substantial amount of cellular phosphorus being used for the biosynthesis of membrane phospholipids. Here, we report that NON-SPECIFIC PHOSPHOLIPASE C4 (NPC4) in rapeseed (Brassica napus) releases phosphate from phospholipids to promote growth and seed yield, as plants with altered NPC4 levels showed significant changes in seed production under different phosphate conditions. Clustered regularly interspaced short palindromic repeat (CRISPR)/CRISPR-associated nuclease 9 (Cas9)-mediated knockout of BnaNPC4 led to elevated accumulation of phospholipids and decreased growth, whereas overexpression (OE) of BnaNPC4 resulted in lower phospholipid contents and increased plant growth and seed production. We demonstrate that BnaNPC4 hydrolyzes phosphosphingolipids and phosphoglycerolipids in vitro, and plants with altered BnaNPC4 function displayed changes in their sphingolipid and glycerolipid contents in roots, with a greater change in glycerolipids than sphingolipids in leaves, particularly under phosphate deficiency conditions. In addition, BnaNPC4-OE plants led to the upregulation of genes involved in lipid metabolism, phosphate release, and phosphate transport and an increase in free inorganic phosphate in leaves. These results indicate that BnaNPC4 hydrolyzes phosphosphingolipids and phosphoglycerolipids in rapeseed to enhance phosphate release from membrane phospholipids and promote growth and seed production.
INTRODUCTION
Phosphorus (P) is a macronutrient necessary for plant growth and high crop yield. However, about 70% of farmland lacks sufficient inorganic phosphate (Pi), the bioavailable form of phosphorus, to support plant growth and production (Cong et al., 2020; Dissanayaka et al., 2021). To achieve high crop yields, P fertilizers are widely used, but this practice increases costs and leads to environmental problems, such as eutrophication, as well as accelerating depletion of the finite worldwide P supply (Richardson and Simpson, 2011; Lambers et al., 2015; Hallama et al., 2018; Kekulandara et al., 2018; Cong et al., 2020; Zhang et al., 2020a). One major reason for the excessive application of P fertilizers is that Pi precipitates in soils rich in cations, which, together with the competition between plants and the microorganisms in their rhizosphere, reduces the effectiveness of crop fertilization (Raghothama, 2000; Richardson and Simpson, 2011; Shen et al., 2011). Therefore, better understanding of the cellular framework involved in P recycling and uptake by the roots of crop plants will help improve P usage and decrease fertilizer application (Cong et al., 2020; Dissanayaka et al., 2021).
Under Pi-limited conditions, plants undergo a series of physiological and metabolic changes, called the Pi starvation response (PSR) (Abbas et al., 2018; Dissanayaka et al., 2021; Shi et al., 2021). The plant PSR consists of enhancing P-acquisition efficiency (PAE) from soil and P-use efficiency (PUE) by altering the composition of P-containing compounds. The former includes changes in root morphology/architecture, expression of high-affinity Pi transporter genes, exudation of phosphatases and organic acids, and root symbiosis with microorganisms (Morcuende et al., 2007; Peret et al., 2011; Plaxton and Tran, 2011; Gamuyao et al., 2012; Zhang et al., 2014). The latter mainly consists of Pi release from P-containing metabolites by endogenous nucleases and purple acid phosphatases (PAP), alternative metabolic pathways, and replacement of membrane phospholipids with non-Pi-containing lipids (Chien et al., 2018; Hallama et al., 2018; Pang et al., 2018; Wang et al., 2018; Pan et al., 2019). In addition, improved PUE can be achieved by altering P distribution in leaves to better allocate P in different types of leaf cells (Stitt et al., 2010). PUE is positively correlated with the ratio of metabolic Pi to phospholipids. A higher PUE is associated with more P being used for P-containing metabolites to maintain photosynthesis, while less P is used for phospholipids (Lambers et al., 2012; Hidaka and Kitayama, 2013). However, excessive decreases in phospholipid production, as observed in many laboratory P starvation studies, is one of the main reasons behind poor plant growth (Li et al., 2006; Gaude et al., 2008). The optimal distribution between phospholipids and other P-containing metabolites is still unclear and remains a key question in efforts to improve PUE in crop plants (Cong et al., 2020; Dissanayaka et al., 2021).
Membrane phospholipids constitute approximately one-third of all organic P in plants, serving as an important cellular Pi reservoir (Nakamura, 2013; Yeats et al., 2018; Dissanayaka et al., 2021; Liu et al., 2021b). Membrane lipid remodeling is one of the predominant metabolic responses during Pi relocation in plants experiencing Pi deficiency (Misson et al., 2005; Nakamura et al., 2005; Nakamura, 2013; Nakamura and Ngo, 2020; Yang et al., 2021a; Ali et al., 2022). In response to P limitation, the levels of phospholipids, such as phosphatidylcholine (PC), phosphatidylethanolamine (PE), and glycosylinositolphosphorylceramide (GIPC), decrease, whereas those of non-P-containing glycolipids, such as digalactosydiacylglycerol (DGDG) and glucosylceramide (GlcCer), increase. Specific phospholipase D (PLD) and non-specific phospholipase C (NPC) play important roles in the hydrolysis of phospholipids (Wang, 2001; Li et al., 2006; Hemsley, 2015; Reszczynska and Hanaka, 2020). PLDζ2 activity is highly induced to produce phosphatidic acid (PA) that can be further hydrolyzed to release Pi (Nakamura et al., 2005; Cruz-Ramirez et al., 2006; Li et al., 2006). Two NPCs, NPC4 and NPC5, are involved in membrane lipid remodeling in Arabidopsis thaliana response to Pi deficiency (Pokotylo et al., 2013; Nakamura and Ngo, 2020). NPC5 mediates glycerolipid remodeling in leaves, whereas NPC4 mainly mediates phosphosphingolipid remodeling, primarily in roots (Nakamura et al., 2005; Yang et al., 2021a, 2021b). NPC5 is soluble, whereas NPC4 is associated with the plasma membrane (Yang et al., 2021a, 2021b). NPC4, but not NPC5, is S-acylated at its C terminus, a prerequisite for its membrane association (Yang et al., 2021a, 2021b). Although the role of NPCs in response to P deficiency has been studied in the model plant Arabidopsis, whether and how they affect crop plant responses to Pi availability remains unknown. Here, we analyzed the NPC family in rapeseed and discovered that NPC4 of rapeseed plays a dual role in hydrolyzing phosphosphingolipids and phosphoglycerolipids and promotes growth and seed production.
RESULTS
The NPC family in plants and NPC expression in rapeseed
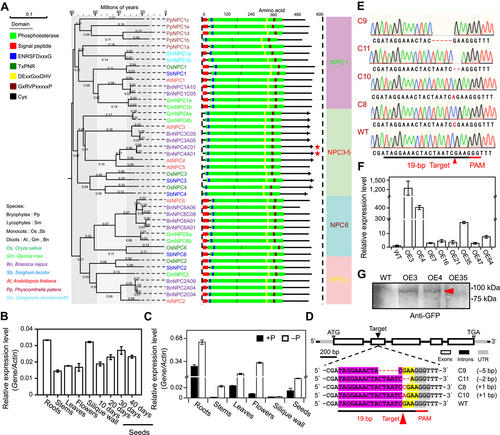
To analyze the diversity and conservation of the NPC family in plants, we used Arabidopsis NPC sequences as queries to search the genomes of seven plant species encompassing bryophytes, lycophytes, monocots, and dicots. This analysis identified 43 NPC sequences, all of which contain a phosphatase domain (Pfam entry PF04185) with the four conserved motifs ENRSFDxxxG, TxPNR, DExxGxxDHV, and GxRVPxxxxxP. The NPC proteins from various plant species cluster into four clades, corresponding to NPC1, NPC2, NPC3–5, and NPC6 according to the nomenclature of the Arabidopsis NPC family (Figure 1A). Plant NPCs can be divided into two subtypes based on the presence of an N-terminal signal peptide (SP-NPC): NPC1, NPC2, and NPC6 contain an SP-NPC, whereas NPC3–NPC5 for the plant species analyzed lack the signal peptide but contain a conserved cysteine (Cys) in their C termini. The only exception is NPC5 from Arabidopsis, which lacks this Cys residue. We showed recently that this Cys in NPC4 was acylated and that this acylation was required for the membrane association of NPC4 and its hydrolysis of GIPC (Yang et al., 2021b). Bryophytes and lycophytes contain only SP-NPCs, whereas angiosperms (monocots and dicots) have the two NPCs, indicating that SP-NPCs are more ancient than the non-SP-NPCs.
Phylogenetic expression, genome editing and overexpression of BnaNPC4
(A) Phylogenetic tree of NON-SPECIFIC PHOSPHOLIPASE C (NPC) proteins in plants. The multiple sequence alignment of NPCs was generated by European Bioinformatics Institute (EBI) ClustalW (https://www.ebi.ac.uk/Tools/msa/clustalo/), and the phylogenetic tree was reconstructed using the neighbor-joining method in MEGA 7. The numbers at each branch represent the percentage support based on 1,000 replicates. The phylogenetic tree was modified in EVOLVIEW (https://www.evolgenius.info/evolview/#login). Conserved domains of NPCs were analyzed by EBI Search InterPro (http://www.ebi.ac.uk/interpro/search/sequence/). The presence of a putative N-terminal signal peptide, phosphoesterase domain (Pfam entry PF04185), conserved regions, putative active site residues, and conserved active site-stabilizing ion pairs in each NPC are indicated. Green, phosphoesterase; red, signal peptide; blue, ENRSFDxxxG motif; dark green, TxPNR motif; yellow, DExxGxxDHV motif; burgundy, GxRVPxxxxxP motif; vertical black line, cysteine residue in the C terminus. Species abbreviations: At, Arabidopsis thaliana (dicot); Bn, Brassica napus (dicot); Gm, Glycine max (dicot); Os, Oryza sativa (monocot); Pp, Physcomitrium patens (bryophyte); Sb, Sorghum bicolor (monocot); Sm, Selaginella moellendorffii (lycophyte). (B) Relative BnaNPC4 transcript levels in different tissues of B. napus. Actin was used as an internal standard and values are means ± SD (n = 3 biological repeats). (C) Relative BnaNPC4 transcript levels under Pi-sufficient or Pi-deficient conditions. Total RNA was extracted from different tissues from flowering plants transferred to hydroponic medium with or without Pi for 7 d. Values are means ± SD (n = 3 biological repeats). (D) Diagram depicting the position of the clustered regularly interspaced short palindromic repeat (CRISPR) target site in the second exons of BnaNPC4 genes. The position of the CRISPR-associated nuclease 9 (Cas9) target insert is indicated by triangles. Insertions are indicated by red letters and deletions by red dashed lines. The protospacer adjacent motif sites are highlighted in gray. (E) Sequencing verification of mutations in genome-edited BnaNPC4 mutants. (F) Expression level of BnaNPC4 in overexpression lines by reverse transcription – quantitative polymerase chain reaction (RT-qPCR). Expression levels in non-transgenic control plants (wild type, WT) were set to 1. Values are means ± SD (n = 3 biological repeats). (G) Immunoblotting of BnaNPC4-GFP (green fluorescent protein) in transgenic and WT plants. Proteins were extracted from leaves, separated by sodium dodecyl sulfate – polyacrylamide gel electrophoresis, and immunoblotted with anti-GFP antibodies conjugated to horseradish peroxidase.
The rapeseed genome contains 13 BnaNPC genes comprising two NPC1, three NPC2, two NPC3, two NPC4, and four NPC6 genes distributed on the A and C subgenomes (Figure 1A). Based on expression data from the Brassica napus multi-omics information resource (BnIR, http://yanglab.hzau.edu.cn/) (Liu et al., 2021a), BnaNPC1 and BnaNPC6 genes were highly expressed in various tissues, whereas BnaNPC2 genes were highly expressed in stems and developing seeds. BnaNPC3 genes showed high expression in roots, stems, flowers, silique walls, and early developing seeds, and BnaNPC4 genes were mainly expressed in roots and seeds at late stages of development under normal growth conditions (Figure S1A). We used reverse transcription quantitative polymerase chain reaction (RT-qPCR) to verify the bulk expression pattern of BnaNPC4 genes (Figure 1B), as BnaNPC4 genes from the A and C subgenomes cannot be distinguished by this technique due to high sequence similarity (Figure S2). To determine the expression of BnaNPCs under Pi deficiency, we analyzed the transcriptome data of leaves at the three-leaf and five-leaf stages from seedlings that had experienced 7 d of Pi deficiency (Chao et al., 2020), revealing that among of the NPC family, only BnaNPC4 genes display increased expression under Pi deficiency conditions (Figure S1B). RT-qPCR also verified that BnaNPC4 genes are highly induced in various tissues after 7 d of Pi deficiency (Figure 1C).
Genome editing and overexpression of NPC4 in rapeseed
To investigate the effect of BnaNPC4 on rapeseed growth in response to Pi deficiency, we used clustered regularly interspaced short palindromic repeat (CRISPR)/CRISPR-associated nuclease 9 (Cas9)-mediated genome editing to knock out BnaNPC4s in the A and C subgenomes. To this end, we designed a single guide RNA (sgRNA) targeting the second exon to edit both BnaC01.NPC4 and BnaA01.NPC4 because it is in a region identical in the two genes (Figure S2). We identified 20 plants that were positive for CRISPR/Cas9 editing based on detection of the T-DNA insertion carrying Cas9 in the T0 transgenic generation. Sequencing of the target site confirmed the editing of these 12 plants. We obtained four homozygous mutant lines through self-pollination over several generations. Two of the resulting CRISPR/Cas9-edited lines, designated C8 and C10, each harbored a 1-bp insertion; line C9 had a 5-bp deletion, and line C11 carried a 2-bp deletion (Figure 1D, E). All mutations resulted in the introduction of frameshifts into the open reading frame and a premature termination of BnaNPC4 translation, suggesting that these mutants are loss-of-function alleles. We refer to these lines as knockout (KO) mutants hereafter.
In parallel, we overexpressed BnaC01.NPC4 by introducing the 35 S:BnaNPC4-GFP (an expression cassette consisting of BnaNPC4 cloned in-frame and upstream of the green fluorescent protein (GFP) sequence and driven by the cauliflower mosaic virus (35 S) promoter) construct into rapeseed using the complementary DNA (cDNA) of BnaC01.NPC4. We identified positive transgenic T0 plants by PCR, yielding eight homozygous lines with a high level of BnaNPC4 transcript levels after self-pollination for several generations (Figure 1F). The relative BnaNPC4 transcript levels in overexpression (OE) lines OE3 and OE4 were approximately 1,200- and 400-fold higher under normal P conditions, respectively, than those of non-transgenic controls, with the other lines showing BnaNPC4 fold increases over controls ranging from several to dozens of times higher (Figure 1F). We also detected the BnaNPC4-OE-GFP protein in OE3 and OE4 lines by immunoblotting with an anti-GFP antibody (Figure 1G).
BnaNPC4 promotes growth and seed production in rapeseed
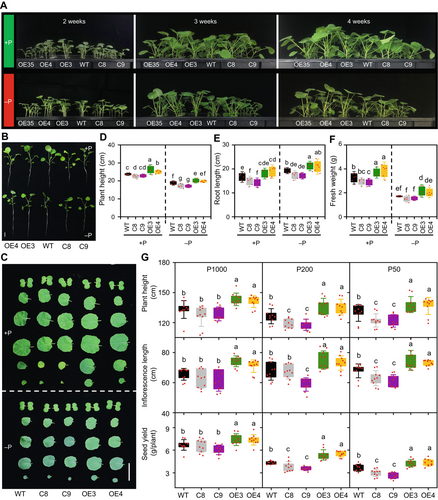
To determine the effect of BnaNPC4 on rapeseed growth, we characterized the phenotype of homozygous transgenic lines for BnaNPC4 (OE and KO) relative to that of non-transgenic control plants (referred to hereafter as wild type (WT)). The hypocotyl length of 7-d-old seedlings for BnaNPC4-OE lines was significantly longer than that of WT, whereas we observed the opposite for the KO mutants, C8 and C9 (Figure S3). In all genotypes, plant growth was slower in the absence of any supplied Pi than under Pi-sufficient conditions. However, compared to WT, the two BnaNPC4-OE lines displayed significant increases in growth, while that of the BnaNPC4-KO lines was impeded, under both conditions (Figure 2A–C). Under Pi-sufficient conditions, the average plant height, root length, and fresh weight increased by 8.1%, 11.2%, and 15.6% in BnaNPC4-OE lines, but decreased by 4.2%, 12.5%, and 10.8% in BnaNPC4-KO lines, compared to WT (Figure 2D–F). Under Pi-deficient conditions, the average plant height, root length, and fresh weight increased by 6.1%, 9.5%, and 22.6% in BnaNPC4-OE lines, but decreased by 8.8%, 10.8%, and 11.3% in BnaNPC4-KO lines, relative to WT (Figure 2D–F). These results indicate that BnaNPC4 promotes seedling growth under both Pi-sufficient and Pi-deficient conditions.
Effect of altering Brassica napus NON-SPECIFIC PHOSPHOLIPASE C4 (BnaNPC4) function on plant growth and seed production under different Pi levels
(A) Phenotype of BnaNPC4 overexpression (OE) and knockout (KO) lines following growth in Pi-sufficient or Pi-deficient hydroponic nutrient solution. Seven-d-old seedlings were transferred to Pi-sufficient or Pi-deficient hydroponic nutrient solution for 4 weeks before photographs were taken. (B) Representative photographs of BnaNPC4 OE and KO lines grown in Pi-sufficient or Pi-deficient hydroponic nutrient solution for 3 weeks. Scale bar, 5 cm. (C) Representative photos of leaves from plants under Pi-sufficient or -deficient hydroponic media after 3 weeks. Bars = 5 cm. (D–F) Plant height (D), root length (E), and fresh weight (F) of BnaNPC4 OE and KO lines under Pi-sufficient and Pi-deficient hydroponic conditions for 3 weeks. Values are means ± SD (n = 6). (G) Growth traits and seed yield of BnaNPC4 OE and KO lines under different Pi levels supplied in the soil. Data collected from rapeseed plants grown in the greenhouse with 50 (P50), 100 (P100), or 1,000 (P1000) µmol/L Pi. Values are means ± SD (n = 10), and different letters indicate significantly differences at P < 0.05 by one-way analysis of variance.
We grew WT, BnaNPC4-KO, and BnaNPC4-OE plants to maturity in soil with different levels of supplied Pi (50, 200, or 1,000 µmol/L) to monitor their agronomic traits. Under sufficient Pi supply (1,000 µmol/L), BnaNPC4-OE lines produced 10.4% more seeds than WT, whereas KO lines had a roughly equal number of seeds to WT. However, under limited Pi supply (50 and 200 µmol/L Pi), BnaNPC4-KO plants had a lower seed yield than WT. Indeed, when grown with 50 µmol/L or 200 µmol/L Pi, the seed yield of the KO lines was 15.1% and 23.1% lower on average, respectively, than that of WT, whereas the seed yield of BnaNPC4-OE lines was on average 25.3% and 17.7% higher, respectively, than that of WT (Figure 2G). BnaNPC4-OE plants were taller, with longer inflorescences, whereas KO plants were shorter and had shorter inflorescence than WT (Figure 2G). BnaNPC4-OE plants tended to have more effective branches (seed-bearing branches) and more siliques, whereas KO plants showed the opposite trend (Figure S4). Seed weight was similar among WT, KO, and OE plants (Figure S4). These results indicate that increased NPC4 expression promotes overall plant growth and seed production under Pi-sufficient and Pi-deficient conditions, and the effect of BnaNPC4-KO and BnaNPC4-OE on rapeseed growth and seed production is greater under Pi-deficient than Pi-sufficient conditions.
BnaNPC4 alters sphingolipid metabolism in rapeseed
To determine how BnaNPC4 affects plant growth, we analyzed the sphingolipid levels of BnaNPC4-KO and BnaNPC4-OE lines in rapeseed, as NPC4 in Arabidopsis hydrolyzes GIPC to produce hydroxyceramide (hCer) (Yang et al., 2021a, 2021b). Accordingly, we transferred 7-d-old seedlings that had germinated in distilled water to Pi-sufficient and Pi-deficient hydroponic conditions for 2 weeks (Figure 2A). Compared to those in WT roots, the GIPC levels in BnaNPC4-OE roots were 21.2% lower under sufficient Pi supply, but 36.3% lower in the Pi-deficient condition (Figure 3A, B). By contrast, BnaNPC4-KO roots accumulated 23.1% more GIPC under Pi sufficiency, and 54.2% more GIPC under Pi deficiency, than WT roots (Figure 3A, B). Conversely, the levels of the non-phosphosphingolipids hCer and GlcCer were higher in BnaNPC4-OE roots, but lower in BnaNPC4-KO roots, compared to WT roots (Figure 3C, D, E). In addition, we determined that the levels of multiple GIPC and hCer species were altered in BnaNPC4-OE and BnaNPC4-KO roots (Figure 3B, D; Table S1). The opposite patterns seen for GIPC and hCer levels in BnaNPC4-OE and BnaNPC4-KO lines suggest that BnaNPC4 hydrolyzes phosphosphingolipids in roots.

Changes of sphingolipid levels in roots in response to Pi starvation
(A, C, E) Relative levels of GIPC (A), hCer (C), and GlcCer (E) in the roots of BnaNPC4 overexpression (OE) and knockout (KO) lines grown under Pi-sufficient or Pi-deficient conditions. (B, D) Heatmap representation of the levels of GIPC (B) and hCer (D) species in roots from seedlings grown under Pi-sufficient or Pi-deficient conditions. Values are means ± SD (n = 3) of lipid percentages for each species, normalized by log2. * is significant at P < 0.05, ** is significant at P < 0.01, compared to wild type (WT) under the same condition, based on Student's t-test. GlcCer, glucosylceramides; GIPC, glycosylinositolphosphoceramides; hCer, hydroxyceramide.
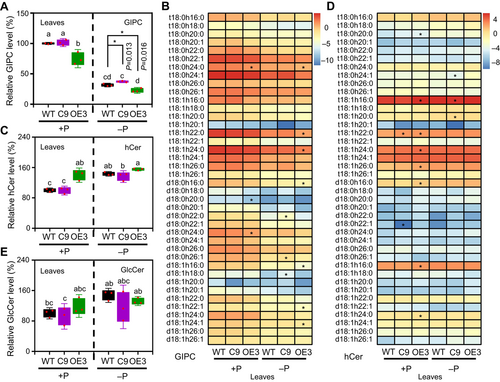
In leaves, BnaNPC4-OE plants displayed a 25% decrease in GIPC levels relative to WT (Figure 4A, B) and a 39.7% increase in hCer (Figure 4C, D). By contrast, BnaNPC4-KO mutant leaves had levels of GIPC and hCer similar to those of WT leaves (Figure 4A–D; Table S1). However, under Pi deficiency, BnaNPC4-OE and BnaNPC4-KO leaves showed an opposite change in GIPC levels, with total GIPC levels being 27.5% lower in the OE lines, but 17.9% higher in the KO lines, compared to WT leaves (Figure 4A, B). The hCer and GlcCer levels in leaves were comparable among the leaves of WT, BnaNPC4-OE, and BnaNPC4-KO plants (Figure 4C, D, E). The lack of effect on leaf sphingolipids under sufficient Pi in BnaNPC4-KO is consistent with the lower BnaNPC4 expression seen in leaves under sufficient Pi supply (Figures 1B, S1A). During Pi deficiency, NPC4 expression is induced in leaves, resulting in a greater effect in the NPC4-KO on leaf GIPC levels under Pi-deficient compared to Pi-sufficient conditions. These results support the notion that NPC4 hydrolyzes GIPC in leaves under Pi deficiency conditions.
Changes of sphingolipid levels in leaves in response to Pi starvation
(A, C, E) Relative levels of GIPC (A), hCer (C), and GlcCer (E) in the leaves of BnaNPC4 overexpression (OE) and knockout (KO) lines grown under Pi-sufficient or Pi-deficient conditions. (B, D) Heatmap representation of the levels of GIPC (B) and hCer (D) species in leaves from seedlings grown under Pi-sufficient or Pi-deficient conditions. Values are means ± SD (n = 3) of lipid percentages for each species, normalized by log2. * is significant at P < 0.05, ** is significant at P < 0.01, compared to wild type (WT) under the same condition, based on Student's t-test. GlcCer, glucosylceramides; GIPC, glycosylinositolphosphoceramides; hCer, hydroxyceramide.
BnaNPC4 changes phosphoglycerolipid composition
We also analyzed the effect of membrane glycerolipid composition in BnaNPC4-OE and BnaNPC4-KO plants. Under sufficient Pi supply, the roots of BnaNPC4-OE plants accumulated lower levels of PC (10.6%), PE (6.0%), and phosphatidylserine (PS) (15.5%) (Figure 5A–C), with most phosphoglycerolipid species showing significantly lower levels (Figure 5D–H; Table S1). Under Pi deficiency conditions, the roots of BnaNPC4-OE plants exhibited a further decrease in their phosphoglycerolipid levels and an increase in diacylglycerol (DAG) levels relative to WT roots. The levels of PC, PE, and PS in OE3 roots were 13.7%, 10.0%, and 30.8% lower than that of WT roots, respectively (Figure 5A–C), with most phosphoglycerolipid species displaying significantly lower abundances in roots (Figure 5D, E, H; Table S1). Conversely, the DAG level in BnaNPC4-OE roots was 27.7% higher than that of WT roots (Figure S5A). By contrast, the roots of BnaNPC4-KO mutant and WT plants had similar levels of PC, PE and PS under Pi-sufficient and Pi-deficient conditions (Figure 5A–C). For non-phosphoglycerolipids, compared to WT, the levels of total DAG and five DAG species were decreased in the roots of BnaNPC4-OE plants (Figures S5A, S6A; Table S1). BnaNPC4-OE roots displayed a 37.1% increase in monogalactosyldiacylglycerol (MGDG) levels (Figures S5B, S6B) and a 16.1% increase in DGDG levels (Figures S5C, S6C), with most molecular species showing significant increases in these BnaNPC4-OE lines (Figure S6; Table S1). Similarly, compared to WT, BnaNPC4-OE leaves had lower levels of PC (11.7%), PE (6.3%), and PS (19.0%) than WT leaves (Figure 5A–C), with most phosphoglycerolipid species displaying significant decreases (Figure 5F–H; Table S1). Under Pi deficiency conditions, BnaNPC4-OE leaves exhibited a further decrease in phosphoglycerolipid levels, with the abundances of PC, PE, and PS being 25.5%, 24.4%, and 8.2% lower, respectively, than those in WT leaves (Figure 5A–C), while most phosphoglycerolipid species displayed significant decreases (Figure 5F–H; Table S1).
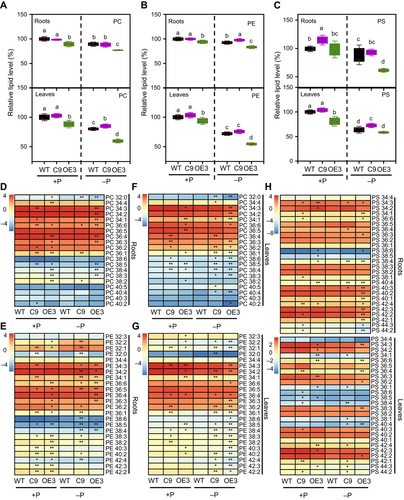
Changes of phosphoglycerolipid levels in leaves and roots in response to Pi starvation
(A–C) PC (A), PE (B), and PS (C) levels in roots (upper) and leaves (lower) in the leaves of BnaNPC4 overexpression (OE) and knockout (KO) lines grown under Pi-sufficient or Pi-deficient conditions. (D–H) Heatmap representation of the levels of lipid species for PC, PE, and PS in the leaves of BnaNPC4 OE and KO lines grown under Pi-sufficient or Pi-deficient conditions. Seven-d-old seedlings were transferred to Pi-sufficient or Pi-deficient hydroponic medium for 3 weeks. Values are means ± SD (n = 4). Levels of lipids are shown relative to the level of lipids in wild type (WT) under Pi-sufficient conditions (set to 100%). Average data of lipid percentages for each species were normalized by log2. Different letters indicate differences at P < 0.05 using one-way analysis of variance. * is significant at P < 0.05, ** is significant at P < 0.01, compared to WT under the same condition, based on Student's t-test. PC, phosphatidylcholine; PE, phosphatidylethanolamine; PS, phosphatidylserine.
By contrast, the leaves of BnaNPC4-KO mutant lines had levels of total PC, PE, and PS comparable to those of WT leaves under sufficient Pi supply (Figure 5A–C). The levels of total MGDG and DGDG were also similar between WT and BnaNPC4-KO leaves (Figure S5B, C), with the exception of DAG content, which was lower in BnaNPC4-KO leaves than in WT leaves (Figure S5A). As noted earlier, the lack of effect in the BnaNPC4-KO mutants is consistent with the lower BnaNPC4 expression detected in leaves under Pi-sufficient conditions (Figures 1B, S1A). By contrast, under Pi deficiency conditions, the leaves of the BnaNPC4-KO mutants accumulated more PC (6%), PE (5%), and PS (13.7%) than WT leaves (Figure 5A–C), with most phosphoglycerolipid species displaying significant increases (Figure 5F–H; Table S1). For non-phosphoglycerolipids, compared to WT, the levels of three DAG species were lower in the leaves of BnaNPC4-KO mutant plants (Figure S5A; Table S1), while total DGDG levels increased by 35.2% in the leaves (Figure S5C), with most non-phosphoglycerolipid species showing significant increases in the leaves of BnaNPC4-OE lines (Figure S6; Table S1). The greater effect under Pi-deficient conditions relative to Pi-sufficient conditions in the mutants support the idea that Pi-deficiency-induced BnaNPC4 contributes to glycerolipid hydrolysis. The opposite changes seen for phosphoglycerolipids in BnaNPC4-OE and BnaNPC4-KO mutant lines suggest that BnaNPC4 uses phosphoglycerolipids as substrate, thereby altering the overall phosphoglycerolipid composition, in rapeseed.
BnaNPC4 hydrolyzes both phosphosphingolipids and phosphoglycerolipids
To test whether BnaC01.NPC4 encodes an active enzyme hydrolyzing phosphosphingolipids and phosphoglycerolipids, we produced His-tagged BnaC01.NPC4 in Escherichia coli. The coding sequence of BnaC01.NPC4 is 1,611 bp, coding for 537 amino acids, and the target protein with His-taq (BnaC01.NPC4-6xHis) was 68 kDa (Figure 6A). We established that recombinant purified BnaC01.NPC4-6xHis hydrolyzes PC to produce DAG, whereas we detected no such activity when using a protein preparation obtained from E. coli cells transformed with the empty vector as control (Figure 6B). BnaNPC4 also hydrolyzed other phosphoglycerolipids tested, including PE, PG, PI, PS, and PA, to generate DAG (Figures 6C, S7).
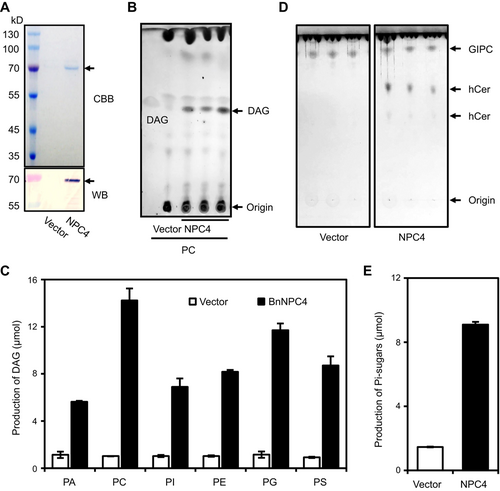
Brassica napus NON-SPECIFIC PHOSPHOLIPASE C4 (BnaNPC4) hydrolyzes GIPC and phosphoglycerolipids
(A) Coomassie Brilliant Blue staining (upper) and immunoblotting (lower) of recombinant BnNPC4 purified from Escherichia coli. (B) hCer production in the presence of GIPC and purified BnaNPC4, as shown on thin-layer chromatography. Vector refers to a negative control using an equal volume of eluents from an identically processed sample containing empty vector alone. (C) Production of soluble Pi in the presence of GIPC and purified BnaNPC4. Pi levels were assayed using a molybdenum blue method. Values are means ± SD (n = 3). (D) DAG production in the presence of PC and purified BnaNPC4, as shown by thin-layer chromatography. (E) Quantification of DAG production by mass spectrometry in the presence of purified BnaNPC4 and various phosphoglycerolipids. Values are means ± SD (n = 3). Vector refers to a negative control using an equal volume of eluents from an identically processed sample containing empty vector alone. DAG, diacylglycerols; GIPC, glycosylinositolphosphoceramides; hCer, hydroxyceramide; PA, phosphatidic acid; PC, phosphatidylcholine; PE, phosphatidylethanolamine; PG, phosphatidylglycerol; PI, phosphatidylinositol; PS, phosphatidylserine.
When the phosphosphingolipid GIPC was used as substrate for recombinant BnaC01.NPC4-6xHis, we observed a decrease in the level of GIPC with a concomitant increase in the lipid product hCer (Figure 6D) and soluble head-group phosphate (Figure 6E). These results indicate that BnaNPC4 hydrolyzes both phosphoglycerolipids and phosphosphingolipids and can use various classes of phospholipids as substrates in vitro. This finding is consistent with our recent protein structure analysis of NPC4 revealing how the large exposed cleft of NPC4 enables the recognition of phospholipids with different molecular sizes (Fan et al., 2023).
BnaNPC4-KO and BnaNPC4-OE plants show opposite effects on the expression of genes involved in Pi responses and Pi content
During membrane lipid remodeling under Pi deficiency, the decrease in phospholipid contents is accompanied by an increase in non-phospholipids to maintain membrane integrity and function. DAG and hCer released by NPC4 can be converted to non-phospholipids (glycolipids and triacylglycerols (TAGs)) by non-phospholipid synthases, such as digalactosyldiacylglycerol synthase 2 (DGD2), monogalactosyldiacylglycerol synthase type C (MGDC), UDP-sulfoquinovose synthase 2 (SQD2), and diacylglycerol acyltransferase (TAG1). Similarly, the phosphorylated head groups produced by NPC can be dephosphorylated by phosphatases, such as PAP, phosphoethanolamine/phosphocholine phosphatase 1 (PEPC1), and phosphate starvation-induced gene 2 (PS2), to release Pi for cellular use (Angkawijaya and Nakamura, 2017). Pi is further redistributed for plant cellular and growth needs within by the plasma membrane phosphate transporters PHT1 and PHO1 and by intracellular transporters, such as PHO1, PHT2, PHT3, PHT4, and PHT5 (Abbas et al., 2018; Dissanayaka et al., 2021; Shi et al., 2021).
Thus, we monitored the transcript levels of selected genes involved in lipid metabolism and PSR. Compared to WT, the leaves of BnaNPC4-OE plants showed higher transcript levels of the non-phospholipid biosynthesis genes SQD2, DGD2, TAG1, and MGDC, the phosphatase genes GLYCEROPHOSPHODIESTER PHOSPHODIESTERASE 5 (GDPD5), MYO-INOSITOL POLYPHOSPHATE 5-PHOSPHATASE (IP5PII), PAP8, and PAP17, the P homeostasis regulator gene CATION EXCHANGER 3 (CAX3), and the Pi transporter genes PHO1;H3, PHT2;1, and PHT4;4 (Figure 7A). By contrast, the leaves of BnaNPC4-KO mutant plants had lower transcript levels of these genes (Figure 7A). The observed pattern in the expression levels of these genes in BnaNPC4-OE and BnaNPC4-KO lines suggests that BnaNPC4 promotes membrane phospholipid hydrolysis and increases the expression of genes involved in Pi metabolism, transport, and response.
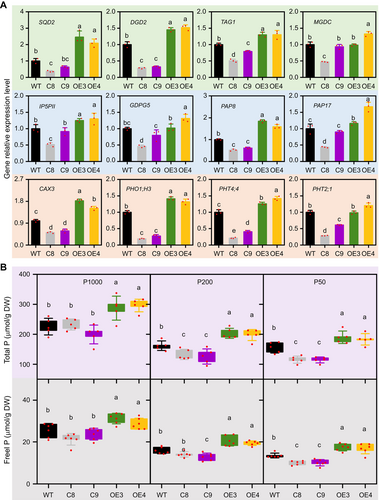
Effects of altering Brassica napus NON-SPECIFIC PHOSPHOLIPASE C4 (BnaNPC4) function on the transcript levels of selected genes in lipid metabolism and Pi responses and P contents under different Pi levels
(A) Relative transcript levels of the indicated genes, as determined by reverse transcription – quantitative polymerase chain reaction (RT-qPCR) using total RNA extracted from the leaves of 4-week-old plants. Values are means ± SD (n = 3), with values in wild type (WT) set to 1. Different letters indicate differences at P < 0.05 using one-way analysis of variance (ANOVA). (B) Total P (upper) and free Pi (lower) contents of leaves from plants grown under different Pi levels supplied to the soil. Data are derived from rapeseed plants grown in the greenhouse with 50 (P50), 100 (P100), or 1,000 (P1000) µmol/L Pi. Values are means ± SD (n = 10); different letters indicate significant differences at P < 0.05 by one-way ANOVA.
To examine the effect of BnaNPC4 on Pi usage, we assayed the total P (TP) and free Pi content in the leaves of WT and BnaNPC4-OE and BnaNPC4-KO lines in rapeseed grown in soil under Pi-sufficient and Pi-deficient conditions. BnaNPC4-OE had higher levels of TP and free Pi under both Pi-sufficient and Pi-deficient conditions. By contrast, BnaNPC4-KO accumulated as much TP and free Pi as WT under sufficient Pi supply. However, under Pi-deficient conditions, BnaNPC4-KO plants showed lower TP and free Pi levels in their leaves compared to WT. In addition, the magnitude of the decrease in TP and free Pi increased with a decrease in Pi supply from 200 µmol/L to 50 µmol/L Pi (Figure 7B). This finding is consistent with the higher expression of phosphatase genes and Pi transporter genes in the BnaNPC4-OE lines (Figure 7A).
DISCUSSION
This study demonstrates the role of BnaNPC4 in rapeseed growth and response to Pi availability. We determined that BnaNPC4 promotes growth under both P-sufficient and P-deficient conditions, with a greater effect under P deficiency. Plant growth was enhanced in BnaNPC4-OE but impeded in BnaNPC4-KO lines, as evidenced by root length, plant height, and biomass accumulation (Figure 2). These effects are consistent with the lipid levels in leaves and roots measured in BnaNPC4-OE and BnaNPC4-KO lines. Indeed, BnaNPC4-OE plants showed a decreased ratio of phospholipids to galactolipids, resulting in increased Pi levels in leaves (Figures 3–5). The change in the phospholipid to non-phospholipid ratio is mediated by both increases in phospholipases and non-phospholipid synthases (Nakamura, 2013). At the same time, the P-containing head groups released by NPC-mediated hydrolysis of phospholipids are dephosphorylated by phosphatases to release Pi (Angkawijaya and Nakamura, 2017). In agreement, BnaNPC4 OE led to increases in the expression of genes encoding non-phospholipid synthases, phosphatases, and Pi transporters. The neutral lipids (DAG and hCer) produced by BnaNPC4-catalyzed hydrolysis of phospholipids can be reused to synthesize non-phospholipids and maintain membrane integrity and function via the increased expression of non-phospholipid synthase genes (e.g., DGD2 and SQD2) in the BnaNPC4-OE lines (Figures 3–5, 7A). Moreover, the Pi released by phosphatases (IP5PII and PAPs) can be transported by Pi transporters (CAX3, PHO1;H3, PHT4;4 and PHT2;1) for other P-requiring cellular reactions (Figure 7A), such as the biosynthesis of nucleic acids and adenosine triphosphate. Therefore, BnaNPC4 OE accelerates the release of P from phospholipids, raises Pi content, and improves PUE in rapeseed, thereby promoting plant growth.
Another new finding is that BnaNPC4 alters glycerolipid composition in rapeseed. Although NPC4 expression is known to be highly induced under Pi deficiency, studies in Arabidopsis have indicated that alterations of NPC4 function resulted in no clear decrease in the contents of phosphoglycerolipids under Pi-deficient or Pi-sufficient conditions (Nakamura et al., 2005; Su et al., 2018). Recent studies showed that NPC4 in Arabidopsis is responsible for the hydrolysis of the phosphosphingolipid GIPC in roots, thus decreasing its abundance (Yang et al., 2021a, 2021b). The current study showed that unlike NPC4 in Arabidopsis, BnaNPC4-KO and BnaNPC4-OE in rapeseed exhibit altered compositions of both phosphosphingolipids and phosphoglycerolipids (Figures 3–5). Our analysis of BnaNPC4 also supports the notion that BnaNPC4 has dual activity for hydrolyzing phosphoglycerolipids and phosphosphingolipids (Figure 6).
The comparison of NPC family members in different plant species, together with previous NPC analyses in Arabidopsis, provides interesting insights into the difference in NPCs between Arabidopsis and rapeseed and maybe other angiosperm species. Arabidopsis has six NPCs, with NPC4 and NPC5 being the most similar. The present sequence analysis indicates that BnaNPC4 and other NPCs from this clade share the Cys residue that is S-acylated in their C termini; this Cys-NPC subfamily is only present in angiosperms (Figure 1A). However, Arabidopsis NPC5 appears to be an exception, as it lacks the C-terminal Cys residue and occurs only in Arabidopsis but not in other angiosperm species examined (Figure 1A). Indeed, localization analyses showed that NPC5 is soluble, whereas NPC4 is associated primarily with the plasma membrane (Gaude et al., 2008; Yang et al., 2021a, 2021b), and the S-acylation at the C terminus of BnaNPC4 was required for its membrane association (Yang et al., 2021a, 2021b). In Arabidopsis, NPC4 and NPC5 are involved in plant response to Pi deficiency, but NPC5 function was reported to differ from that of NPC4 (Nakamura et al., 2005; Gaude et al., 2008; Yang et al., 2021a). NPC5 acts primarily in leaves, where it hydrolyzes phosphoglycerolipids, whereas NPC4 functions primarily in roots by cleaving phosphosphingolipids (Gaude et al., 2008; Yang et al., 2021a, 2021b). The loss of NPC4 or NPC5 function alone in Arabidopsis resulted in no apparent phenotypic consequences compared to WT (Nakamura et al., 2005; Gaude et al., 2008; Yang et al., 2021a, 2021b). Thus, BnaNPC4 in rapeseed appears to combine the activities associated with Arabidopsis NPC4 and NPC5 in one enzyme, hydrolyzing both phosphoglycerolipids and phosphosphingolipids to release Pi and promote rapeseed growth. Plant cells have many P-containing compounds, and a desired P distribution among cellular components is key to improving plant PUE, although little is known about which exact P distribution is desirable and how P distribution is modulated in plant cells (Plaxton and Tran, 2011; Johnston et al., 2014; Cong et al., 2020). Phospholipids contain about one-third of the total P in plant cells and constitute a major P reservoir (Nakamura, 2013; Yeats et al., 2018; Dissanayaka et al., 2021; Liu et al., 2021b). Plants with efficient P use are thought to have high levels of free Pi with a low level of P-containing lipids (Schneider et al., 2019; Cong et al., 2020). In this study, we showed that BnaNPC4-OE rapeseed plants have lower phospholipid levels and elevated free Pi levels, whereas BnaNPC4-KO plants exhibit the opposite phenotype (Figure 7B). Thus, increased BnaNPC4 expression in rapeseed improves cellular P distribution with a lower lipid P level and increased Pi level, thereby improving P utilization and promoting plant growth. Our results suggest that BnaNPC4 is a high-P-utilization gene with strong potential for application to improve P utilization in crops.
MATERIALS AND METHODS
Plant material and growth conditions
The ‘Westar’ cultivar of rapeseed (Brassica napus) was used for genetic manipulations and physiological experiments. Hydroponic experiments were conducted using a modified plant culture Hoagland solution containing 5 mmol/L KNO3, 1 mmol/L KH2PO4 (for Pi-sufficient conditions) or K2SO4 (for Pi-deficient conditions), 2 mmol/L MgSO4, 5 mmol/L Ca(NO3)2, 46 μmol/L H3BO3, 0.32 μmol/L CuSO4, 0.77 μmol/L ZnSO4, 9.14 μmol/L MnCl2, and 0.37 μmol/L Na2MoO4 with 50 μmol/L ethylenediaminetetraacetic acid (EDTA)-Fe (II), at pH 5.8. Seven-d-old seedlings germinated and grown in pure water were transferred to Pi-sufficient or Pi-deficient conditions for several weeks, at which point the photographs were taken. Rapeseed plants were grown in a growth room with a 16-h light/8-h dark photoperiod at 25°C/21°C (day/night), 50% humidity, and a light intensity of 200 µmol/m2/s.
Rapeseed plants were grown in an air-conditioned, climate-controlled (Argus Control Systems) greenhouse set at 20°C–21°C, 40%–60% humidity, and 14-h light/10-h dark photoperiod with supplemental light threshold of 566 µmol/m2/s1 (with supplemental lights turning off when outside solar radiation was 566 µmol/m2/s1 or above). The shade curtain was automatically pulled to 50% when sunlight was over 700 W/m2 and was pulled down 100% when the sunlight was over 800 W/m2. Seeds were sown in soil (vermiculite: perlite; 3:1, v/v). One seed per genotype was sown per pot (3.79 L), with 10 pots per genotype. Seven pots were placed on a shelf (52 × 118 cm; width × length). Therefore, each individual plant had a growth area of 876.6 cm2. All pots were randomly positioned on the shelf. Plants were fertilized with Hoagland solutions supplemented with 1,000 µmol/L P, 200 µmol/L P, or 50 µmol/L P by dipping the pots in the solution for 5 min once a week (young seedlings), or every 5 d (adult plants). After fertilization, the pots were randomly placed back on the shelf. Such watering with fertilization continued until at least half of the seed pods turned brown and was stopped once all pods were brown. Leaves were harvested from 3-week-old seedlings for determination of total P and soluble inorganic P contents. The agricultural traits were measured with 8-week-old plants or mature plants.
Phylogenetic analysis
Amino acid sequences of NPCs using Arabidopsis proteins as the query were retrieved from UniProt (https://www.uniprot.org/). A multiple sequence alignment of NPCs was generated by ClustalW and the phylogenetic tree was reconstructed by the neighbor-joining method using MEGA 7.0. The phylogenetic tree was modified by EVOLVIEW (https://www.evolgenius.info/evolview/) (Zhang et al., 2012). The functional domains of NPCs were determined by European Bioinformatics Institute Search InterPro (http://www.ebi.ac.uk/interpro/search/sequence/).
RNA extraction and qRT-PCR
Total RNA was extracted from tissues, such as leaves, stems, roots, flowers, silique wall, and seeds, of rapeseed using Trizol reagent. The isolated RNA was used as template for first-strand cDNA synthesis through RT using an iScript kit (Bio-Rad). qPCR was performed with SYBR green fluorescent labeling of double-stranded DNA using a CFX Connect instrument (Bio-Rad). The expression level was normalized to that of ACTIN7 (BnaA06G0089200WE). PCR reactions were as follows: one cycle at 95°C for 1 min; 45 cycles at 95°C for 15 s, 60°C for 15 s, and 72°C for 20 s; and final extension of DNA at 72°C for 5 min. The qPCR primers and description of the genes are listed in Tables S2 and S3.
Protein production, purification, and NPC activity assay
The full-length coding sequence of NPC4 was amplified from first-strand cDNA prepared from total RNA of rapeseed using forward (5′-CGGAATTCATGGCACAGACGACTTTAGGCTCAG-3′, EcoRI) and reverse primers (5′-CCCTCGAGTCAATCATGACTAGCAAAGCAAGAGAAC-3′, XholI). After digestion with the appropriate restriction enzymes, the fragment was cloned into the vector pET28a(+). The resulting NPC4-6×His vector was transformed into the E. coli strain BL21 (DE3). The NPC4-6xHis fusion protein was produced and purified as described previously. Isopropyl β-D-1-thiogalactopyranoside (0.1 mmol/L final concentration) was added to the bacterial culture when it reached an optical density at 600 nm of 0.6 to induce NPC4 protein production for 16 h at 16°C (Yang et al., 2021a). The bacterial cells were harvested by centrifugation at 15,000 × g for 10 min at 4°C and resuspended in extraction buffer containing 50 mmol/L Tris-HCl, pH 7.3, 50 mmol/L NaCl, 5% (v/v) glycerol, 1 mmol/L dithiothreitol (DTT), and 0.5 mmol/L phenylmethylsuflonyl fluoride (PMSF). The bacterial cells were lysed by sonication and centrifuged at 15,000 × g for 30 min at 4°C to remove cell debris. For purification, Ni-NTA agarose (GE Healthcare) was used according to the manufacturer's instructions. Briefly, 0.5 mL of nickel-nitrilotriacetic acid (Ni-NTA) agarose was added to 3 mL bacterial supernatant and incubated for 1 h with gentle agitation at room temperature. Ni-NTA agarose beads were loaded onto a column and washed four times using wash buffer containing 50 mmol/L Tris-HCl, pH 7.3, 50 mmol/L NaCl, 5% (v/v) glycerol, 1 mmol/L DTT, 50 mmol/L imidazole and 0.5 mmol/L PMSF. The purified proteins were separated by 10% (w/v) sodium dodecyl sulfate – polyacrylamide gel electrophoresis, the resulting gels were stained with Coomassie Brilliant Blue, transferred to polyvinyl difluoride membranes, and then subjected to immunoblotting using His-tag antibodies (1:3,000 dilution; A-5588, Sigma).
NPC activity was assayed as previously described (Nakamura et al., 2005; Peters et al., 2010; Yang et al., 2021a). The reaction mixture contained 10 μg purified NPC4-6xHis and lipids that were emulsified in reaction buffer (25 mmol/L HEPES, pH 7.5, 10 mmol/L CaCl2, and 10 mmol/L MgCl2) by sonication on ice for 5 min in a final volume of 200 µL. The reaction was incubated at 30°C for 30 min and stopped by adding 200 µL of butanol followed by vigorously vortexing. The sample was centrifuged at 12,000 × g for 3 min at room temperature and 200 µL of the lower phase was used to measure the phosphate released from the head group, as determined by molybdenum blue staining. For thin-layer chromatography (TLC), the solvent from the organic, upper phase of the 200 µL butanol extract from the reaction was evaporated under a stream of N2, and the residue was dissolved in 20 µL chloroform and separated on a TLC plate (Yang et al., 2021a). GIPC was chromatographed in a mixture of CHCl3, CH3OH, and 4 mol/L NH4OH (9:7:2, v/v/v) with 0.2 mol/L ammonium acetate. DAG was chromatographed in a mixture of petroleum ether, diethyl ether, acetic acid (50:50:1, v/v/v) and visualized by copper sulfate staining as described (Kim et al., 2009).
Genomic editing and plant transformation of NPC4 in B. napus
Vectors for NPC4 OE and CRISPR/Cas9-mediated gene editing were constructed and introduced into the Westar cultivar using a method previously described (Dai et al., 2020). In brief, the full-length NPC4 coding sequence was cloned from first-strand cDNA prepared from total RNA of rapeseed leaves into the pMDC83 vector after digestion with SpeI and AscI. The primers for the amplification of NPC4 were as follows: forward primer (5′-GGACTAGTATGGCACAGACGACTTTAGGCTCAG-3′) and reverse primer (5′-TTGGCGCGCCTCAATCATGACTAGCAAAGCAAGAG-3′). The NPC4 knockout target site was designed to target the second exon of NPC4 by CRISPR-P2.0 (http://crispr.hzau.edu.cn/CRISPR2/) (Lei et al., 2014). Oligonucleotides for the target site annealed to form double-stranded DNA was inserted into pKSE401 (Zhang et al., 2020b). The vectors were transformed into the Agrobacterium tumefaciens strain GV3101. Transgenic plants were produced with the resulting plasmids via Agrobacterium-mediated transformation of rapeseed as previously described (Dai et al., 2020).
The homozygosity of the T-DNA insertion in NPC4-OE lines was verified by PCR-based genotyping using a T-DNA left border primer and gene-specific primers. NPC4 expression in WT and OE were analyzed by RT-PCR; NPC4 protein abundance was checked by immunoblotting with an anti-GFP antibody (1:3,000 dilution; sc-9996, Santa Cruz) conjugated with horseradish peroxidase (HRP). CRISPR/Cas9 knockout mutants of NPC4 were identified by Sanger sequencing of the target sites using upstream and downstream primers. Primers used for the PCR verification of NPC4-OE and mutant are listed in Table S2.
Lipids analysis
Lipids were extracted as previously described (Markham and Jaworski, 2007; Vu et al., 2014). Briefly, 10 to 30 mg of freeze-dried leaf and root samples were homogenized and resuspended in 3 mL extraction solvent H (isopropanol, heptane, water mixture, 55:20:25, v/v/v). The supernatant was collected and dried under a stream of nitrogen gas. Samples were heated in 1 mL of tetrahydrofuran (THF), methanol, water mixture (2:1:2, v/v/v) containing 0.1% (v/v) formic acid, dissolved by ultrasound sonication, and then centrifuged at 500 × g for 10 min to remove insoluble substances. Total lipids were analyzed using an Exion ultra-performance liquid chromatography system coupled with a triple quadrupole/ion trap mass spectrometer (6500 Plus QTRAP; SCIEX) according to a previous method with modifications (Vu et al., 2014; Yang et al., 2021a).
Measurement of P concentration
Total P and soluble Pi concentrations were measured based on a modified ammonium molybdate staining method (Feng et al., 2011). For total P measurement (Hazel et al., 2014), 10–20 mg freeze-dried samples were digested in 3 mL HNO3 at 100°C for 1 h. After cooling for 10 min, 1 mL of HClO4 was added, and the acid digests were heated to 120°C for 1 h until the tissues were completely broken down. After cooling, samples were diluted with 2 mL of double-distilled water. Aliquots (10–50 µL) of samples were diluted to 800 µL and then 150 μL of molybdate solution (17.55 g/L (NH4)6 Mo7•4H2O, 2 mol/L H2SO4) was added. After 10 min, 50 μL of green malachite solution (3.5 g/L polyvinylic alcohol, 0.35 g/L malachite green) was added and allowed to stand for 2 h. The absorbance of the reaction was measured at 650 nm and the total P concentrations were calculated from a standard curve constructed using standard solutions of KH2PO4. To determine soluble inorganic phosphorus concentrations (Staudinger et al., 2022), dried leaves were ground to powder and extracted with hot water (10% w/v) at 85°C for 40 min. The extracts were centrifuged at 5,000 × g for 2 min at room temperature and aliquots of the supernatant were diluted to 650 µL. The diluted sample was mixed with 50 μL 10% (w/v) ascorbic acid and 300 μL of a 0.44% (w/v) ammonium paramolybdate solution (in 1 NH2SO4). After the mixture was incubated at 42°C for 1 h, absorbance was determined at 820 nm from a standard curve with KH2PO4. Experiments included five biological repeats.
Statistical analysis
Values are means ± SD. Different letters indicate differences at P < 0.05 among genotypes during different growth conditions based on a one-way analysis of variance (ANOVA). * is significant at P < 0.05; ** is significant at P < 0.01 compared to the control based on Student's t-test.
ACKNOWLEDGEMENTS
This work was supported by grants from the National Key Research and Development Program of China (2022YFD1200400), the Key Research and Development Plan of Hubei Province (2021ABA011), Fundamental Research Funds for the Central Universities (2662022ZKPY001), a Higher Education Discipline Innovation Project (B20051), an Agriculture and Food Research Initiative (AFRI) award [2020-67013-30908/project accession number 1022148] of the US Department of Agriculture National Institute of Food and Agriculture, and the China Postdoctoral Science Foundation (2023M731230).
CONFLICTS OF INTEREST
The authors declare no conflicts of interest.
AUTHOR CONTRIBUTIONS
L.G. and X.W. designed and supervised this study. B.Y., J.L., J.Y., K.Z., Z.O., Y.L., H.W., and Q.L. performed the experiments. B.Y. analyzed the data and wrote the manuscript. L.G., X.W., Y.H., X.Y., and S.L. revised the manuscript. All authors read and approved the manuscript.


