Elicitor hydrophobin Hyd1 interacts with Ubiquilin1-like to induce maize systemic resistance
Abstract
Trichoderma harzianum is a plant-beneficial fungus that secretes small cysteine-rich proteins that induce plant defense responses; however, the molecular mechanism involved in this induction is largely unknown. Here, we report that the class II hydrophobin ThHyd1 acts as an elicitor of induced systemic resistance (ISR) in plants. Immunogold labeling and immunofluorescence revealed ThHyd1 localized on maize (Zea mays) root cell plasma membranes. To identify host plant protein interactors of Hyd1, we screened a maize B73 root cDNA library. ThHyd1 interacted directly with ubiquilin 1-like (UBL). Furthermore, the N-terminal fragment of UBL was primarily responsible for binding with Hyd1 and the eight-cysteine amino acid of Hyd1 participated in the protein-protein interactions. Hyd1 from T. harzianum (Thhyd1) and ubl from maize were co-expressed in Arabidopsis thaliana, they synergistically promoted plant resistance against Botrytis cinerea. RNA-sequencing analysis of global gene expression in maize leaves 24 h after spraying with Curvularia lunata spore suspension showed that Thhyd1-induced systemic resistance was primarily associated with brassinosteroid signaling, likely mediated through BAK1. Jasmonate/ethylene (JA/ET) signaling was also involved to some extent in this response. Our results suggest that the Hyd1-UBL axis might play a key role in inducing systemic resistance as a result of Trichoderma-plant interactions.
-
Edited by: Hailing Jin, University of California, Riverside, USA
INTRODUCTION
Plants are exposed to both destructive and beneficial microorganisms in the environment, and plant survival depends on the ability to sense danger and mount a rapid defense against pathogens (Paul et al. 2000; Ben Khaled et al. 2015). Plant defenses can be triggered both locally at the site of infection and systemically. Induction of the local response can result in signal transduction to induce systemic defenses that fall into two categories: systemic acquired resistance (SAR) and induced systemic resistance (ISR) (Macho and Zipfel 2014). SAR is conserved among diverse plants and confers long-lasting resistance even to unrelated pathogens. The SAR mechanism involves salicylic acid (SA), SA-related genes, and pathogenesis-related proteins (Kachroo and Robin 2013; Shah and Zeier 2013). Intriguingly, plant systemic resistance is triggered not only by pathogens, but also upon root colonization by beneficial microorganisms, including Trichoderma species (Harman et al. 2004). During ISR, such interactions between beneficial microorganisms and plant roots primes the plant against pathogen attack, in a process mediated through jasmonate (JA)- and ethylene (ET)-dependent signal transduction. This beneficial interaction-associated ISR is effective against many pathogens (van Loon et al. 1998; Djonovic et al. 2007; Akram et al. 2008).
Members of the genus Trichoderma grow on a wide range of substrates and have been used as biocontrol agents, inducing resistance to pathogens in plants (Benitez et al. 2004; Harman et al. 2004). In addition to physical and chemical barriers, plants have evolved to recognize conserved structural traits typical of entire classes of microbes, namely pathogen- or microbe-associated molecular patterns (PAMPs or MAMPs, respectively). MAMP-elicited plant responses are triggered rapidly and transiently, generally involving bursts of reactive oxygen species (ROS), the release of ET and nitric oxide through ion fluxes across the plasma membrane, and later, callose deposition and formation of antimicrobial compounds (Hermosa et al. 2012). Various strains of Trichoderma, which are among the most widely-studied plant-beneficial fungi, express different elicitors. Sm1 and Epl1 are members of the cerato-platanin family of proteins expressed in hyphae during plant root colonization and act as elicitors in various plants (Djonovic et al. 2006; Seidl et al. 2006). In addition to expressing cerato-platanin proteins, the surface of Trichoderma is covered with hydrophobins that contain eight conserved cysteine residues that form four disulfide bridges. Hydrophobins form two classes based on their hydropathy plots: soluble and layer-forming types (Linder et al. 2005; Bayry et al. 2012). Hydrophobins in the biocontrol fungus Clonostachys rosea contribute to not just conidial hydrophobicity and conidial germination, but also to induce resistance against Botrytis cinerea in Arabidopsis thaliana (Dubey et al. 2014). Although their hydrophobic properties are well understood, the mechanisms by which Trichoderma hydrophobins promote pathogen resistance require further research.
The necrotrophic lifestyle pathogen Curvularia lunata causes maize leaf spot diseases, resulting in notable economic loss in China (Gao et al. 2014). The mechanism by which Trichoderma harzianum hydrophobins in plant roots mediate maize systemic resistance remains largely unknown. Of particular interest is the role of protein–protein interactions in maize roots. Here, we report that the class II hydrophobin Hyd1 induces maize resistance against C. lunata. We identified Ubiquilin 1-like as a target of Hyd1 and demonstrated that both proteins are crucial for systemic resistance against the leaf spot pathogen by promoting long-distance transduction of the defense response.
RESULTS
Cloning the hyd1 gene
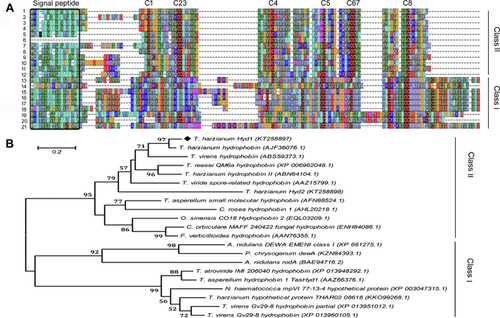
Previous findings suggested that some hydrophobin-like proteins influence plant defense. Here, we cloned the hyd1 gene, which contains two introns and a 282-bp open reading frame (ORF) (Figure S1). Hyd1 was aligned with other fungi hydrophobins that contain eight cysteine residues in their protein sequences (Figure 1A), and the alignment was used to construct a neighbor-joining tree to infer the evolutionary relationships among the hydrophobins (Figure 1B). Hyd1 from T. harzianum T28 clustered with other Trichoderma sequences and formed a distinct subclade with a hydrophobin protein from T. harzianum, supported by a bootstrap value of 97%. Taken together, the data suggest that T. harzianum hyd1 encodes a putative class II hydrophobin containing the typical signature of C-Xn-CC-Xn-C-Xn-C-Xn-CC-Cn.
Hyd1 subcellular localization in T. harzianum and protein expression in maize roots
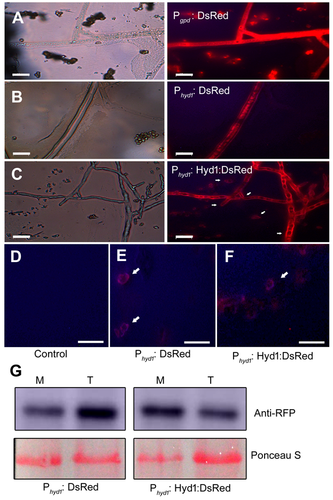
According to the method described by Yu et al. (2014), we constructed hyd1-knockout (KO16) and -overexpression (OE3 and OE5) strains and the sequence encoding the DsRed reporter protein (Phyd1 + Hyd1 + DsRed) were ligated by overlapping PCR and transformed into KO16. As a positive control, we transformed the promoter of the A. nidulans gpd (glyceraldehyde-3-phosphate dehydrogenase) gene and DsRed into KO16 (Pliego et al. 2009). To test the activity of the endogenous promoter, we transformed a 2-kb fragment of the hyd1 promoter and DsRed into KO16. In both controls, fluorescence was distributed throughout the cells (Figure 2A, B). By contrast, in the KO16 transformant cells carrying the Phyd1 + Hyd1 + DsRed fusion, the fluorescence was observed at the cell perimeter, showing that Hyd1 localizes to the cell surface (Figure 2C). Furthermore, the cell walls of KO16 (background), and the Phyd1 + DsRed and Phyd1 + Hyd1 + DsRed strains were digested by enzymes, which showed that there was no autofluorescence in KO16 (Figure 2D). In the Phyd1 + DsRed and Phyd1 + Hyd1 + DsRed strains, fluorescence was localized to the cell membrane (Figure 2E, F), which demonstrated that Hyd1 chiefly localized on the cell membrane. In addition, we extracted the membrane and total proteins. Using western blotting, Hyd1 was mainly identified in the membrane fraction, while Phyd1 + DsRed were present both on the membrane and in the total protein fraction (Figure 2G). We also analyzed gene expression to test whether disruption or overexpression of hyd1 results in alteration of transcript accumulation in maize roots. In KO16, no hyd1 transcripts were detected, whereas hyd1 transcript levels were higher in the overexpression lines compared to the wild type. Together, these data not only confirmed the construction of the hyd1 transformants, but also demonstrated that hyd1 was expressed in plant roots (Figure S3A).
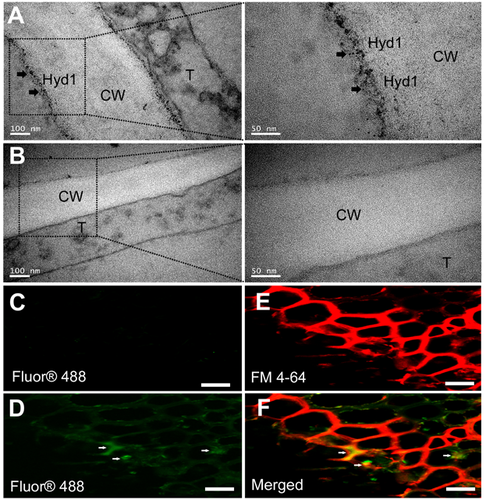
To investigate the exact expression sites of Hyd1 in the maize roots, we used immunoelectron microscopy. Hyd1-associated gold granules were mainly on the plasma membrane (Figure 3A), while there were no gold granules in the wild-type root sections (Figure 3B). In addition, Hyd1 was associated with T. harzianum colonization using qPCR and scanning electron microscopy (Figure S3B, C). Furthermore, a negative control (maize root without Trichoderma) and histidine (His)-tagged hyd1 strain-colonized B73 roots were imaged by immunofluorescence microscopy. There was almost no autofluorescence in the negative control (Figure 3C). Hyd1 (green) was mainly expressed in the cortex of maize roots (Figure 3D). Meanwhile, we used FM4-64, a lipophilic dye that labels membranes, to stain the sections (Figure 3E) and showed that the Hyd1 signal merged with the FM4-64 fluorescence on the membranes (Figure 3F). In summary, Hyd1 is associated with T. harzianum colonization and mainly localizes to the plasma membrane in maize roots. Together, these findings provide the prerequisite conditions for Hyd1 to act as an elicitor by interacting with maize root proteins.
Hyd1 is required for ISR in maize
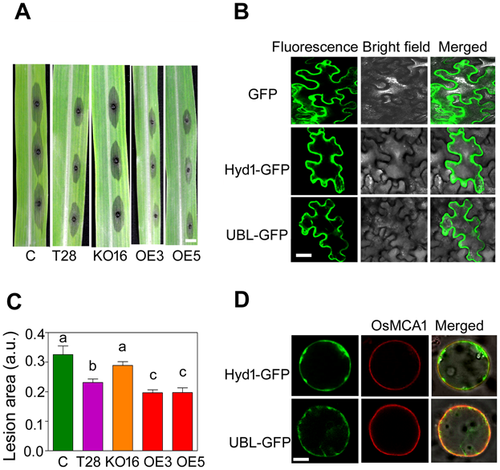
To address whether T. harzianum causes systemic resistance in maize via Hyd1 expression, we compared T28- (wild-type strain), KO16-, OE3-, and OE5-treated maize seedlings challenged with the foliar pathogen C. lunata and assessed the disease 3 d post-inoculation (Figure 4A). The lesions on plants not treated with T. harzianum or treated with the KO16 strain appeared earlier and grew larger than those on the T28-, OE3-, or OE5-treated strains. Importantly, the lesions on the plants treated with the OE strains were significantly smaller than the lesions on the leaves of plants treated with T28 (Figure 4B). Thus, Hyd1 contributes to host plant systemic resistance against C. lunata.
Physical interaction between the Hyd1 and UBL proteins
To understand how Hyd1 modulates plant pathogen resistance, we used yeast two-hybrid (Y2H) assays to identify potential interacting proteins that might be involved in plant defense responses. We fused the full-length Hyd1 coding sequence to the Gal4 DNA binding domain to generate the bait vector for screening a B73 maize root cDNA library and identified an interaction with the maize protein ubiquilin 1-like (UBL). To further test the interaction between Hyd1 and UBL, we expressed Hyd1-GFP and UBL-GFP fusion proteins in N. benthamiana epidermal cells to examine their subcellular localizations. Hyd1-GFP and UBL-GFP decorated the perimeter of the cell, which could reflect plasma membrane localization (Figure 4C). Furthermore, we co-expressed Hyd1-GFP and UBL-GFP in rice protoplasts with a control plasma membrane protein, OsMCA1, tagged with red fluorescent protein (RFP). Both Hyd1 and UBL mainly localized to the plasma membrane of the rice protoplasts, as shown by their co-localization with the OsMCA1 plasma-membrane localized reporter (Figure 4D).
To further test the interaction, the coding sequence for full-length UBL was fused to the Gal4 activation domain (prey) and the coding sequences for Hyd1 was fused to the DNA binding domain (bait; Figure 5A). Bait and prey vectors were co-transformed into yeast and grown on SD/-Leu-Trp plates. Both the AD-T/BD-tumor suppressor protein P53 positive control set and the full-length UBL/Hyd1 set showed high α-galactosidase activity, indicative of interaction (Figure 5B). The interactions between Hyd1 and UBL were further validated via bimolecular fluorescence complementation (BiFC) assays in N. benthamiana epidermal cells in vivo. The YFP signal was restricted to the cell perimeter (Figure 5C).
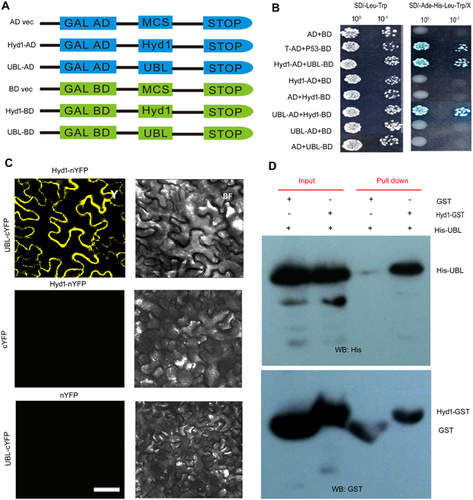
We next performed an in vitro pull-down assay using recombinant Hyd1 fused to a glutathione S-transferase protein (Hyd1-GST) and His-tagged UBL expressed in E. coli. In agreement with the Y2H and BiFC assays, Hyd1-GST, but not GST alone, was able to pull down UBL-His (Figure 5D). Together, these results demonstrate a direct interaction between Hyd1 and UBL both in vitro and in vivo.
Identification of the interacting domains of Hyd1 and UBL in yeast cells
Since Hyd1 physically interacts with UBL, we asked which protein domains played a major role in their interaction. To do this we performed another Y2H experiment with a bait construct expressing the Gal4 DNA binding domain fused to the sequence encoding full-length Hyd1 and a series of prey constructs expressing the Gal4 transcriptional activation domain fused to coding sequences for full-length UBL (UBL 576 aa), UBL-N (UBL △369-576 aa), or UBL-C (UBL △1-368 aa; Figure 6A). As expected, a positive control T fragment interacted with tumor suppressor protein P53, and Hyd1 strongly interacted with full-length UBL. Furthermore, the Y2H experiment revealed a strong interaction between Hyd1 and the N-terminal fragment of UBL (UBL △369-576), but only a weak interaction between Hyd1 and the C-terminal fragment of UBL (UBL △1-368; Figure 6B). TMpred (https://embnet.vital-it.ch/software/TMPRED_form.html) predicted that UBL contained three transmembrane regions (TMs). We thus divided UBL into different domains according to the TMs (Figure 6C). Our results demonstrated that Hyd1 mainly interacted with N-terminal region of UBL, specifically the N3 and N4 domains, which include TM2. When we deleted the C-terminal region including TM3 of UBL-C, the interaction disappeared (Figure 6D). These results indicate that the N-terminal region of UBL is primarily responsible for mediating the interaction with Hyd1, and that TM2 and TM3 of UBL are important for their interaction.
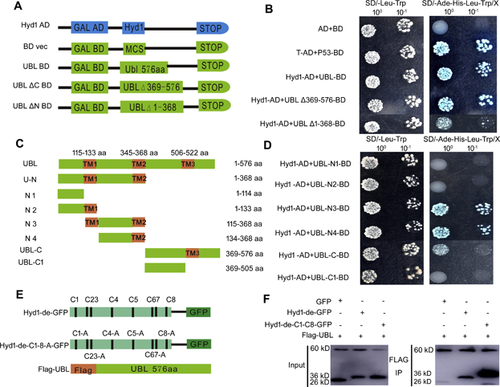
Hydrophobins contain a classical eight-cysteine motif in their protein sequences (Kwan et al. 2006; Bayry et al. 2012). Here, we mutated the respective cysteine residues, or all eight cysteine residues, of Hyd1 to alanine (Ala) and then performed Y2H once again and showed that the cysteine residues played an important role in the interaction of Hyd1 with UBL (Figure S4). In addition, we constructed Hyd1-de-GFP (Hyd1-de; Hyd1 lacking its signal peptide), Hyd1-de-C1-C8-GFP and Flag-UBL (Figure 6E), and co-expressed in the Hyd1 and UBL constructs in N. benthamiana epidermal cells. Co-immunoprecipitation assays proved that Flag-UBL interacted with Hyd1-de-GFP and Hyd1-de-C1-C8-A-GFP, but did not bind GFP alone (Figure 6F). The data suggest that deleting the signal peptide of Hyd1 did not affect its ability to bind UBL.
Functional characterization of hyd1 and ubl in plants
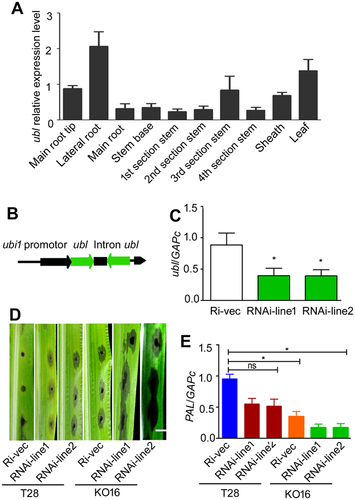
Having demonstrated that Hyd1 could induce plant pathogen resistance and interact with UBL, we wanted to know whether UBL plays a role in increasing plant resistance. First, we detected UBL mRNA expression patterns in different tissues of maize; ubl expression was highest in the lateral root and second in the leaf, which further demonstrated the possibility of the interactions between UBL and Hyd1 (Figure 7A). Then, we transiently silenced ubl by agroinfiltration with Ubl-N region frag to induce RNA interference (RNAi; Figure 7B). Upon successful silencing, the ubl expression level in two independent plant lines decreased remarkably (Figure 7C). Furthermore, the lesion areas in the RNAi-treated leaves of maize seedlings treated with T28 were larger than those treated with mutant KO16 48 h after inoculation with C. lunata, and the transcription of the defense gene PAL decreased (Figure 7D, E). This result demonstrates that ubl plays an important role in defense against C. lunata.
To test whether Hyd1 and UBL synergistically improved plant resistance, we optimized the hyd1 sequence to facilitate its expression in plants. A. thaliana lines overexpressing hyd1, ubl, or both were generated (Figure 8A). Reverse transcription quantitative PCR (RT-qPCR) showed that hyd1 expression was notably higher in two different lines than Col-0 (Wild type). Meanwhile, we ligated UBL-GFP into the PHB vector and introduced it into Col-0 (independent lines OE-U-GFP #1, OE-U-GFP #2) and OE-d1#12 (independent lines OE-U-GFP #5, OE-U-GFP #9). RT-qPCR analysis showed that the expression of ubl was high in A. thaliana leaves, including in the OE-d1#12 line (Figure 8B). We observed a clear increase in PATHOGENESIS-RELATED 1 (PR1) and MAMP-induced receptor kinase (FRK1) expression in OE-d1#12 and OE-U1-GFP#2. The transcript levels of both genes were also high in line 5 (OE-d1#12(OE-U1-GFP) #5), which co-expressed hyd1 and ubl (Figure 8C). Thus, at the molecular level, the combination of Hyd1 and UBL increased the plant resistance response.
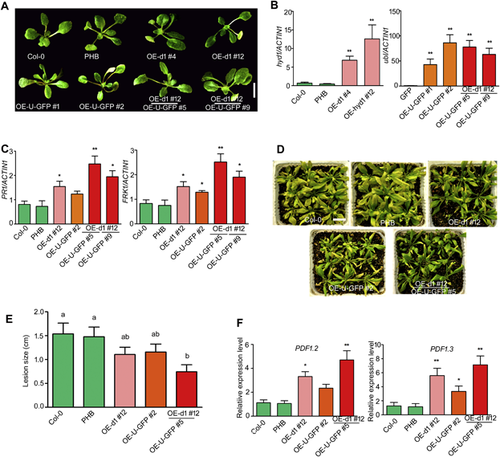
Since Hyd1 could work together with UBL to increase A. thaliana immunity, we asked whether the two proteins increased the spectrum of pathogen resistance. We challenged OE-d1#12, OE-U1-GFP#2, and OE-d1#12[OE-U1-GFP]#5 A. thaliana plants expressing the null vector PHB, and wild-type plants by spraying with a conidial suspension of B. cinerea. As shown in Figure 8D and E, the disease symptoms of OE-d1#12 and OE-U1-GFP#2 were less severe than those of the control PHB and wild-type plants. The disease symptoms in the transgenic line co-expressing Hyd1 and UBL were restricted to the top part of the leaves, without any noticeable spread of the disease symptoms. The expression levels of the defense genes PDF1.2 and PDF1.3 corresponded with disease symptoms in the transgenic lines (Figure 8F). These data strengthen our conclusion that Hyd1 induction of plant resistance requires the presence of UBL, as the two proteins act synergistically to increase biotic disease resistance.
The differential transcriptional program of maize leaves associated with hyd1 in response to C. lunata
To reveal how hyd1 induces resistance in maize leaves against C. lunata, we performed transcriptome analysis of maize leaves in four treatments as described in the materials and methods section. Hierarchical clustering analysis grouped the 2,194 differentially expressed (DE) genes into six clusters according to their expression patterns. Cluster I and II may be closely associated with hyd1. These genes were significantly upregulated in wild-type T. harzianum in response to C. lunata, but were underexpressed in hyd1-disrupted strains. As shown by the Venn diagram, 3.8% (83 of 2,173) of DE genes were shared between KO16 + CX-3 versus C + CX-3 and T28 + CX-3 versus C + CX-3, and 2.5% (54 of 2,173) of DE genes could be attributed to hyd1 by comparing KO16 + CX-3 and T28 + CX-3 (Figure 9B). These 54 DE genes (Table S1) indicated that significant changes in gene expression in response to C. lunata were caused by the deletion of hyd1 (FDR ≤ 0.05 and log2 fold change ≥ 1). Functional annotation of putative gene products indicated that disruption of hyd1 affected multiple processes including signal transduction, transcription, cell wall-related components and stress responses, to name a few. Based on the properties of hyd1-induced maize systemic resistance, we focused on genes involved in hormone signal transduction. A total of nine genes were selected for RT-qPCR analysis, including three brassinosteroid (BR)-related genes, three JA-related genes and three ET-related genes, which are elicited in response to the plant systemic resistance and their expression levels were in accordance with the transcriptomic data (Figure 9C). Furthermore, the heat map of BR pathway-related gene expression suggested that the signaling induced by hyd1 was probably closely associated with BR signaling (Figure S5). Many reports have demonstrated that BR and JA/ET signaling are related to pathogen infection (Ton et al. 2002; Ali et al. 2013; Yang et al. 2013; Zhang et al. 2013).
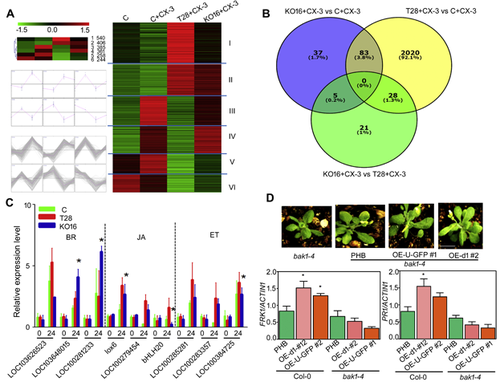
BAK1 (also known as SERK3) is necessary to perceive elicitors, including flagellin and EF-Tu, and it acts as a co-receptor, along with BRI1, to initiate the BR signaling cascade (Mussig and Altmann 2001; Albrecht et al. 2012). We introduced hyd1 and ubl into the BAK1 mutant bak1-4. In comparison with Col-0, the expression of PR1 and FRK1 (Figure 9D), and the defense genes PDF1.2 and PDF1.3, were decreased in the bak1-4 mutant (Figure S6). This result indicated that hyd1 induced maize systemic resistance probably though BAK1.
DISCUSSION
Maize is susceptible to a variety of pathogen infections throughout its development, including soil-borne diseases and foliar diseases. At present, application of Trichoderma biofungicide is a potential way to control foliar diseases by inducing systemic resistance (Lorito et al. 2010; Druzhinina et al. 2011; Mukherjee et al. 2013). Djonovic et al. (2006 and 2007) demonstrated that maize root colonization by T. virens induces systemic protection against a foliar pathogen, Colletotrichum graminicola, and that a small secreted cysteine-rich protein plays an important role in the maize–fungus interaction. Furthermore, the hydrophobin proteins of the biocontrol fungus C. rosea are associated with defense response of A. thaliana (Dubey et al. 2014). Another class II hydrophobin HYTLO1 enhanced tomato systemic resistance, resulting in reduced lesions upon challenge of leaves with B. cinerea (Ruocco et al. 2015).
Although some studies have focused on Trichoderma-induced resistance to pathogens, little is known about how the plant roots perceive the colonization of Trichoderma and elicit systemic resistance against pathogen attack (Harman et al. 2004). Here, we examined at the molecular level how small secreted cysteine-rich proteins induce resistance in the plant, demonstrating that a member of the hydrophobin family plays roles in Trichoderma-ISR, and identifying UBL as the target of Trichoderma hydrophobin binding in maize roots. Signaling by MAMPs has been widely recognized as a typical model of plant immunity and plant resistance induced by Trichoderma fits this pattern. Effective Trichoderma strains generate a variety of elicitors, and MAMPs have been described between plant and beneficial fungi (Lorito et al. 2010; Hermosa et al. 2012). In our study, we established that T. harzianum Hyd1 could act as a MAMP recognized by plants and trigger systemic immunity to a foliar pathogen in maize. We also asked whether other class II hydrophobins generate ISR in maize and learned that another class II hydrophobin, Hyd2, had little ISR function (Figure S7). More importantly, we did not identify any interactors of Hyd2 in maize roots by yeast two-hybrid screening. Based on these results, we speculate that the hydrophobin Hyd1 plays the major role in eliciting host plant resistance.
Plants have developed many mechanisms to protect themselves from viral, bacterial, oomycete and fungal infections. The above immune responses initiate upon the perception of the invading pathogen by pattern recognition receptors (PRRs), which can communicate with PAMPs or MAMPs (Segonzac and Zipfel 2011; Macho and Zipfel 2014). Here, to identify interaction targets of Hyd1 in root tissues, we screened cDNA libraries of B73 maize roots by Y2H, which yielded 13 candidate clones (Table S2). Among these clones, five encoded the UBL protein and contains transmembrane domain, it is likely to be the bona fide binding target of Hyd1 in maize roots responsible for triggering plant defense responses. Thus, we define UBL as a Hyd1 target protein that influences plant immunity. Ubiquilin 1, known as PLIC1 in mammals, is part of a family of evolutionarily conserved proteins containing ubiquitin-like and ubiquitin-associated domains that shuttle proteins to the proteasome. Notably, the above domain proteins function as inhibitors of proteasomal degradation when overexpressed (Heese et al. 2007; Balmer et al. 2015). In addition, overexpression of Dsk2 in yeast cells affects the cell cycle and causes cell death (Matiuhin et al. 2008). DSK2 (UBL and DSK2b proteins reached 99% homology at amino acid sequence level in maize) also plays an important role in plant growth and survival in A. thaliana. The drought resistance of a DSK2 RNAi line decreased substantially and this stress response phenotype was similar with accumulation of UBL in maize increased its resistance against pathogen (Nolan et al. 2017). Intriguingly, Hyd1 promoted the accumulation of UBL and caused cell death in maize and tomato (Figure S8). The data further demonstrated that Hyd1 induced plant systemic resistance through UBL, triggering signal transduction.
The signaling pathways involved in Trichoderma-induced systemic resistance have been of major interest (Shoresh and Harman 2008; Perazzolli et al. 2012; Lamdan et al. 2015). To determine which plant signaling pathways were activated by Hyd1 during ISR, we analyzed the maize leaf global transcriptome in response to knocking out hyd1 and observed that LOC103626523 (phytosulfokine receptor 1) was downregulated, and LOC103648015 and LOC100281233 (BRASSINOSTEROID INSENSITIVE 1-associated receptor kinase 1) were upregulated in response to disruption of hyd1. Phytosulfokine receptor 1 interacts with BRI-associated receptor kinase 1 (BAK1), which regulates Arabidopsis growth, and phytosulfokine attenuates plant stress responses (Motose et al. 2009; Ladwig et al. 2015). The markedly higher expression of BR signaling pathway genes and JA/ET pathway genes in the leaves of maize treated with hyd1-knockout T. harzianum and exposed to the foliar pathogen C. lunata suggested that hyd1 might be associated with BR and JA/ET signaling. BR signaling, especially the versatile BAK1, plays an important role in plant innate immunity by regulating pattern-elicited immunity and other vital defense responses (Chinchilla et al. 2009; Yeh et al. 2016).
We analyzed the expression of FRK1 as a representative fungal MAMP because upon bacterial PAMP flg22 elicitation, flagellin sensing receptor (FLS2) physically associates with another receptor kinase termed BAK1 and promotes PTI responses (Chinchilla et al. 2007; Heese et al. 2007). In accordance with hyd1 inducing maize systemic resistance through BAK1, PR1 and FRK1 expression were lower in the bak1-4 mutant compared to Col-0, as was that of the defense genes PDF1.2 and PDF1.3. These data suggest that Hyd1 is perceived by and triggers systemic resistance through the BR and JA/ET pathways in maize. The induction of plant responses by Trichoderma is a time- and concentration-dependent phenomenon. Since the temporal phases of hormone signaling underpin the establishment of systemic immunity, an undulated SAR-ISR response is activated in the plant and mRNA regulation explains only about 40% of the changes in protein abundance (Balmer et al. 2015). Here, we used RNA-seq to study Hyd1-induced signal transduction. For a more comprehensive understanding of priming signaling, ‘prime-omics’ will be introduced in the future of Trichoderma–plant interaction research.
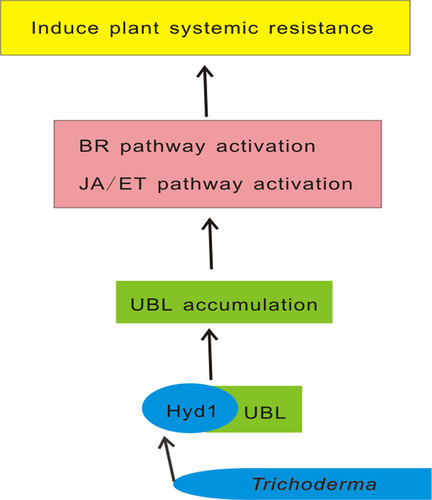
In summary, T. harzianum colonizes maize roots and secretes Hyd1. Hyd1 could bind with the maize target protein UBL. This interaction will recruit more UBL proteins in maize roots to elicit plant defense responses, including cell death and BR and JA/ET signaling (Figure 10). Our findings suggest that the Hyd1-UBL axis might play a vital role in Trichoderma induction of plant resistance. Manipulation of Hyd1 and UBL could be useful to improve Trichoderma biocontrol abilities.
MATERIALS AND METHODS
Plasmid construction and strains
The oligonucleotides for plasmid construction and the related primers were displayed in the Table S3. The hyd1 gene (KT258897) was amplified with cDNA of Trichoderma harziarum T28 (CCTCC AF 2013026). For disruption and overexpression hyd1 assay, the homologous recombination cassette with 1 kb 5’ and 3’ flanking sequence and the overexpression hyd1-his tag cassette were constructed respectively as described by (Yu et al. 2014). Similarly, for disruption hyd2, the homologous recombination cassette with 1 kb 5’ and 3’ flanking sequence was also cloned to construct the homologous recombination plasmid. To check localization of hyd1 in Trichoderma, 2 kb promoter of hyd1, hyd1 and DsRed were ligated by overlap PCR with PrimeSTAR (code: R045A; TaKaRa, Kyoto, Japan) and the Phyd1: DsRed and Pgpd: DsRed two positive control vectors were also constructed. All plasmids were checked by sequencing in Biosune, Inc. (Shanghai, China).
Detection of disease index and Hyd1 expression in maize
B73 seeds were immersed in 1% sodium CMCase solution as the Control group (C) and other groups were immersed in 1% sodium CMCase solution with 1 × 10⁶ conidia/mL of the different Trichoderma conidia. The maize seeds grew in the greenhouse until the four- to five-leaf stage. The detached leaves were all from the second leaf position in different treated maize seedlings. These detached leaves were inoculated with 4 × 10⁴ spores suspension of C. lunata and incubated on two layers of filter papers moisturized with 40 mg/L 6-Benzyladenine (6-BA) in Petri dishes at 28°C. After 3 d, the disease index (DI) was evaluated with a visual assessment scale as previously described by (Djonovic et al. 2007). The OE-hyd1-his tag Trichoderma strain treated maize roots fixed in 0.1 M phosphate buffer containing 2.5% glutaraldehyde, washed, dehydrated with ascending concentrations of ethanol, incubated in 1% OsO4 for 2 h at room temperature, and then embedded in Epon812 media (Polysciences, Inc., Germany). Thin sections were cut with a Leica Ultracut UC6 ultramicrotome, picked up on carbon coated nickel grids, then incubated with 50-fold dilution of Anti-6X His tag (code: ab9108; Abcam, UK) at room temperature for 2 h. After washing with 0.01M PBS 3 times, nickel grids were incubated with 30-fold diluted second immunogold labeling antibody (code: M11420; Bellancom, USA), and then washed again three to five times with PBS. Then Grids stained with uranyl acetate and Reynold's lead citrate and finally observed by the JEOL 1010 transmission electron microscope. Immunofluorescent analysis of Hyd1 expression in OE-hyd1-his tag strain treated maize roots. First, we generated maize roots freezing section, then blocked for 1 h at room temperature. After washing sections three times with PBS and incubated the above His primary antibody (1:300) at 4°C over nigh and visualized using Rabbit anti-Goat IgG (H+L) Superclonal™ Secondary Antibody, Alexa Fluor® 488 conjugate (Product # A27012 Thermo Fisher, USA) (1:1,000). Second, the sections suspended in a dye solution containing 10 mmol/L FM4-64 (Product #T13320 Thermo Fisher, USA) for 2 min washed three times. Lastly, they were observed under 488 and 594 nm laser by confocal microscope (Leica TCS SP5II), respectively.
Yeast two-hybrid screening and confirmation
Hyd1 interacting proteins were screened according to the manufacturer's instructions (Clontech). Briefly, B73 maize seedling cultured in tissue-culture container until three leaves stage and inoculated with the OE-hyd1-3 strain on the agar near the maize roots, and grown for 4 d. Finally, libraries were constructed with mRNA from the roots at the time 24 hpi after spraying the maize leave with 2 × 10⁵/mL C. lunata spores. The hyd1 open reading frame cloned into the pGBKT7 BD vector to generate Hyd1-BD. Screening was performed on SD/-Ade-Leu-His-Trp medium. The full-length ubiquilin1-like (ubl, (KX911884) cDNA sequence was obtained using the 5’ race kit (code: D315; TaKaRa, Kyoto, Japan)). To verify positive interactions, full-length ubiquilin1-like (UBL 576 aa), ubiquilin1-like-N (UBL △286-576 aa) and ubiquilin1-like-C (UBL △1-285 aa) were cloned into the pGBKT7 BD vector, then cotransformed with pGADT7 AD Hyd1. A series of mutants in the cysteines of Hyd1 were constructed with a site-directed mutagenesis kit (no. E0554S; New England Biolabs) or Hyd1-de (deletion signal peptide). Y2H Gold Competent yeast cells were cotransformed with 100 ng of each vector pair. To test for complementation of auxotrophy the yeast cells inoculated at ×1 and 10-fold dilution and grown at 30°C for 4 d on SD/-Leu/-Trp and SD/-Ade/-His/-Leu/-Trp/x-α-gal medium.
Subcellular localization in plant and RNAi ubiquilin1-like in maize
Plasmids PHB-GFP, PHB-hyd1-GFP, PHB-ubiquilin1-like-GFP, pTKC-303 and pTKC-303-ubiquilin1-like were introduced into A. tumefaciens strain GV3101 and selected on LA plates with rifamycin (25 μg/mL), kanamycin (50 μg/mL) and spectinomycin (50 μg/mL). The positive strains were grown in LB with the above antibiotics, harvested, and washed with MS medium three times, then resuspended in MS medium (containing pH 5.7 10 mmol/L MES and 200 μM AS) to achieve a final OD600 of 0.5 following growth in the dark at room temperature for 3 h. To infiltrate into N. benthamiana and maize leaves, a syringe without a needle used to infiltrate 100 μL of A. tumefaciens cell suspension into leaves (Rodriguez et al. 2014). Then, it was observed by confocal microscopy (Leica TCS SP5II) after 40 to 48 h and the proteins were extracted with NP40 buffer (no. P0013F; Beyotime, Jiangsu, China) in the presence of 0.1 mmol/L protease inhibitor PMSF (no. ST506; Beyotime). For RNAi assay, pTKC-303, pTKC-303-UBL that with an antisense and sense construct in which 300 bp of the UBL-N region was inserted in an inverse orientation and P19 were introduced into A. tumefaciens strain GV3101 respectively and the two strains were infiltrated by the above method into B73 maize leaves and grown for 2 d (Jin and Guo 2015; Krenek et al. 2015). The photographs were taken at 48 h for inoculating C. lunata. Every experiment repeated three times and each assay consisted of at least four plants inoculated on three leaves.
Fluorescence
For in vivo fluorescence analysis, a knockout hyd1 (KO16) transformant expressing hyd1 C-terminally fused with DsRed under its own 2 kb promoter and two positive control vectors were constructed. Microscopic pictures were taken by a Leica DM2500 fluorescent microscope with emission at 560–615 nm. Micrographs observed at 1,000× magnification. Green fluorescent protein fluorescence in rice protoplasts and N. benthamiana leaves captured with an excitation wavelength of 488 nm and an emission wavelength of 505–530 nm using confocal microscopy (Leica TCS SP5II). The membrane protein of PHyd1:DsRed and PHyd1: Hyd1:DsRed were extracted by Mem-PER™ Plus Membrane Protein Extraction Kit (Product # 89842 Thermo Fisher, USA) and then were separated by SDS-PAGE and lastly were detected with the Monoclonal Anti-RFP antibody (no. SAB2702202; SIGMA, USA).
BiFC Assays and pull down
Full-length ubiquilin1-like encoding sequences were inserted into pEarleyagte201-YN to generate a C-terminal in-frame fusion with cYFP, hyd1-encoding sequences were introduced into pEarleyagte201-YN to form an N-terminal in-frame fusion with nYFP by gateway technology as described by (Earley et al. 2006; Lu et al. 2010). The resulting plasmids were introduced into A. tumefaciens (strain GV3101) and infiltrated into N. benthamiana epidermal cells with the same procedure described above for subcellular localization. Infected leaves were analyzed 48 h after infiltration. YFP and fluorescence observed by a confocal microscopy (Leica TCS SP5II). For GST pull-down assays, purification of UBL was performed with HisTrap FF prepacked mini-columns (GE Healthcare Life Sciences, Uppsala, Sweden), according to (Yu et al. 2014). GST fusion proteins were expressed in Escherichia coli strain BL21(DE3) host strains carrying pGEX-4T-1 (Novagen) or pGEX-hyd1 vector and cell extract was incubated with glutathione Sepharose beads (GE Healthcare) and GST fusion protein were purified according to (Qiu et al. 2015) with minor modifications. UBL protein supplemented with 0.05% Tween 20 and incubated with the affinity-purified GST fusion protein immobilized on the beads at 4°C for 10 h. The beads with the immobilized GST fusion proteins washed four times with PBS supplemented with 0.05% Tween 20. The eluted proteins boiled with loading buffer and loading to 12% SDS-PAGE for analysis. Immunoprecipitated prey proteins were detected by immunoblots using mouse anti-His polyclonal antibodies (code: AB18184; Abcam). The GST fusion proteins used in each pull-down assay were checked by immunoblots using mouse anti-GST polyclonal antibodies (code: M20007; Abmart).
Botrytis cinerea inoculations
The inoculation of pathogen performed with slight modifications as described (Gao et al. 2011). B. cinerea cultured on PDA plates for 10 d at 24°C. The sterile water was used to wash the plate twice and to remove mycelia from the suspension by the 4 layer sterile cloths. 24-d-old A. thaliana were spray inoculated with 3 × 10⁵/mL spores suspension and maintained under high humidity. After 5 d infections, disease symptoms of the plants were assessed statistically by calculating the length of lesion sizes. The presented data repeated two independent replicates.
RNA-seq analysis
We set up four treatments: one that inbred line B73 maize seeds immersed in 1% sodium CMCase solution and grew in green house until four- to five-leaf stage-old (about one month) as control (C), which is background. The other maize treatments in the below: C + CX-3 (control maize inoculated pathogen), T28 + CX-3 (T28 treated maize inoculated pathogen) and KO16 + CX-3 (KO16 treated maize inoculated pathogen) inoculated with 2 × 10⁵ spore suspensions of C. lunata for 24 h and the leaves total RNA including the leaves of the background control (C) were isolated by TRIzol Reagent. The subsequent RNA quality control steps and library construction were performed by 1 Gene (Hangzhou, Zhejiang, China). Then, the tags were Paired-End sequenced using Illumina HiSeqTM 4000. The raw reads were then cleaned by removing the low-quality reads and/or adaptor sequences and the clean reads with high-quality sequences were mapped to reference sequences (Zea mays B73) and/or the reference gene set using SOAPaligner/SOAP2 (Li et al. 2009). The gene expression level calculated using the reads per kilobase per million reads method (Mortazavi et al. 2008). DE genes identified by the R package DESeq (Anders and Huber 2010; Bullard et al. 2010), with false discovery rate (FDR ≤ 0.05) in at least one pairwise comparison: KO16 + CX-3 vs C + CX-3, T28 + CX-3 vs C + CX-3 and KO16 + CX-3 vs T28 + CX-3. The hierarchical method in T-MeV 4.9 and Cluster 3.0 were used for gene expression patterns cluster analysis.
Real-time quantitative PCR (RT-qPCR) assay
Total RNA of Trichoderma and plant tissues were extracted by the TRIzol Reagent. The cDNA was synthesized from 1 μg RNA using the PrimeScript RT Reagent kit with gDNA Eraser (code: DRR047A; Takara, Japan). Real-time quantitative PCR was carried out using a SuperReal PreMix (SYBR Green) kit (code: FP205; TIANGEN, China) with 100-fold diluted cDNA as template. The PCR conditions were as follows: 95°C for 300 s for initial denaturation and 40 cycles each consisting of 95°C for 20 s, 58°C for 30 s, and 72°C for 20 s. A Light Cycler 96 Real-Time PCR System (Roch, USA) performed according to the manufacturer's instructions. Actin gene in Trichoderma and GAPc (glycerol phosphate dehydrogenase, cytosolic form) gene in maize as the reference internal control for analyzing qRT-PCR, respectively. Relative expression level calculated by the 2-ΔΔCT method and the qPCR primer sets in this study are presented in Table S4.
Statistical analysis of data
All experiments performed in independent biological triplicates. Data were analyzed statistically by SAS 8.0 software (significance indicated by P ≤ 0.05). Graphs were prepared with GraphPad Prism 5.
ACKNOWLEDGEMENTS
We thank Professor Hongquan Yang (Fudan University) for kindly providing the plasmid vector PHB and wild type Col-0 seeds, especially thank post Dr. Feng Xu giving the information about introducing gene into A. thaliana. We thank Professor Huamin Chen (Chinese Academy of Agricultural Sciences) for kindly providing bak1-4 mutant seeds. We thank 1gene, Hangzhou for RNA sequencing of the maize leaves. We also thank Dr. Jianhua Yue (Shanghai Jiao Tong University) for giving suggestions to improve the quality of some Figures. The work was supported by the grant from National Key Projects of I Intergovernmental Cooperation in Scientific and Technological Innovation (2017YFE0104900), the National Natural Science Foundation of China (31872015, 31672072), National Key Research and Development Program of China (2017YFD0200901), Agriculture Research System of Shanghai (Grant No. 201710), China Agriculture Research System Project (CARS-02).
AUTHOR CONTRIBUTIONS
C. Y. and J.C. designed the experiments; C. Y. performed most of experiments and analyzed the data; other authors assisted in experiments and discussed the results; C. Y. and J. C. wrote the manuscript; all authors read and approved the manuscript.


