Comparative Proteomic Analysis of Rice Shoots Exposed to High Arsenate
Abstract
Consumption of arsenic contaminated water and cereals is a serious threat to humans all over the world. Rice (Oryza sativa “Nipponbare”), as a main cereal crop, can accumulate arsenic more than 10-fold that of in other cereals. To gain a comprehensive understanding of the response of rice subjected to 100 µM arsenate stress, a comparative proteomic analysis of rice shoots in combination with morphological and biochemical investigations have been performed in this study. The results demonstrated that arsenate suppressed the growth of rice seedlings, destroyed the cellular ultra-structure and changed the homeostasis of reactive oxygen species. Moreover, a total of 38 differentially displayed proteins, which were mainly involved in metabolism, redox and protein-metabolism, were identified. The data suggest the arsenic can inhibit rice growth through negatively affecting chloroplast structure and photosynthesis. In addition, upregulation of the proteins involved in redox and protein metabolism might help the rice to be resistant or tolerant to arsenic toxicity. In general, this study improves our understanding about the rice arsenic responsive mechanism.
Introduction
Arsenic, a ubiquitous and non-essential carcinogenic metalloid, has recently attracted worldwide attention because of its chronic and epidemic effects on human and animal health (Shaibur and Kawai 2009; Garg and Singla 2011). Arsenic is introduced into the water/soil environment by natural processes (including volcanic eruption, the weathering of rocks and minerals, and fossil fuel), and anthropogenic activities (such as metal mining and smelting, wood preservation, agricultural chemicals, industry effluents and phosphate fertilizer), with a high arsenic level found mainly in India, Bangladesh and China (Akter et al. 2005). Excess arsenic accumulation in soil not only harms the physio-chemical properties of soils and reduces soil fertility and crop yield but also poses a serious threat to human health as a result of the consumption of grains contaminated by arsenic (Smith et al. 2010; Garg and Singla 2011). It is estimated that about 90 million people worldwide are at risk of arsenic toxicity, with more than two million of these being in China (Nordstrom 2002; Wei et al. 2007). In the last decade, many studies have been conducted to explore the mechanisms underlying the plant response to arsenic and other heavy metals (Yang et al. 2005; Zhang et al. 2006). Besides contaminating drinking water, arsenic can also accumulate in rice grains due to highly efficient shoot assimilation and transportation, which results in accumulation levels approximately 10-fold higher than in other cereal grains (Williams et al. 2007; Meharg et al. 2009; Tuli et al. 2010). Thus, in order to reduce arsenic accumulation in rice grains and shoots, it is very important to understand the absorption, translocation and distribution mechanisms of arsenic in rice.
Although studies on rice abiotic stress responses have been extensively carried out (Gao et al. 2007), there are very few focusing on the arsenic response. In the last decade, numerous morphological, physiological and biochemical analyses have been conducted to investigate the responsive behavior of rice to arsenic (Marin et al. 1993; Abedin and Meharg 2002; Ahsan et al. 2008; Azad et al. 2009; Shri et al. 2009; Wang et al. 2010). Excess arsenic can cause oxidative stress (Ahsan et al. 2008; Shri et al. 2009), which may inhibit seed germination (Abedin and Meharg 2002; Shri et al. 2009), interfere with photosynthesis (Marin et al. 1993), suppress growth, and eventually reduce grain yield in rice (Azad et al. 2009; Wang et al. 2010). The mechanisms of arsenic uptake, translocation, extrusion, distribution and compartmentalization in rice have also been studied (Abedin et al. 2002; Meharg and Jardine 2003; Ali et al. 2009; Duan et al. 2007; Williams et al. 2007; Xu et al. 2008; Zhao et al. 2009). Previous studies have given us some insights into rice responses to arsenic stress. However, these studies cannot provide a comprehensive understanding on the molecular mechanisms of the arsenic toxicity response in rice. Recently, two transcriptomic studies on rice under arsenic stress were performed (Norton et al. 2008; Chakrabarty et al. 2009). Studies of the non-coding miRNAs were also conducted on rice exposed to arsenite and arsenate (Tuli et al. 2010). It is well known that proteins are the direct player for most of the physiological and biochemical processes, so research at the protein level is critical to obtain more valuable information. Proteomic analysis, including identification and characterization of expressed proteins, has been widely used to study the heavy metal stress response in rice (Sheoran et al. 2005; Agrawal et al. 2009; Ahsan et al. 2009), and proves that it is powerful. Recently, Ahsan et al. (2008) conducted a proteomic analysis on arsenic-stressed rice roots. However, studies on the other tissues of rice, such as the shoot and the leaf, have not been conducted. As mentioned above, high arsenic stress has negative effects on whole plant growth, which indicates that there are coordinated responses among different tissues. Moreover, the aerial tissues are necessary for the transportation of arsenic from roots to grains. Therefore, it is necessary to conduct a proteomic study on shoots.
In this study, we conducted a comparative proteomic analysis of rice shoots at different times after arsenate treatment. The effects of arsenic on the ultra-structure and biochemical process of the shoot were also analyzed. The results presented here will provide some new insights into the understanding of the arsenate stress response in rice.
Results and Discussion
Effects of arsenic on the growth of rice seedlings
Baseline concentration of arsenic in soil is about 5–10 mg/kg (Smedley and Kinniburgh 2002). However, the concentration may be more than 200 µM in arsenic-contaminated soils (Akter et al. 2005). Therefore, we chose concentrations of 100 and 200 µM to conduct the treatment. Compared with that of the control, growth of rice seedlings exposed to arsenic was inhibited. The elongation of both root and shoot was reduced in an arsenic dose-dependent manner (Figure 1A,B). These results were consistent with previous data (Abedin et al. 2002; Ahsan et al. 2008; Shri et al. 2009). In addition, we also observed that there were fewer branch roots in the arsenate-treated seedlings (Figure 1C). Compared with the 100 µM arsenate treatment, 200 µM of arsenate treatment can induce more serious symptoms in root tips, such as yellow-brown spots and sparse root hairs (Figure 1C). However, there were no visible symptoms in the leaves. Based on previous reports (Carbonell-Barrachina et al. 1995; Shaibur et al. 2006, 2008a, 2008b, 2009), a high concentration of arsenate stress will damage the root structure before the arsenic can be transported upwards to the aerial tissues. We then measured the accumulation of arsenic in both the root and the shoot. Without arsenate treatment, there is hardly any detectable arsenic (Figure 2). With an increase in arsenate concentration, more and more arsenic could be detected (Figure 2). Under 200 µM arsenate stress, roughly 1,000 and 28 μg/g of total arsenic could be detected in roots and shoots, respectively, whereas the concentration in roots under 100 µM arsenate stress was less than half of that. Transmission electronic microscopy (TEM) observation showed that 200 µM arsenate treatment seriously impaired root meristematic cellular structure, while there was no obvious ultra-structural injury under 100 µM arsenate conditions (Figure 3A–C). Therefore, we chose the 100 µM arsenate treatment for further proteomic analysis.

(A) Increment of shoots.
(B) Images of rice seedlings.
(C) Visible symptoms on root tips. Samples from 0, 100, and 200 µM of arsenate treatments were indicated as I, II, and III, respectively. Data are means of three replicates ± SD (P < 0.05).

Left panel is the data for roots and right panel is the data for shoots. Rice was exposed to 0, 100, and 200 µM arsenate for 5 d, respectively. The data are means of three replicates ± SD. Data labeled with different letters indicate a significant difference. The difference between a and b is significant with P < 0.05, and that between a and c is P < 0.01.

(A), (B), and (C) Images from the roots of rice seedlings exposed to 0, 100 and 200 µM arsenate stress.
(D), (E), and (F) Images from the leaves of rice seedlings exposed to 0, 100, and 200 µM arsenate stress. CM, chloroplast membrane; CW, cell wall; G, grana; MM, mitochondria membrane; NM, nuclear membrane; VM, vacuole membrane.
Proteome profiling of the shoots from rice seedlings subjected to arsenate treatment
Previously, Ahsan et al. (2008) conducted a proteomic analysis on the root of rice under arsenate stress. As mentioned above, the arsenic can be transported into the shoot, and inhibit shoot growth. To explore how this happens, we conducted a comparative proteomic analysis on the shoots of rice seedlings under 100 µM arsenate stress. Generally, about 660 protein spots could be reproducibly detected in triplicate experiments (Figure 4A). Among them, 38 were differentially displayed (>1.5-fold changes in abundance) during the arsenate stress treatment. Of the 38 protein spots, 12 (32%) were upregulated and 26 (68%) were downregulated in response to arsenate treatments (Table 1). Some proteins changed within 1 d, others changed only after 5 d of arsenate treatment. To know how these changes trigger the inhibition of shoot growth, the differentially expressed protein should be identified first.

(A) Typical 2-D gel image of rice shoots.
(B) Functional categorization of differentially expressed proteins. The x-axis indicates protein number.
| Spot ID | Accession no. | Description | MW (Da) | pI | Score | SC (%) | Biological function | Fold change (0–24 h–72 h–120 h) |
|---|---|---|---|---|---|---|---|---|
| 1 | NP_001042368 | Os01g0210500 | 23753 | 4.73 | 129 | 32 | Unknown | 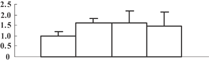 |
| Soul heme-binding protein | ||||||||
| 2 | NP_001047050 | Os02g0537700 | 28307 | 5.67 | 94 | 12 | Redox regulation | 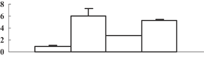 |
| Peroxiredoxin (pRX) family, typical 2-Cys peroxiredoxin (pRX) subfamily | ||||||||
| 3 | NP_001061856 | Os08g0430500 | 28979 | 4.78 | 77 | 9 | Signaling | 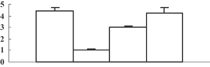 |
| 14-3-3 domain | ||||||||
| 4 | EAZ23422 | Hypothetical protein OsJ_07113 | 43582 | 4.79 | 162 | 18 | Redox regulation | 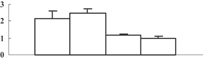 |
| Ascorbate peroxidases and cytochrome c peroxidases | ||||||||
| 5 | EAZ23422 | Hypothetical protein OsJ_07113 | 43582 | 4.79 | 306 | 26 | Redox regulation | 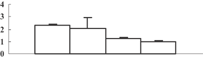 |
| Ascorbate peroxidases and cytochrome c peroxidases | ||||||||
| 6 | EEC73386 | Hypothetical protein OsI_07630 | 49356 | 5.36 | 86 | 17 | Redox regulation | 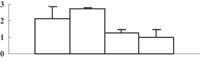 |
| Heme-dependent peroxidases similar to plant peroxidase | ||||||||
| 7 | NP_001066567 | Os12g0277500 | 61150 | 5.12 | 282 | 22 | Protein folding | 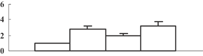 |
| GroEL-like type 1 chaperonin | ||||||||
| 8 | EAZ02369 | Hypothetical protein OsI_24473 | 95423 | 4.89 | 159 | 14 | Stress abiotic | 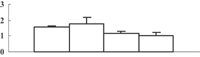 |
| Histidine kinase-like ATPases | ||||||||
| 9 | EAZ45481 | Hypothetical protein OsJ_30136 | 26279 | 8.78 | 182 | 22 | PS calvin cycle | 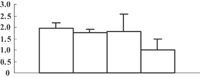 |
| Triosephosphate isomerase | ||||||||
| 10 | NP_001061319 | Os08g0237000 | 32304 | 5.31 | 174 | 32 | Cell wall modification | 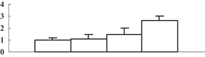 |
| Probable xyloglucan endotransglucosylase/hydrolase protein | ||||||||
| 11 | 2002393A | Oxygen-evolving complex protein 1 | 26603 | 5.13 | 279 | 31 | PS light reaction | 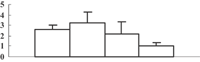 |
| 12 | NP_001056601 | Os06g0114000 | 64331 | 5.60 | 451 | 26 | Protein folding | 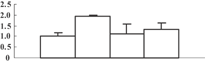 |
| GroEL-like type 1 chaperonin | ||||||||
| 13 | CAD40968 | OSJNBa0027P08.10 | 16673 | 9.37 | 89 | 13 | Unknown | 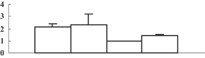 |
| Protein of unknown function (DUF861) | ||||||||
| 14 | NP_001054133 | Os04g0659100 | 46956 | 5.96 | 283 | 16 | Amino acid metabolism | 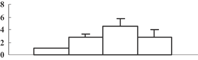 |
| Glutamine synthetase | ||||||||
| 15 | NP_001049769 | Os03g0285700 | 27253 | 5.42 | 256 | 44 | Redox regulation | 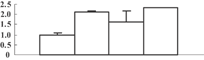 |
| Ascorbate peroxidases and cytochrome c peroxidases | ||||||||
| 16 | NP_001052419 | Os04g0306400 | 28727 | 5.46 | 185 | 21 | PS calvin cycle | 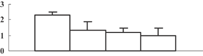 |
| Ribose-5-phosphate isomerase type A subfamily | OPP non-reductive PP | |||||||
| 17 | XP_002460637 | Eukaryotic UGPase catalyses the synthesis of UDP-glucose | 50658 | 5.37 | 409 | 31 | Glycolysis |  |
| 18 | BAC82948 | Immunophilin/FKBP-type peptidyl-prolyl cis–trans isomerase-like protein | 28386 | 8.87 | 162 | 27 | Protein folding | 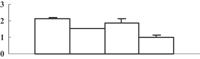 |
| 19 | ABY52939 | Chloroplast 23 kDa polypeptide of photosystem II | 20074 | 5.56 | 125 | 22 | PS light reaction | 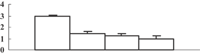 |
| 20 | NP_001055113 | Os05g0295800 | 21373 | 5.84 | 214 | 54 | Amino acid metabolism degradation | 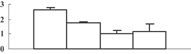 |
| Glyoxalase I | ||||||||
| 21 | BAA02730 | Chloroplastic aldolase | 42350 | 7.60 | 57 | 5 | PS calvin cycle | 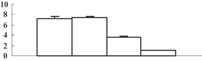 |
| 22 | Q5Z5A8 | Photosystem II stability/assembly factor HCF136 | 45498 | 9.02 | 147 | 25 | Protein assembly and cofactor ligation | 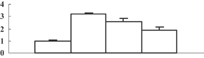 |
| BAD62115 | ||||||||
| 23 | NP_039380 | ATP synthase CF1 alpha subunit | 55687 | 5.95 | 213 | 34 | PS light reaction | 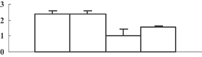 |
| 24 | NP_001042479 | Os01g0228600 | 34415 | 5.78 | 118 | 30 | Amino acid metabolism degradation | 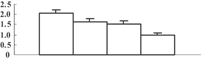 |
| D-isomer specific 2-hydroxyacid dehydrogenase | ||||||||
| 25 | NP_001056586 | Os06g0111500 | 52973 | 5.85 | 160 | 18 | OPP oxidative PP | 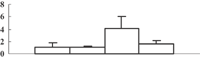 |
| Phosphoglucnate dehydrogenase | ||||||||
| Rossmann fold NAD(P)(+)-binding protein | ||||||||
| 26, 33, 34 | CAG34174 | Ribulose-1,5-bisphosphate carboxylase/oxygenase large subunit | 53331 | 6.23 | 328 | 21 | PS calvin cycle | 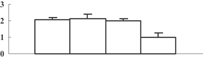 |
| 27 | AC074232_26 | ATPase alpha subunit | 55202 | 5.95 | 331 | 36 | PS light reaction | 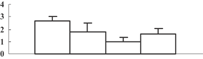 |
| 28 | NP_001054038 | Os04g0640700 | 81896 | 6.42 | 231 | 12 | Cell wall degradation | 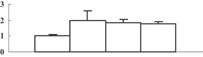 |
| Probable beta-xylosidase | ||||||||
| 29 | BAD11342 | BRI1-KD interacting protein 114 | 16703 | 5.79 | 206 | 28 | Nucleotide metabolism | 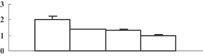 |
| 30 | NP_001060047 | Os07g0570700 | 29691 | 9.35 | 67 | 15 | Cell division | 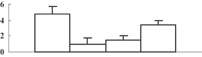 |
| Ribisome recycling factor | ||||||||
| 31 | NP_001056389 | Os05g0574400 | 35642 | 8.22 | 366 | 20 | TCA/org. transformation |  |
| Glyoxysomal and mitochondrial Malate dehydrogenases | ||||||||
| 32 | CAG34174 | Ribulose-1,5-bisphosphate carboxylase/oxygenase large subunit | 53331 | 6.23 | 310 | 23 | PS calvin cycle |  |
| 35 | CAG34174 | Ribulose-1,5-bisphosphate carboxylase/oxygenase large subunit | 53331 | 6.23 | 266 | 20 | PS calvin cycle | 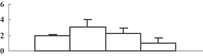 |
| 36 | CAG34174 | Ribulose-1,5-bisphosphate carboxylase/oxygenase large subunit | 53331 | 6.23 | 409 | 34 | PS calvin cycle | 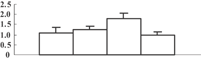 |
| 37 | NP_001065841 | Os11g0167800 | 15456 | 6.20 | 67 | 23 | Stress |  |
| ABA/WDS induced protein | ||||||||
| 38 | BAD08139 | Putative glycine-rich protein 2 | 23393 | 6.64 | 80 | 18 | Stress biotic | 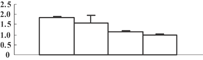 |
- SC, sequence coverage; MW, molecular weight.
After matrix assisted laser desorption ionization- time of flight mass spectrometry (MALDI-TOF MS) analysis and database searching as described in M&M, all 38 differentially expressed proteins were successfully identified. According to MapMan ontology defined by Thimm et al. (2004), all the identified proteins could be divided into seven functional groups (Figure 4B). The most abundant group consisted of 22 proteins involved in metabolism, and they accounted for approximately 57% of the total proteins (Figure 4B). The proteins involved in redox were the second abundant group. They included five proteins (spots 2, 4, 5, 6, and 15) and represented approximately 13% of the total proteins. Other functional groups included protein biosynthesis and destination, stress defense, cell division, signaling, and unknown function (Table 1, Figure 4B).
Effects of arsenic on chloroplast structure and photosynthesis-related proteins
Among the 22 metabolism-related proteins, 16 were downregulated and six were upregulated. Furthermore, 13 proteins involved in photosynthesis were all downregulated by arsenic stress. These proteins were involved in both the dark reaction (Calvin cycle) and the light reaction. The former group included the ribose-5-phosphate isomerase type A subfamily (spot 16), triosephosphate isomerase (spot 9), the ribulose-1,5-bisphosphate carboxylase/oxygenase large subunit (spots 26, 32, 33, and 34) and chloroplastic aldolase (spot 21); the latter one included oxygen-evolving complex protein 1 (spot 11), the adenosine triphosphate (ATP) synthase CF1 alpha subunit (spot 23), the ATPase α subunit (spot 27), and the chloroplast 23 kDa polypeptide of photosystem II (spot 19). These results are in good agreement with those of several previous studies (Marin et al. 1993; Azizur et al. 2007).
Except for the enzymes involved in the dark reaction, some components of different complexes on the thylakoid membrane were also detected as downregulated proteins under stress (Table 1). This hinted to us that the arsenate treatment might injure the inner membrane structure of the chloroplast. We then observed the ultra-structure of the chloroplast through TEM. Without arsenate stress, the chloroplast membrane structure was normal, with tightly packed, parallel grana thylakoids (Figure 3D). Upon exposure to 100 µM arsenate, the grana thylakoids of the chloroplast were slightly swollen, and could be at the initiation of degradation or vacuolation (Figure 3E). More severe deterioration and distortion on grana thylakoid structure was observed under 200 µM arsenate treatments (Figure 3F). Arsenic was also shown to negatively affect chloroplast structure in some other plant species, such as Pteris vittata (Li et al. 2006) and Taxithelium nepalense (Choudhury and Panda 2004), and it was revealed that arsenate stress might inhibit plant growth by negatively affecting chloroplast structure and inhibiting photosynthesis.
To obtain more convincing results, genes encoding five of the photosynthesis-related proteins were chosen to check their expression through quantitative reverse transcription-polymerase chain reaction (qRT-PCR) (Table 2). Except for the oxygen-evolving, complex-protein-encoded gene that displayed a gradually decreasing expression, expression of the other four genes decreased during the first 3 d and then sharply increased at 5 d after the treatment (Figure 5). We thus hypothesize that the continuous decrease of these proteins may feed back into their encoding genes, and induce the expression of these genes.
| Gene number | Accession | Description | Forward primer (5'–3') | Reverse primer (5'–3') | Product length (bp) |
|---|---|---|---|---|---|
| 11 | 2002393A | Oxygen-evolving complex protein | GAAGTTCTGCCTGGAGCCG | GTGTAGGTCAGGCGGGTCA | 108 |
| 16 | NP_001052419 | Ribose-5-phosphate isomerase type A subfamily | TTCGTCACCGACAACGGCAACT | CCTTCTTGGCGACGACCACC | 160 |
| 19 | ABY52939 | Chloroplast 23 kDa polypeptide of photosystem II | TTCGGGAAGCCCAAGACG | ACTCGGTGATGGTCTTCTTGGT | 196 |
| 21 | BAA02730 | Chloroplastic aldolase | CGAGGCGGCATACTACCA | GCCCGTTGTCCTGAGAAAT | 143 |
| 22 | BAD62115 | Photosystem II stability/assembly factor HCF136 | GATGGGCGTTATGTTGCTGT | GACGCTTCCTCAAAGTCTTCAGTT | 212 |
| Control | Rice actin | Actin | GGAAGTACAGTGTCTGGATTGGAG | TCTTGGCTTAGCATTCTTGGGT | 106 |

The digital numbers in the x-axis stand for different changed proteins that have been explained in Table 2. The values are means of three replicates ± SD. “*” Indicates significant difference with P < 0.05, and “**” indicates significant difference with P < 0.01.
Interestingly, some chloroplast-localizing chaperonins were upregulated by arsenate treatment. Photosystem II stability/assembly factor HCF136 (spot 22), which is required for the assembly of an early intermediate in PSII assembly, was upregulated. Under arsenate stress, the grana membrane structure was slightly injured, which might invoke the cell to initiate repair. Upregulation of the HCF136 protein may help to keep the photosystem II structure in a functional status. GroEL-like chaperonins (spots 7, 12), also named hsp60s in higher plants, can protect proteins from denaturation, and can help newly synthesized proteins to correctly fold under stress conditions (Nelson et al. 1992). Upregulation of Hsp60 in the poplar Populus tremula L. subjected to cadmium stress (Kieffer et al. 2008), and in Alyssum lesbiacum (Ingle et al. 2005) exposed to nickel, was also reported. It seems that upregulation of hsp60 is a canonical response for plants responding to heavy metal stress.
Effects on other metabolisms and accumulation of reactive oxygen species
As mentioned above, the metabolism-related proteins were the largest group that differentially expressed under the treatment of arsenate. Except for photosynthesis-related proteins, some proteins involved in glycolysis and the tricarboxylic acid (TCA) cycle, as well as amino acids, were downregulated by arsenate treatment. This indicates that arsenic may generally inhibit basic metabolisms. However, glutamine synthetase (GS), catalyzing the biosynthesis of glutamine, was all upregulated, which was also reported in poplar leaves (Populus tremula L.) subjected to cadmium (Kieffer et al. 2008). However, it was reported that GS was downregulated in roots of both rice and poplar (Ahsan et al. 2008; Kieffer et al. 2008). It might be interesting to know if there is any transportation of glutamine from the root to the aerial tissues in plants under heavy metal stress. In addition, we also detected the upregulation of phosphogluconate dehydrogenase that was involved in the oxidative pentose phosphate pathway. This pathway is an alternative means of hexose degradation, which is enhanced when glycolysis is blocked or inhibited under stress. The enhancement of the oxidative pentose phosphate pathway might help to supply enough precursors, ATP and reduction potential for various biosynthetic reactions in rice shoots under arsenic stress.
Two cell wall metabolism-related enzymes, xyloglucan endotransglucosylase/hydrolase (spot 10) and beta-xylosidase (spot 28), were detected as upregulated proteins, which indicated an enhancement of cell wall metabolism. Xyloglucan endotransglucosylase/hydrolase is a new type of xyloglucan-degrading enzyme (Tabuchi et al. 2001), and beta-xylosidase is an exo-enzyme that is involved in cell wall degradation. The exo-enzyme and the endohydrolase can synergistically act to degrade the cell wall and release xylose and arabinose. Meanwhile, we also detected the downregulation of UGPase (spot 17) catalyzing the synthesis of UDP-glucose. Although the cell wall structure did not change in the shoot, it was broken in the root (Figure 3C). These data suggested that a high concentration of arsenic might be able to break the cell wall.
It has been reported that excess arsenic could lead to the over-accumulation of ROS in different plants including rice (Hartley-Whitaker et al. 2001; Ahsan et al. 2008). In this study, the accumulation of both superoxide anions and hydrogen peroxide in the leaves of rice seedling in response to arsenate stress were visualized through chemical staining in situ (Figure 6). Staining results showed that the accumulation of hydrogen peroxide slightly increased with an increase in arsenate concentration (Figure 6B). However, superoxide anion accumulation did not increase (Figure 6A). In plant cells, ROS are mainly produced in the metabolism-related compartments, such as chloroplasts, mitochondria and peroxisomes, and the plasma membrane (Liu et al. 2010). The inhibition of basic metabolisms might be the reason that there was no increase or just a slight increase in ROS accumulation in the rice shoot. Through proteomic analysis, peroxiredoxin (spot 2) and one ascorbate peroxidase (spot 15) were detected as upregulated proteins. However, three other isoforms of ascorbate peroxidase (spots 4, 5, 6) were downregulated by arsenate treatment. All these indicate that arsenate may not lead to oxidative stress in aerial tissues.

The visualizations of superoxide anion (A) and hydrogen peroxide (B) in the leaves of rice seedlings upon exposure to 0 µM (I), 100 µM (II), and 200 µM (III) arsenate treatments for 5 d by the coloration nitro blue tetrazolium (NBT) and 3,3′-diaminobenzidine (DAB) staining in situ, respectively.
Conclusions
Arsenic can be toxic to plants once its concentration exceeds the threshold in soil. However, some plants are tolerant to a high concentration of arsenic and can accumulate it, which might be helpful in bioremediation of arsenic polluted soil. Among all the cereals, rice is the most arsenic tolerant. To obtain more knowledge about the rice response to arsenic, we conducted a comparative proteomic analysis on rice shoots. Although rice is tolerant to arsenic, its growth is heavily blocked under a concentration of 200 µM arsenic. Arsenic can be transported to aerial tissues from roots, and can negatively affect different metabolisms including photosynthesis, glycolysis and the TCA cycle. It may inhibit rice growth mainly through negatively affecting the chloroplast grana membrane structure. Although arsenic stress can result in the over-accumulation of ROS in roots (Ahsan et al. 2008), it did not increase the accumulation of ROS in shoots.
Materials and Methods
Materials culture and treatment
Rice (Oryza sativa “Nipponbare”) seeds were surface sterilized in 10% H2O2 for 20 min, washed three times with distilled water, twice with MiliQ water, and soaked in MiliQ water for 24 h. Subsequently, they were planted in sterilized sand and grown in a controlled growth chamber at 28 °C, with a 16 h light/8 h dark photoperiod. 10-d-old seedlings were washed with sterilized distilled water and transplanted into 1/3-strength Hoagland nutrient solution to adapt to a hydroponics condition for 10 d. Uniform seedlings were selected and subjected to a new group of nutrient solution containing different arsenate concentrations (Na3AsO4 · 12 H2O: 0, 100, and 200 µm). After 5 d of treatment, morphological and physiological changes of rice seedlings were determined. The shoots of rice subjected to 100 µm arsenate for 0, 24, 72, and 120 h were harvested, respectively, and then frozen in liquid nitrogen and kept at −80 °C for further protein and RNA analysis.
Transmission electron microscopy observation
The two-leaf age leaves and uniform roots were selected, and excised manually into 0.5–1.0 mm3 samples. Next, the small samples were successively fixed in glutaraldehyde and osmium tetroxide concurrently. Subsequently, the fixed samples were gradient dehydrated, permeated and embedded. Ultrathin sections were cut using a Leica UC6 Ultracut microtome (Leica, Germany). After double staining, sections were examined using a HITACHI H-7650 transmission electron microscope (Hitachi, Japan) at 80 kV and the Gatan 832 digital micrograph software.
Measurement of arsenic in roots and shoots
After arsenate treatment, roots and shoots were harvested and washed with distilled water, and then subsequently oven-dried at 80 °C for 24 h and then at 60 °C until there were no changes to their weight. Dried tissues were ground into a fine powder in a metal-free mortar and were then accurately weighed. Five milliliters of H2SO4 was added to 0.2 g of the ground sample, incubated overnight in a metal-free glass tube, and then heated in a two-step procedure: 160 °C for 2 h followed by 240 °C until it became a transparent liquid by adding several drops of HClO4. Arsenic concentration was measured by an atomic fluorescence spectrophotometer (AFS-8220, China).
Determination of the accumulation of ROS in situ
Superoxide anion was detected through nitro blue tetrazolium (NBT) staining in situ. In brief, the leaves of rice seedlings subjected to different arsenate treatments for 5 d were collected after being incubated in 0.05 M phosphate-buffered saline (pH 7.8) solution containing 1 mg/mL NBT, then kept at 28 °C overnight, faded using gradient alcohol and scanned. The appearance of blue color was monitored to indicate the accumulation of superoxide anion. Similarly, the leaves were soaked in 1 mg/mL 3,3'-diaminobenzidine (DAB) solution (pH 3.8) and kept at 28 °C overnight in a dark environment to detect the accumulation of hydrogen peroxide. Visualization of a reddish brown color showed the accumulation of hydrogen peroxide.
Protein extraction
The shoots were ground using a pre-chilled mortar and pestle with liquid nitrogen and homogenized in ice-cold extraction buffer containing 250 mmol/L sucrose, 20 mmol/L Tris-HCl (pH 7.5), 10 mmol/L ethylene glycol bis(2-aminoethyl ether)-N,N,N′,N′-tetraacetic acid, 1 mmol/L phenylmethane sulfonyl fluoride, 1 mmol/L dithiothreitol (DTT) and 1% Triton-100 as described by Yang et al. (2007). Proteins were obtained using a modified version of the method described by Hurkman and Tanaka (1986). In brief, an equal volume of Tris-phenol (pH >8.0) was added into the homogenate supernatant, and the mixture was agitated for 10 min and centrifuged at 12,000 g, 4 °C for 15 min. Next, five times the volume of 0.1 M methanolic ammonium acetate in 100% methanol (pre-chilled at −20 °C) was added into phenol phase without the interphase “junk.” The solution was vortexed and incubated at −20 °C overnight. Finally, the precipitated proteins were washed three times with acetone (pre-chilled at −20 °C). The vacuum-dried protein pellet was resolubilized in lysis buffer (7 M urea, 2 M thiourea, 4% w/v CHAPS, 65 mmol/L DTT and 0.2% w/v Bio-Lyte) and then stored at −80 °C for further use.
Two-dimensional electrophoresis and image analysis
Before two-dimensional electrophoresis (2-DE), different protein samples were centrifuged, and quantified via spectrophotometer using the Bradford method (Bradford 1976). Eight hundred micrograms of proteins were subsequently loaded into the IPG strips (pH 4–7, 17 cm, Bio-Rad, Hercules, CA, USA) through rehydration for 14 h at room temperature. Then, isoelectric focusing (IEF) electrophoresis was conducted according to the following procedure: 200 V, 30 min; 500 V, 1.5 h; 8,000 V, 5 h and 42,000 V h using a Protean IEF Cell (Bio-Rad). After IEF, the IPG strips were equilibrated for 18 min in an equilibration buffer (375 mmol/L Tris-HCl, pH 8.8, 6 M urea, 20% v/v glycerol, 2% w/v SDS) containing 20 mg/mL of DTT, followed by 18 min in an equilibration buffer containing 25 mg/mL of iodoacetamide. The second dimensional electrophoresis was run on 12.5% sodium dodecyl sulfate-polyacrylamide gel (SDS-PAGE) according to previously published methods (Yang et al. 2007). The 2-DE gels were stained with Coomassie Brilliant Blue (CBB R-250), followed by scanning with an EPSON PERFECTION V700 Scanner (Epson, Japan). The gel images were analyzed with PDQuest™ 2-DE Analysis Software (Bio-Rad, USA).
Trypsin digestion and MALDI-TOF-MS analysis
The differentially expressed protein spots were excised from the gel manually and washed with the MiniQ water twice. The gel slices were distained, dehydrated, and digested with trypsin according to previously reported methods (Yang et al. 2007). The digested protein peptides were analyzed over a mass range of 800–4,000 Da using an Autoflex speed MALDI-TOF-TOF mass spectrometer (Bruker Dalton). Subsequently, the obtained PMF data were searched against the NCBI nr rice database using the MASCOT software (Mascot Wizard 1.2.0, Matrix Science). The parameters used for the database search were: carbamidomethylation of cysteine and oxidation of methionine; peptide charge state of +1 and peptide mass tolerance of 50 ppm; a maximum of one for missed cleavages and monoisotopic.
RNA extraction and qRT-PCR
Total RNA was extracted from treated and control shoots of rice seedling using Trizol regent (Invitrogen, Carlsbad, CA, USA) according to the company's manual. Subsequently, total RNA was reverse transcribed into cDNA using a M-MLV First Strand cDNA Synthesis Kit (Invitrogen). Transcript levels of each selected gene were measured by qRT–PCR according to previously published methods (Li et al. 2007). The PCR program was as follows: 95 °C for 3 min, and 40 cycles of 95 °C for 10 s, 65 °C for 15 s, and 72 °C for 15 s. The transcription abundance was calculated by the standard curves of each selected gene and normalized to the amplification of the rice actin. The primer pairs are listed in Table 2.
Statistical analyses
The results of the physiological and biochemical data were statistically analyzed by one-way analysis of variance and least significant difference using the SAS statistics packages, and P < 0.05 was considered a statistically significant difference.
Acknowledgements
We are grateful to Mr Jianbo Cao from Huazhong Agriculture University for his help in cellular ultra-structure analysis, and to the Wuhan Yanxing Company for its assistance in MALDI-TOF MS analysis. This work was supported by the 100 Talents Program of the Chinese Academy of Sciences.