Front of pack nutritional labelling schemes: a systematic review and meta-analysis of recent evidence relating to objectively measured consumption and purchasing
Abstract
Background
Front of pack labelling (FOPL) provides visible nutritional information and appears to influence knowledge and reformulation. However, a recent Cochrane review found limited and inconsistent evidence for behaviour change. The present review aimed to examine studies published subsequent the Cochrane review, focusing on prepackaged foods, examining the impact of FOPL on purchasing and consumption.
Methods
Controlled experimental/intervention and interrupted time series (ITS) studies were included, with no age/geography restrictions. Exposures were FOPL with objectively measured consumption/purchasing outcomes. Thirteen databases were searched (January 2017 to April 2019) and forward citation searching was undertaken on the included studies. Purchasing data from experimental studies were meta-analysed. Two series of meta-analyses were undertaken; combined FOPL versus no-FOPL and specific FOPL scheme versus no-FOPL. Outcomes were sugar (g 100 g−1), calories (kcal 100 g−1), saturated fat (g 100 g−1) and sodium (mg 100 g−1).
Results
We identified 14 studies, reporting consumption (experimental; n = 3) and purchasing (n = 8, experimental; n = 3, ITS). Meta-analysis of experimental studies showed sugar and sodium content of purchases was lower for combined FOPL versus no-FOPL (−0.40 g sugar 100 g−1, P < 0.01; −24.482 mg sodium 100 g−1, P = 0.012), with a trend for lower energy and saturated fat (−2.03 kcal 100 g−1, P = 0.08; −0.154 g saturated fat 100 g−1, P = 0.091). For specific FOPL, products purchased by ‘high in’ FOPL groups had lower sugar (−0.67 g sugar 100 g−1, P ≤ 0.01), calories (−4.43 kcal 100 g−1, P < 0.05), sodium (−33.78 mg 100 g−1, P = 0.01) versus no-FOPL; Multiple Traffic Light had lower sodium (−34.94 mg 100 g−1, P < 0.01) versus no-FOPL. Findings regarding consumption were limited and inconsistent. FOPL resulted in healthier purchasing in ITS studies.
Conclusions
This review provides evidence from experimental and ‘real-life’ studies indicating that FOPL encourages healthier food purchasing. PROSPERO CRD42019135743.
Introduction
Poor diet is a major contributing factor to excess weight gain and risk of obesity, as well as ill health in general. Food environments are a key focus for policy-makers, given that they influence our health-related behavior and can encourage poor diets and over-consumption (1, 2). Small-scale environments include food packaging, the clear labelling of which may inform and enable people to make healthier food choices. Front of pack labelling (FOPL) provides key nutritional information, typically relating to the fat, sugar, salt or calorie content of foods. FOPL is clearly visible to the consumer on the front of food packaging (3), although it does not include nutritional information on the back of packaging, shelf labelling or labelling within food outlets. The World Health Organization recommends FOPL as a policy strategy to aid healthier food choices by providing clearly visible nutritional information, in addition to eliciting change in food production and supply, including product reformulation (4).
There is variability in labelling schemes adopted between and within countries and there have been calls for standardisation (5). The ‘Funnel Model’ has been developed to describe the functional and visual characteristics of FOPL (6). This model comprises various aspects of a label, which fall into the following broad categories: components (qualifying or disqualifying), methodology (including the reference unit, e.g. per 100 g or per serving; and the measurement method, e.g. compliance with scores/thresholds) and expression (including whether voluntary or mandatory; whether aiming to help the consumer or promote reformulation). This model allows FOPL to be described consistently and systematically. In some countries, FOPL schemes are mandatory (e.g. Ecuador, Chile and Finland), although most countries have voluntary schemes (European Union, Mexico, Australia and New Zealand) (7). FOPL can be interpretive or non-interpretive, and they can also provide aggregate (overall judgement on the product) or analytical information (detailed information on specific nutrients) (8). Interpretive FOPL uses nutrient profiling algorithms, or cut-off points, to create a judgment or recommendation based on nutritional content. Aggregate and interpretive FOPL includes the Chilean ‘warning labels’ that mark products as high in saturated fats, salt, sugar or calories; the ‘NutriScore’, as used in France, which presents a coloured scale of A (green, higher quality) to E (red, lower quality); and the ‘Health Star Rating’ (HSR), as used in Australia and New Zealand, which gives a score from 0.5 (least healthy) to 5.0 (most healthy) stars. Analytic and interpretive schemes include the Multiple Traffic Light (MTL), used in the UK and others, indicating red (high), amber (medium) or green (low) levels of fats, sugars and salt. Non-interpretive FOPL provides nutritional content information in a standardised format, although with no specific indication of how these relate to a healthy diet; these include the Daily Intake Guide (DIG), Facts Up Front and Guideline Daily Amount (GDA) (superseded by Reference Intake), which are all comparable and are used in Australia, USA and the European Union, respectively (7, 9).
A logic model depicts labels as acting on diet at the individual level, through changes in purchasing (via improvements in knowledge), and at the industry level through reformulation (3). The cultural, social, physical and individual contexts in which purchasing takes place influence the impact of labelling on food choices. There is some evidence that FOPL can influence reformulation, leading to greater availability of healthier foods in the food system (10, 11). There is good evidence that FOPL can improve adults’ knowledge, ability to interpret food labels and select healthier products (12-15), although the impact on purchase intentions is inconsistent (15-20). Whether FOPL changes consumption behaviours is also unclear, two reviews examined the impact of FOPL and included consumption outcomes, with both finding few studies and also that effects were not significant (15, 21). Another review found that food labelling significantly reduced consumption of energy and fat, although the labelling was not confined to FOPL and included labels on menus and other point-of-purchase labelling (22). Little is known about whether FOPL can influence purchasing, when measured objectively, although the findings from one review suggest some impact on consumers choosing healthier products (15).
In 2018, a Cochrane review was published which aimed to ‘assess the impact of nutritional labelling for food and non-alcoholic drinks on purchasing and consumption of healthier items’ (3). This review identified six experimental studies, which examined the impact on consumption of labelling on prepackaged foods, although no impact on calorie intake was found and the studies were considered to be of low quality. The majority of the evidence identified in that review came from studies considering the effect of nutritional labelling in ‘out of house’ food service settings (nutritional information on menus/menu boards/labels near food products in restaurants, cafeterias and coffee shops). This evidence supported labelling for encouraging healthier purchasing. The Cochrane review did not identify studies that measured the impact of FOPL on prepackaged foods on objectively measured purchasing behaviours. The cut-off for this review was April 2017 and, given that this is a highly active research area, we anticipated that recently published studies could add to the evidence base and help to inform current policy. The present review aimed to examine studies published subsequent to the Cochrane review with a focus on FOPL on prepackaged foods, examining purchase and consumption, and using more inclusive eligibility criteria for purchasing outcomes. Meta-analyses were conducted across studies using experimental conditions to compare FOPL with a no-FOPL condition overall for multiple purchasing outcomes and separately by FOPL scheme.
Materials and methods
We conducted a systematic review, in collaboration with UCL Institute of Education and using eppi-reviewer, version 4 (23). The study was registered with PROSPERO (registration number CRD42019135743), and the systematic review is reported in accordance with the PRISMA Checklist (24). The protocol describes the work as a rapid review update; in practice, the review was conducted as an appraisal of recent research subsequent to the Cochrane review.
Eligibility criteria, information sources and search strategy
Experimental and intervention studies were included with randomised or quasi-randomised controlled trials, controlled before-and-after studies, and interrupted time series (ITS) studies. Eligible for inclusion were participants of any age; studies from April 2017 onwards; intervention criteria of any FOPL on prepackaged foods; and outcomes of objectively measured consumption (at individual level) and purchasing behaviour (either quantity of unhealthy/healthier products or nutritional content of purchased products at individual or family level). Experimental purchasing outcomes were included if they were made with participants’ money, allocated money or hypothetical purchases (providing the experiment was set up to reflect a realistic shopping experience). We assessed this based on the instructions given to participants (e.g. directed to complete a weekly shop for their household), whether the environment was constructed based on real shopping environments (online or actual), and whether representative products and prices were presented. Experimental studies were required to have a no-FOPL control group.
The search strategy was adapted from the Cochrane review search, by an information scientist (CS) at EPPI-Centre. Changes were made to narrow the focus of the review to FOPL on prepackaged foods (in retail settings or experimental contexts), excluding labelling in food service settings (such as menus or labels placed near foods in restaurants, cafeterias or coffee shops), and adding focused search terms for FOPL and named labelling schemes. Systematic searches of bibliographic databases covering the research disciplines of medicine, psychology, science, social science and business were conducted: ASSIA (Proquest), ABI Inform Global (Proquest), CINAHL (EBSCO), Cochrane Central Database of Controlled Trials, Cochrane Database of Systematic Reviews, EMBASE (OVID), HMIC (OVID), Medline (OVID), PsycINFO, Sociological Abstracts (Proquest), SCOPUS, Trials Register of Promoting Health Interventions (TRoPHI) and Web of Science (Science Citation Index, Social Science Citation Index, Emerging Sources Citation Index). Further details about the search and the full search strategy for each database are included the Tables S1 and S2.
Searches were conducted on 8 April 2019 and results were imported into reference manager software (Endnote X8 [https://endnote.com/]), where duplicates were removed. Articles were then imported into the eppi-reviewer, version 4, where duplicate records were again assessed. A ‘cited by’ search was conducted using Google Scholar (https://scholar.google.com); studies included in the present review were used as the key papers and the ‘cited by x’ function was used to identify any relevant articles published after the date of the main searches. The ‘cited by’ search was conducted on the 4 June 2019 and this date was considered the cut-off point for inclusion in the review. A completed report of an ongoing trial identified in the Cochrane review (3) was identified.
Study selection
Exclusion criteria were date (pre-2017), intervention (any non-nutritional FOPL including restaurant and menu labelling, shelf labelling, back of pack labelling), study type (systematic reviews, dissertations, magazine articles, conference abstracts) and outcome measure (e.g. attitudes, liking, understanding, knowledge, self-reported purchasing or consumption intention). Articles were included if all other inclusion criteria were met. All studies were independently screened by two reviewers (JP and DD) on title and abstract using eppi-reviewer, version 4. All queries were reconciled by the reviewers and any outstanding queries resolved with the wider research team (HC and SR). The full texts of articles were retrieved using both web and library services. Full-text screening was independently completed by two reviewers (JP & DD) using eppi-reviewer, version 4, and queries were jointly reconciled.
Data extraction
Descriptive data were extracted by one reviewer (JP) and checked for accuracy by a second reviewer (HC). This included study descriptors (authors, country, publication year and design), participant descriptors (sample size, age range and mean), comparison type, intervention type, outcome type and intake measure (if applicable). Data from experimental studies for inclusion in meta-analyses were independently extracted by two authors (JP and HC). Corresponding authors were contacted to provide raw data where necessary; six authors were contacted for seven studies and all provided additional data.
Assessment of quality
Risk of bias for the experimental studies was assessed by two reviewers (HC and JP) using the rob 2 tool for randomised trials or the robins-i tool for nonrandomised studies (25, 26). The sources of potential bias evaluated were randomisation procedure, deviation from intended interventions, missing outcome data, selective reporting, confounding, selection bias and classification of interventions, as appropriate for the study design. To assess publication bias, a funnel plot was created to assess asymmetry using Egger’s test (27). Risk of bias for the ITS studies was assessed by two reviewers (HC and JP) using a new tool which is being developed by researchers at the EPPI-Centre and originally used in a review on standardised packaging (28). The tool included a critique of the data sampling, data collection, measures, analysis and inferences made (29).
Data synthesis
Data from the experimental studies were meta-analysed; for inclusion, studies were required to have compared the effect of a FOPL with the no-FOPL control (the latter included the back of pack nutrition information panel) on objectively measured purchase or consumption behaviour. Two articles (comprising three studies) were identified which reported consumption data, the outcome measures were inconsistent therefore these data were not meta-analysed. Studies measuring purchasing outcomes were required to report the nutritional content of purchased products and provide mean values with standard deviations. The DerSimonian-Laird random-effects model was used for meta-analysis as a result of the differences in the studies, including the settings (laboratory, shopping centre, online or supermarket) and measurement of purchase outcomes (‘real purchase’ task of a single product per category, simulated weekly purchase, actual purchases over 4 weeks). Energy outcomes were converted to kcal if kJ were reported (4.184 kJ = 1 kcal) (30) and salt outcomes were converted to sodium (1 mg sodium = 2.55 mg salt) (31). All outcomes were also standardised to report the nutrient content per 100 g (energy, kcal; sugar, g; saturated fat, g; sodium, mg).
Four meta-analyses comparing any FOPL with a no-FOPL control were conducted, one per nutritional outcome (calories, sugar, saturated fat and sodium), with a single combined FOPL condition calculated for each study using Cochrane methods (32). To allow for comparison between individual FOPL labels, these meta-analyses were also conducted with the results for the individual FOPL schemes presented as separate data points. Further information about the data synthesis is available in the Table S3, including the rationale for including studies in meta-analyses and which data points were used, how experimental conditions were combined and how data were standardised to 100 g. Effect sizes are reported for each nutritional outcome (calories, sugar, saturated fat and sodium) per 100 g. stata/se, version 15.1 (StataCorp, College Station, TX, USA) was used for the meta-analyses.
Results
Study selection
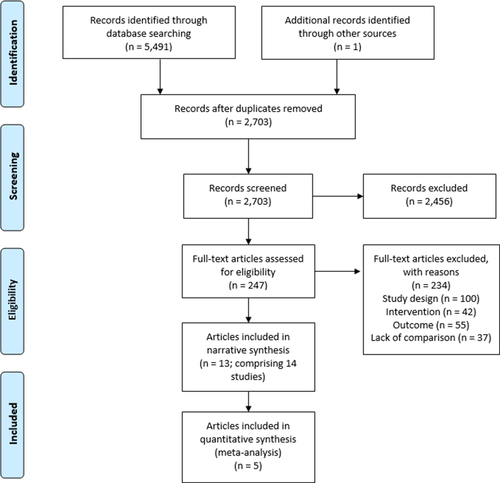
The database searches resulted in 5491 records, which included 2702 unique records after the removal of duplicates. Screening on title and abstract resulted in 246 records that were screened on full text and assessed for eligibility. One additional record was identified through other sources (via the ‘cited by’ of included studies). The resulting 14 studies, from 13 articles, met the inclusion criteria (for flowchart, see Fig. 1). Of these, 11 were experimental studies, three of which (from two articles) measured consumption and eight measured purchasing (three where participants used their own money and five were where the study took place in a virtual shop, and the remaining three were ITS studies (i.e. ‘real-world’). Five of the experimental studies that reported purchasing outcomes were suitable for meta-analysis.
Study description and results
A summary of the study descriptions is provided in Table 1.
| Author, year | Country | Sample description | Design | FOPL condition | Control condition | Intervention | Outcome measures |
|---|---|---|---|---|---|---|---|
| Experimental studies reporting purchasing behaviour outcome | |||||||
| Acton and Hammond (2018) | Canada |
n = 675 Age range (years) = 16+ Mean age = NS |
Experimental (shopping centre), within-between subjects |
HSR ‘High in sugar’ symbol Text health warning |
No label |
Purchase of single beverage from 20 options. Given $5 CAD to complete purchase and kept change |
Per beverage: – Energy (kcal) – Free sugar (g) |
| Acton et al. (2019) | Canada |
n = 3584 Age range (years) = 13+ Mean age = NS |
Experimental (shopping centre), within-between subjects |
‘High in’ warnings MTL HSR Nutrition grade* |
No label |
Purchase of single beverage and a single snack, both from 20 options. Given $5 CAD to complete purchases and kept change |
Per beverage and per snack: – energy (kcal) – total sugar (g) – sodium (mg) – saturated fat (g) |
| Ang et al. (2019) | Singapore |
n = 512 Age range (years) = 21+ Mean age = 38.1 |
Experimental (online), RCT |
‘High in sugar’ symbol Text-based warning |
No label |
Hypothetical online household grocery selection (food and beverages), with a compulsory spend of S$50-S$250 Following the shopping task, participants completed a brief survey and were compensated according to the web panel’s in-house point system |
– Total sugar (g) per shopping trip |
| Crosetto et al. (2017) | France |
n = 591 Age range (years) = NS (50% 30–45) |
Experimental (paper catalog + computer), pre + post and between-subjects design |
NutriColors¶ NutriMark** NutriRepère††NutriScore SENS |
No label |
2 day household grocery selection (food and beverages), baseline and intervention shopping baskets Were required to buy a subset of their selected products. Remunerated 32€ per session |
– Mean FSA score of basket at follow up (per 100 g) – Mean FSA score decrease |
| Graham et al. (2017) | USA |
n = 153 Age range (years) = NS (parent) Mean age = 38.1 (parent) |
Experimental (laboratory grocery aisle), RCT |
MTL Facts Up Front |
Access to BOPL |
Laboratory grocery aisle, selection of 6 food items (2 chips/snacks, crackers/cookies, cereal) Instructed to behave as if a typical food shop and to select 6 items to take home Compensated with the 6 selected products, a $US 20 gift card, parking remuneration and a small toy |
Mean amount per serving: – energy (kcal) – sugar (g) – sodium (mg) – saturated fat (g) |
| Machin et al. (2018) | Uruguay |
n = 437 Age range (years) = 18–77 Mean age = NS |
Experimental (online), between subjects |
MTL system ‘High in symbol’† |
No label |
Simulated weekly online food purchase (food and beverage), asked to select all products they would buy. Entered into a raffle for a voucher valued at $US 100 |
Mean amount per 100 g: – energy (kcal) – sugar (g) – salt (mg) – saturated fat (g) |
| Neal et al. (2017) | Australia |
n = 1578 Age range (years) = 18+ Mean age = 37.9 |
Experimental (online/smartphone), randomised parallel-group trial |
HSR MTL Daily Intake Guide‡ |
NIP |
Real purchases of packaged foods and beverages from the grocery store over 4 weeks, recorded by scanning barcodes, images of receipts. $AU 100 shopping voucher |
Mean amount per 100 g from 4 weeks of purchases: – energy (kJ) – sugar (g) – sodium (mg) – saturated fat (g) – Mean NPS score |
| Ni Mhurchu et al. (2017) | New Zealand |
n = 1357 Age range (years) = 18+ Mean age = 33 |
Experimental (online/smartphone), RCT |
MTL§ HSR |
NIP |
Real purchases of packaged foods and beverages from the grocery store over 4 weeks, recorded by scanning barcodes, images of receipts NZ $10 Voucher at run in phase, then NZ $NZ80 voucher after completion of final questionnaire |
Mean amount per 100 g from 4 weeks of food purchases: – energy (kJ) – sugar (g) – sodium (mg) – saturated fat (g) – fibre (g) – protein (g) – fruit and vegetable, nut, and legume points – mean NPSC of food and beverages |
| Experimental studies reporting consumption outcome | |||||||
| Tangari et al. (2019), study 1 | Australia |
n = 140 Age range (years) = 20–49 Mean age = 26 |
Experimental (lab), between-subjects design |
Serving size only Serving size with calorie information |
No label | Snack consumption (crackers), time ns | Intake (g) |
| Tangari et al. (2019), study 5 | Australia |
n = 134 Age range (years) = 18–52 Mean age = 23 |
Experimental (lab), between-subjects design |
Standard serving info + calorie Double serving info + calorie |
No label | Snack consumption (Pringles-style crisps), time ns, instructed to eat as many as they wanted | Intake (g) |
| Zandstra, Willems and Lion (2018) | UK |
n = 493 Age range (years) = 24–65 Mean age = NS |
Experimental (lab), between-subjects design |
30% reduced in salt Same great taste, less salt More taste, less salt and kids will love it |
No label | Served chicken noodle soup, with salt shaker | Salt consumption (g) |
| Interrupted time series studies | |||||||
| Araya et al. (2018) | Chile | Customers at a major grocery store chain (real-world setting) 125 485 consumers, 210 819 eligible transactions | Mandatory FOPL regulation versus pre regulation period (6 stores) May to July 2016 versus May to July 2015 | ‘High in’ warnings (Mandatory) | – | – | Consumer level point-of-sale data (price, date, time for purchase of fruit juice, breakfast cereal, chocolate & candy and cookies) |
| Elshiewy and Boztug (2018) | UK | Customers at a major grocery store chain (real-world setting) 188 062 loyalty card members, 4 131 570 purchases | In store brand products with FOPL versus other products 2007 versus 2006 | Guideline Daily Amounts (Voluntary) | – | – | Energy content of purchases from scanner data for four-week aggregated periods (biscuits, breakfast cereal, and soft drink) |
| Peñaherrera (2018) | Ecuador | Random sample of 1646 households | Traffic light labelling mandatory versus preregulation, January 2013 to August 2014 versus September 2014 to December 2015 | Traffic light (Mandatory) | – | – | Purchase of soft drinks from Kantar panel and mean nutritional content of soft drink (sugar, grams) from ARCSA data. |
- ARCSA, Agency National Regulation, Control and Health Surveillance of Ecuador; BOPL, back of pack labelling; CAD, Canadian dollar; cal, calories; FOPL, front of pack labelling; FSA, Food Standard Agency; g, gram; HRS, Health Star Rating; MTL, Multiple Traffic Light label; NIP, Nutrition information panel; NPI, Nutrient Profile Index; NPS, Food Standards Australia New Zealand nutrient profile score; NPSC, Food Standards Australia New Zealand Nutrient Profiling Scoring Criterion; NS, not stated; RCT, randomised controlled trial.
- * Equivalent to Nutriscore;
- † Chilean Warning system;
- ‡ Equivalent to Facts Up Front.
- § Text stated that the comparison group was a ‘Traffic Light’ label but assumed from reference provided that this was a Multiple Traffic Light label;
- ¶ Equivalent to Multiple Traffic Light;
- ** Equivalent to Health Star Rating;
- †† Equivalent to Facts Up Front.
Experimental studies
Settings
Included studies were from a range of countries: two were conducted in Canada by the same authors (33, 34), two were conducted in Australia (35, 36), and the remainder were carried out in the US (37), Singapore (38), France (39), Uruguay (40), New Zealand (41) and the UK (42). The settings varied, with studies carried out in shopping centres with passers-by being invited to participate (33, 34), online or using a smartphone (35, 38, 40, 41), via a paper catalogue for an experimental food store with online e-shopping environment (39), in an experimental food store (37), or in a laboratory (36, 42).
Participants
The participants in the majority of studies were adults (18 + years), although three studies included adults and children; two studies had minimum ages of 16 and 13 years(33, 34) and the third included parent and child dyads, where children were aged 6–9 years(37).
Comparisons
Experimental conditions varied between studies. For the three studies reporting consumption data, one used a nutritional label containing information about salt content (42) and the other two used serving size and calorie information (36). Eight studies reported impacts on purchasing and all comprised more than one comparison group. Five studies included the HSR or similar (33-35, 39, 41); six studies included a MTL group (34, 35, 37, 39-41); two studies included NutriScore or similar (34, 39); one study included the Chilean warning system, a ‘high in’ symbol, (40); three studies included other ‘high in’ warnings (33, 34, 38); one study included the Facts Up Front label (37); and one study included the DIG (35), both label types were considered ‘straight up’ (or non-interpretive) nutritional information. Other comparisons included text-based warnings (33, 38, 39). All of the experimental studies included a no-FOPL control (as per the inclusion criteria), the majority used a no label information group as the comparison but two studies used a ‘nutrition information panel’ on the back of the product (35, 41) and, in one study, the back of pack label was accessible to participants because they could pick up the products if they wished (37).
Outcome measures
The reported outcomes varied between studies. The studies examining consumption reported either food intake in grams (36) or salt intake in grams (42). For the studies reporting purchasing, the outcomes were the sugar and energy content of a single drink product (33), the sugar, energy, sodium and saturated fat content of a single food or drink product (34), mean sugar, energy, sodium and saturated fat content of six items purchased (37), sugar content of a single shopping trip (38), or sugar, energy, sodium and saturated fat of a weekly shop (40), or grocery shopping over a four-week period (35, 41). One of these studies reported the nutritional content of both a purchased snack and beverage, with these outcomes being included as separate data points (34). Three studies reported the mean ‘nutrition score’: one for a basket of shopping using the ‘Food Standard Agency’ score (39) scale 1–100 (1 = least healthful and 100 = most healthful) and two for purchases over 4 weeks using the Food Standards Australia New Zealand Nutrient Profiling Scoring Criterion or calculator (35, 41). For the purchasing outcomes, four studies were experiments in real-world settings (33-35, 41), two studies were in labs (37, 39) and two studies were online (38, 40). The purchasing outcomes also varied in size and contents of purchase, two studies were single purchases of a drink product +/− a food product settings (33, 34), one study was a purchase of six food items (37), two studies directed participants to complete ‘a real household grocery shop’ trip (38) or a ‘a weekly food purchase for their household’ with food and beverage options (40) and, lastly, two studies recorded the household food and beverage purchases over 4 weeks(35, 41).
Consumption findings
Only two articles (comprising three studies) were identified that examined the impact of FOPL on food consumption. In one of these, the presence of serving size information on front of pack had no effect on consumption of a product (in this case crackers) framed as ‘healthy’ but increased intake of a ‘less healthy’ product compared to no information (36) (study 1). The presence of both serving size and calorie information on the label had a greater effect, further increasing calorie intake. In a subsequent study, a no-FOPL control was compared with a calorie and serving size label and a ‘double serving’ calorie and serving size label (36) (study 5). Consumption was greater with the standard size label compared to both the ‘double serving’ label and control. A study comparing a ‘reduced salt’ FOPL with a no label control and two other label conditions related to taste (42) found no differences between the conditions, regardless of the messaging; intake varied only according to participants’ interest in reducing dietary salt.
Purchasing findings
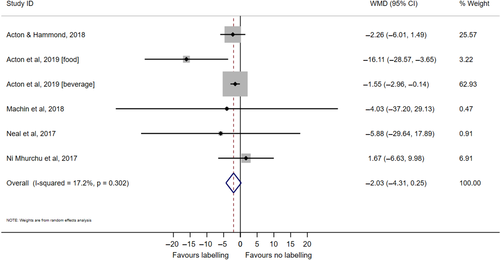
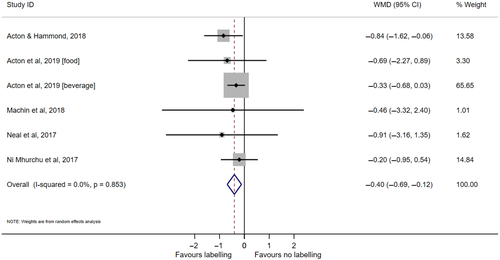
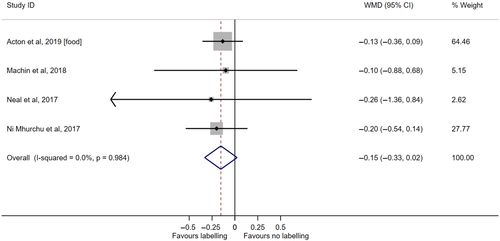
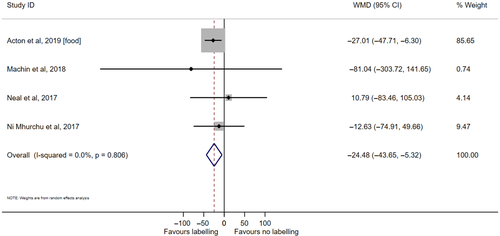
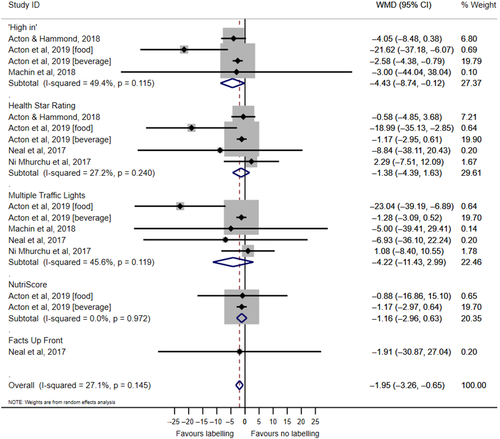
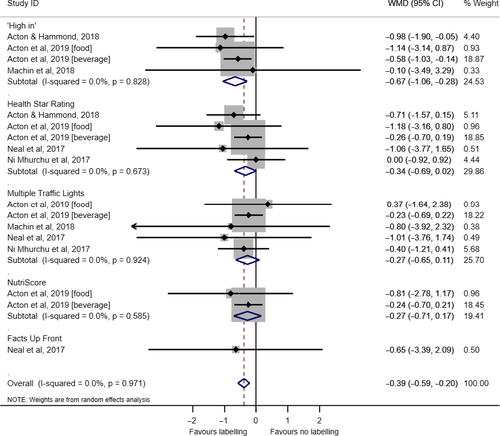
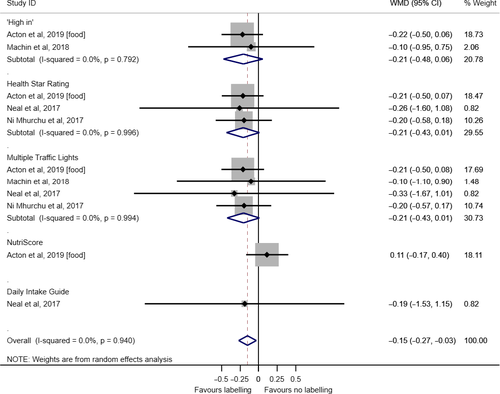
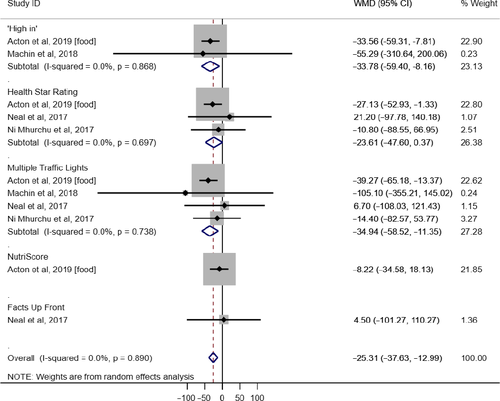
Meta-analyses are shown in Figs 2-9 and summarised in Tables 2 and 3. Overall, FOPL significantly reduced the content of sugar and sodium in purchased products (Table 2 and Figs 3 and 5, respectively) and showed a trend in decreasing energy and saturated fat content (Table 2 and Figs 2 and 4, respectively). When examining the impact of FOPL by specific scheme, meta-analyses showed that the ‘high in’ scheme significantly reduced purchase content of energy, sugar and sodium (Table 3 and Figs 6, 7 and 9, respectively) and MTL decreased sodium content (Table 3 and Fig. 9), with a trend towards reduction in the purchase content of saturated fat (Table 3 and Fig. 8). The HSR scheme showed no significant findings, although it trended towards a decrease in purchase content of sugar, saturated fat and sodium (Table 3 and Figs 7, 8 and 9, respectively).
| Outcome | Studies | Effect size (95% CI) | P value | I2 (%) |
|---|---|---|---|---|
| Energy (kcal 100 g–1) | 6 | −2.030 (−4.308, 0.249) | 0.081 | 17.20 |
| Sugar (g 100 g–1) | 6 | −0.403 (−0.690, −0.116) | 0.006 | 0.0 |
| Saturated fat (g 100 g–1) | 4 | −0.154 (−0.331, 0.024) | 0.091 | 0.0 |
| Sodium (mg 100 g–1) | 4 | −24.482 (−43.648, −5.316) | 0.012 | 0.0 |
- CI, confidence interval; I2, statistic indicating the degree of heterogeneity across studies.
- Bold values indicates P < 0.05.
| Outcome | Studies | Effect size (95% CI) | P value | I2 (%) |
|---|---|---|---|---|
| Energy (kcal 100 g–1) | ||||
| ‘High in’ | 4 | −4.430 (−8.741, −0.119) | 0.044 | 49.40 |
| Health Star Rating | 5 | −1.381 (−4.388, 1.626) | 0.368 | 27.2 |
| Multiple Traffic Light | 5 | −4.217 (−11.425, 2.992) | 0.252 | 45.6 |
| NutriScore | 2 | −1.163 (−2.956, 0.629) | 0.203 | 0.0 |
| Daily Intake Guide | 1 | −1.912 (−30.867, 27.043) | 0.897 | – |
| Sugar (g 100 g–1) | ||||
| ‘High in’ | 4 | −0.668 (−1.059, −0.277) | 0.001 | 0 |
| Health Star Rating | 5 | −0.339 (−0.694, 0.015) | 0.061 | 0 |
| Multiple Traffic Light | 5 | −0.272 (−0.655, 0.110) | 0.162 | 0 |
| NutriScore | 2 | −0.273 (−0.712, 0.167) | 0.224 | 0 |
| Daily Intake Guide | 1 | −0.650 (−3.395, 2.095) | 0.643 | – |
| Saturated fat (g 100 g–1) | ||||
| ‘High in’ | 2 | −0.209 (−0.475, 0.058) | 0.126 | 0 |
| Health Star Rating | 3 | −0.211 (−0.435, 0.013) | 0.065 | 0 |
| Multiple Traffic Light | 4 | −0.207 (−0.426, 0.013) | 0.065 | 0 |
| NutriScore | 1 | 0.114 (−0.172, 0.400) | 0.436 | – |
| Daily Intake Guide | 1 | −0.190 (−1.530, 1.150) | 0.781 | – |
| Sodium (mg 100 g−1) | ||||
| ‘High in’ | 2 | −33.778 (−59.395, −8.161) | 0.010 | 0.0 |
| Health Star Rating | 3 | −23.614 (−47.600, 0.373) | 0.054 | 0.0 |
| Multiple Traffic Light | 4 | −34.938 (−58.525, −11.351) | 0.004 | 0.0 |
| NutriScore | 1 | −8.222 (−34.579, 18.135) | 0.541 | – |
| Daily Intake Guide | 1 | 4.500 (−101.266, 110.266) | 0.934 | – |
- CI, confidence interval; I2, statistic indicating the degree of heterogeneity across studies.
- Bold values indicates P < 0.05.
For FOPL versus no label (Table 2), Egger’s regression analysis found no evidence of bias for any, funnel plots showed some evidence of asymmetry, and trim and fill showed no evidence of missing studies for any. For FOPL scheme versus no label (Table 3), Egger’s regression analysis found no evidence of bias for any, funnel plots showed low evidence of asymmetry, and trim and fill analyses showed evidence of no missing studies for the saturated fat and sugar meta-analyses, although evidence of one missing NutriScore study in energy meta-analysis and two missing HSR studies in the sodium meta-analysis.
The findings from the three purchase studies not included in the meta-analyses (37-39) were broadly consistent with the meta-analysis results. Two of the studies found improved nutritional quality of purchased products with most FOPL compared to control groups, with significant effects for NutriColors (equivalent to MTL), NutriMark (equivalent to HSR), NutriRepere (equivalent to DIG) and NutriScore (39) and a text-based health warning, although not for a ‘high in sugar’ warning (38). One study found no differences in the energy, sugar, saturated fat or sodium of selected products with either MTL or DIG FOPL compared to no-FOPL (37). One study also measured fibre, protein and combined fruits, vegetables, nuts and legumes points, with no significant differences between FOPL or no-FOPL (41).
Few studies reported the effect of FOPL according to socio-demographic or other characteristics. One study found a less pronounced (but still significant) reduction in purchasing of unhealthy foods in those of lower socio-economic status (SES), with NutriScore performing best in this group (39). There was no effect of body mass index, education or household income on purchasing in another study (37). One study found no impact of age, ethnicity and education, whereas the nutrition information panel (control) appeared to perform better than the HSR and MTL labels in low-income groups and men, although the authors commented that the numbers in these sub-groups were small (41).
Interrupted time series studies
Study descriptions
Three ITS studies were identified, conducted in Chile (43), the UK (44) and Ecuador (45). All examined the impact of the introduction of new labelling schemes on product sales in real-world settings by measuring purchasing behaviours before and after the introduction of the schemes. The labelling schemes were the mandatory Chilean ‘high- in’/FOP warning label (43), the voluntary UK FOP Guideline Daily Amounts (44) and the mandatory TL labelling in Ecuador (45). Two of the studies used customer scanner data at major grocery retail stores (43, 44) and one used Kantar data from a random sample of households (45). Outcome measures were the quantity of products purchased and/or the energy content of the purchased products. The products varied between studies: two studies included foods and drinks (fruit juice, breakfast cereal, chocolate and cookies (43); biscuits, breakfast cereals and soft drinks (44) and one study focused on soft drinks (45).
Findings
All of the studies found decreased purchasing of unhealthy products for at least some of the included products. One study found a significant reduction in purchases of juices (−23.8%) and cereals (−11.0%) after the introduction of the Chilean warning labels, although there was no impact on chocolates and candies (11.2%) or cookies (1.7%) (43). The UK study found that customers purchased products with fewer calories after the introduction of FOP Guideline Daily Amounts, with a 9.5% decrease in calories across the three included product categories (cookies, breakfast cereals and soft drinks) (44). The study from Ecuador found that, after the introduction of a mandatory traffic light scheme, the purchase of soft drinks reduced by 0.003 L and the mean sugar content of soft drinks decreased by 0.93 g 100 mL−1, with the latter being a result of reformulation (45).
Bias assessment
For the experimental studies, those examining consumption were rated as having 'some concerns' to 'high' risk of bias and those measuring purchasing were rated as having 'some concerns' or 'low' risk for one study. The risk of bias for the ITS studies were all assessed as low risk and rated as good quality. The bias assessments are provided in the Tables S4 and S5.
Discussion
This systematic review set out to identify studies published subsequent to the 2018 Cochrane review by re-running the review with more inclusive purchasing outcomes and a focus on the impact of FOPL on objectively measured purchasing and consumption of prepackaged foods. We identified 11 experimental studies (eight of which reported purchasing outcomes and three reported consumption outcomes) and three ITS studies. We undertook meta-analyses which are informative about the impact of FOPL on the sugar, energy, saturated fat and sodium content of good purchases, thus extending previous work. We found a significant overall effect of any FOPL compared to no-FOPL for the sugar and sodium content of purchases, and a trend for energy and saturated content. The ‘high in’ FOPL significantly reduced the sugar, calorie and sodium content of purchased products compared to no FOPL and MTL FOPL significantly reduced the sodium content of purchased products compared to no FOPL. We found no effects on purchasing from Nutriscore, HSR or DIG, although the HSR FOPL approached significance for sugar, saturated fat and sodium. It should be noted that few studies were identified that examined Nutriscore or DIG. Data on consumption were limited and findings inconsistent. The three ITS (i.e. ‘real-life’) studies indicated that labelling schemes (‘high in’, ‘Guideline Daily Amount’, TL) resulted in healthier purchasing patterns.
The logic model proposed in the Cochrane review identified purchasing changes at the individual level (via improvements in knowledge) as one of the key mechanisms by which nutritional labelling could impact diet (3). Most of the evidence identified in the current review relates to purchasing and the results from both experimental and ‘real-life’ studies generally support FOPL being associated with healthier purchasing patterns. In line with the logic model discussed here, previous studies have consistently shown that FOPL improve knowledge (12, 13). Our work extends previous reviews that only found limited data relating to purchasing outcomes and this likely reflects our inclusive eligibility criteria and potentially the increasing interest in studying the effectiveness of FOPL as a means of improving dietary intake in populations and increasing recognition of the need for evidence to support national policies (3, 46). There was limited evidence to support FOPL directly changing consumption in experimental contexts, with few studies and inconsistent findings, which is similar to other previous reports (3, 15).
In terms of the impact of individual labelling approaches, we are unable to comment on how these influence consumption as the labelling approaches in these studies were limited to ‘straight up’ nutritional information, although the results were not indicative of these being effective. We were able to undertake meta-analyses presenting the effects of individual labelling approaches on purchasing outcomes using data from the experimental purchasing studies, although we found only significant effects for the ‘high in’ FOPL for energy, sugar and sodium and MTL for sodium only compared to no-FOPL. The three ITS studies identified in the present review showed healthier purchasing following the introduction of the Chilean warning label, traffic light labelling in Ecuador and the UK FOP Guideline Daily Amounts. These studies were rated as being high quality with no major concerns, which gives confidence in the findings. An additional study, carried out in the Netherlands using household purchasing data but published after our cut-off point for inclusion, also found favourable effects of labelling for most products (47). In that study, products displaying the voluntary Dutch Choices label (which indicates that a product is a ‘healthy’ choice) experienced significant increases in market share after implementation of the scheme. Another recent study examined national household purchasing data of beverages before and after the mandatory FOP warning system in Chile (48). It was found that following the policy implementation, purchases of beverages high in energy, sugar, sodium and saturated fat content decreased by 23.7% or by 22.8 mL per capita per day. This supports our meta-analyses findings, in that ‘high in’ systems are effective at reducing consumption of energy, sugar and sodium.
Taken together, these findings suggest that overall, labels had an impact on behaviour, although this was stronger for purchasing behavior, as opposed to consumption, and there appeared to be less evidence to support ‘straight up’ nutrition information (including Guideline Daily Amounts/DIG). A previous narrative review found that FOPL schemes incorporating text and symbolic colour were easier to interpret than simply providing numeric information (including guidelines) (12), and another review found that interpretive labels which were nutrient specific (i.e. provided information about specific nutrients rather than an overall indicator of healthiness) had most impact on knowledge (15). These reviews support the suggestion here that ‘straight up’ nutrition information is likely to be more difficult for people to understand and act upon. A more recent study across 12 countries with large samples found that the five studied FOPL (NutriScore, MTL, HSR, warning symbol, Reference Intakes) all improved knowledge but their effectiveness varied considerably; NutriScore performed best, followed by the MTL, and, consistent with the findings here and reported by Hersey et al. (12) and Egnell et al. (14), the Reference Intakes performed worst. This could be because customers require the FOPL to include information giving an indication of the healthiness of the food, rather than solely providing nutritional information that requires interpretation. This may be unrealistic in a shopping scenario that is typically time limited and also unrealistic for most people. Studies have indicated that nutrition knowledge is associated with level of education (49) and SES (50), meaning that individuals from less educated and poorer background are likely to find interpreting food labels more challenging. This is particularly important given the marked inequalities seen with obesity, especially for children (51, 52). There was no strong evidence of an effect on outcomes by SES (or other demographic factors) from the studies in our review, although only two studies reported results by SES. One study found no effect by SES and one found a less pronounced but significant reduction in purchasing in those of lower SES, with NutriScore performing best in this group. This suggests that, even if to a lesser extent, individuals of lower SES may be able to take advantage of the information in FOPL to make healthier purchasing decisions. However, there is some evidence to suggest that pre-existing nutrition knowledge is lower for low SES households, which implies FOPL may provide fresh insight compared to higher SES groups for whom baseline knowledge is likely to be higher. Another study, which used real purchasing data from the UK, found that FOPL reduced purchasing of ‘unhealthy’ products to a greater extent in households of lower SES compared to higher SES (53).
The present review could not quantify the effect of FOPL according to product, although there was some evidence that FOPL may have an impact when they provide unexpected information. One of the ITS studies found significant reductions in the purchasing of juice and cereals but not chocolates, candies and cookies; it was hypothesised that information disclosure may only be effective at reducing purchasing when the information is unexpected (i.e. juice and cereals are not typically viewed as ‘unhealthy’) (43). However, this is in contrast to a more recent study that found changes in purchasing for most products but no change for cereals, with a possible explanation being that consumers may use FOPL less for products perceived as healthy (47). A study looking at changes in knowledge with FOPL found smaller increases in knowledge for cereals compared to cakes (14). These findings require further exploration to establish how FOPL schemes impact on purchasing patterns of different products.
FOPL also has the potential to act via product reformulation at an industry level, as per the logic model proposed on the Cochrane review(3). The experimental studies identified in the present review are unable to capture these changes, whereas the healthier purchasing observed in the real-life studies could reflect changes at both an individual and industry level, although we are unable to quantify the relative effects of each, and there is some evidence from other studies to support this (10, 11, 54, 55). However, a recent study found minimal reformulation prior to implementation of the mandatory Chilean warning label scheme (56).
In terms of possible negative effects from FOPL, there was little evidence of unintended consequences; one study found some evidence of a ‘backfire effect’, where consumers eat more of a product if the calorie information is lower than they were expecting (36). In that study, calorie and serving size information was provided on unhealthy products, and the ‘backfire effect’ was proposed to have occurred because of the small perceived serving size and hence level of calories for this modest serving (36).
Policy implications
There is globally interest in implementing FOPL schemes as a means of promoting healthier purchasing and consumption (4). There is good evidence that FOPL can improve knowledge and the findings reported here suggest that it encourages healthier purchasing. These data support the use of FOPL as a mechanism for improving the healthiness of purchasing, which may contribute to reducing obesity. Labelling is only one influence on food purchasing, although our evidence suggests that it is likely to contribute to public health efforts with respect to improving the population level diet. In terms of the potential impact of FOPL on diet, this is difficult to quantify, although we can estimate the likely impact across a ‘typical’ month of shopping through an additional analysis. Here, we focus on sugar and calories because these are key dietary targets for addressing obesity and therefore highly policy relevant. Separate household level data from the Kantar World Panel, analysed by colleagues at the Institute of Fiscal Studies, shows that the average weight of monthly household food purchases across the period 2012–2016 was 77.9 kg and that the average size of the household was 2.75 individuals. Application of the pooled mean effects found in the present review for energy (−2.03 kcal 100 g food−1) and sugar (−0.403 g 100 g food−1) to this monthly shop suggests that there are likely to be monthly changes in energy and sugar in the order of −1581 kcal and −314 g sugar, respectively, across household monthly food shopping. The average reductions per person per day that these equate to can then be estimated; −19.16 kcal and –3.81 g sugar per person per day. Data from the National Diet and Nutrition Survey (2014–2016) show a mean daily intake per person for UK adults aged 19–64 years of 7.82 megajoules (approximately 1870 kcal) and 57.1 g free sugars (57). The pooled mean change for kcal observed in our review equates to reductions per person (assuming the household is made up of 2.75 adults) per day of 1.0%. Assuming that the sugar reductions observed are entirely from free sugars and that the household is made up of 2.75 adults, the pooled mean change for sugar observed in this review equates to reductions per person per day of 6.7%.
Limitations
The limitations of this review include the small number of included studies that examined DIG and NutriScore, and the limited data comparing individual schemes meaning that meta-analysis was not possible. Care also needs to be taken when interpreting the meta-analysis results because the studies differed greatly, as indicated by the high heterogeneity between ‘high in’ and MTL for energy (kcal 100 g−1). The outcome of purchasing is insightful, although it does not necessarily equate to consumption and it is also not possible to understand consumption at an individual level because many outcomes were measured at the household level. We also included purchases that were experimental or hypothetical in nature (not using their own money), and so care with interpretation is needed, although all studies strongly replicated actual retail environments. The risk of bias for the experimental studies was moderate to high for the consumption studies and mostly moderate for the purchasing studies. The study quality was high for the ITS studies. Overall, study quality was reasonable, albeit mixed. The search strategy was carefully planned and built upon the Cochrane review search to capture the relevant research and the double-screening processes gives confidence in the final includes. We identified 14 new studies, five which we were able to meta-analyse, published subsequent to 2017 and most of these had low bias concerns, allowing us to have reasonable trust in the results. As a result of our approach in adopting a more inclusive eligibility criteria than the Cochrane review, as well as the narrow timeframe of our searches, there are possibly earlier studies that exist that we have not considered. This research area is very active and is policy relevant. This review provides a good platform for further work, including updated meta-analyses as more studies are published or extending outcomes to examine the effects of FOPL on purchase intentions.
Conclusions
The present review provides evidence from both experimental and ‘real-life’ studies that FOPL schemes encourage healthier food purchasing behaviours. Labels including an interpretative message (which goes beyond the simple provision of nutritional information) appear to have greater potential for impacting behaviour. In particular, we found evidence from experimental studies to support ‘high in’ and MTL FOPL and evidence from ITS studies for ‘high in’, traffic light and GDA. The results reported here supplement the existing evidence that FOPL on prepackaged products has the potential to encourage healthier purchasing and potentially improve the diet quality of families. Our analyses suggest that the impact on sugar, calories, saturated fat and sodium in household purchases may be substantial. Further research is required to extend understanding of the effects of specific FOPL on purchasing and consumption, especially within UK contexts and in relation to effects according to product type and socio-demographic characteristics.
Acknowledgments
Conflict of interests, source of funding and authorship
The authors declare that they have no conflicts of interest.
This report is independent research funded by the National Institute for Health Research (NIHR) Policy Research Programme (Policy Research Unit: Obesity/PR-PRU-0916-21001). The views expressed in this publication are those of the authors and not necessarily those of the NIHR or the Department of Health and Social Care.
All authors participated in the protocol development. CS conducted the literature search. HC and JP screened and extracted the data from the literature. HC and JP wrote the first draft and all authors reviewed and commented on subsequent drafts and approved the final version submitted for publication.
Transparency declaration
The lead author affirms that this manuscript is an honest, accurate and transparent account of the study being reported. The reporting of this work is compliant with PRISMA guidelines. The lead author affirms that no important aspects of the study have been omitted and that any discrepancies from the study as planned (as specified in the registration with PROSPERO; PROSPERO CRD42019135743) have been explained.


