Identification of floodwater source areas in Nepal using SCIMAP-Flood
Funding information: Faculty of Humanities and Social Sciences Bid Preparation Fund at University of Newcastle; Institute of Hazard, Risk and Resilience, Durham University; NERC IAPETUS Doctoral Training Programme, Grant/Award Number: NE/L002590/1
Abstract
Practical approaches for managing flooding from fluvial sources are moving away from mitigation solely at the point of impact and towards integrated catchment management. This considers the source areas, flow pathways of floodwaters and the locations and exposure to the risk of communities. For a field site in southern Nepal, we analyse catchment response to a range of simulated rainfall events, which when evaluated collectively can help guide potential flood management solutions. This is achieved through the adoption of SCIMAP-Flood, a decision support framework that works at the catchment-scale to identify critical source areas for floodwaters. The SCIMAP-Flood Fitted inverse modelling approach has been applied to the East Rapti catchment, Nepal. For multiple flood impact locations throughout the catchment, SCIMAP-Flood effectively identifies locations where flood management measures would have the most positive effects on risk reduction. The results show that the spatial targeting of mitigation measures in areas of irrigated and rainfed agriculture and the prevention of deforestation or removal of shrubland would be the most effective approaches. If these actions were in the upper catchment above Hetauda or upstream of Manahari they would have the most effective reduction in the flood peak.
1 INTRODUCTION
Flood mitigation measures have historically been deployed at the point of impact to manage risk in catchments (Calder & Aylward, 2006; Evans et al., 2002; Lane, 2017; Nisbet et al., 2011). However, integrated catchment management (ICM) offers an alternative, where areas of the catchment responsible for generating floodwaters to impacted communities are identified and more precisely targeted with appropriate flood management measures. The identification of critical source areas (CSAs) is key within this process. CSAs are defined as hillslope areas that produce rapid overland runoff and which are well connected to the channel network (Heathwaite et al., 2005). Flood management measures can attempt to either disconnect these areas of high connectivity or, alternatively, increase storage capacity downstream of areas generating overland flow; the overall result being an alteration to the overall catchment hydrological response (Metcalfe et al., 2017). Alternative catchment measures include utilising floodplain storage and altering river conveyance to slow the flow of water through the channel network and reduce flood peaks (Acreman & Holden, 2013; Dixon et al., 2016; Odoni & Lane, 2010; Quinn et al., 2013). However, the influence of diffuse flood management measures may vary with event magnitude and have both positive and negative effects across the catchment. For example, changes in flood attenuation have the potential to increase or decrease the peak flow downstream through synchronisation, or desynchronisation, respectively (Hooijer et al., 2004; Lane, 2017; Turner-Gillespie et al., 2003). Consequently, it is essential to consider modes of flood wave propagation when selecting catchment locations for flood management measures (Dixon et al., 2016; Pattison et al., 2014).
Capable of providing a rapid assessment and mapping of flood hazard areas, geospatial data and GIS analysis has become an essential tool to help inform the design and planning of measures to reduce flood risk (e.g., Abdelkareem, 2017; Benavidez et al., 2016; Jackson et al., 2013; Patrikaki et al., 2018). Other studies have used geospatial data-driven frameworks to identify runoff CSAs in catchments from the perspective of land management, such as in managing diffuse pollution, but not from the perspective of flood management (e.g., Ameri et al., 2018; da Silva et al., 2012; Hlaing et al., 2008; Leh & Chaubey, 2009). Only a few tools exist which merge two key elements: flood hazard assessment and the identification of floodwater source areas. One such approach is the use of geomorphic unit hydrographs to target sub-catchments (e.g., Roughani et al., 2007; Saghafian et al., 2010, 2013; Saghafian & Khosroshahi, 2005; Sulaiman et al., 2010). There is limited research using distributed geospatial data and GIS analysis to assess where spatially targeted flood management measures can best be implemented to reduce flood risk to multiple communities throughout a catchment. The full combination of the spatial and temporal variability in patterns of rainfall, land cover, hydrological connectivity and the distribution of communities across a catchment is often not considered.
In Nepal, the current preference for flood management often involves reactive, localised interventions placed in flood-affected areas (Dhakal, 2013). A shift towards an ICM approach is deemed necessary to enhance catchment function and reduce flood risk (Dhakal, 2013; Nepal et al., 2014). Many catchments in Nepal are experiencing negative impacts to the hydrological regime through land-use changes, such as terrace abandonment (Gardner & Gerrard, 2003; Paudel et al., 2014), deforestation (Chaudhary et al., 2016; Gilmour et al., 1987; Ives & Messerli, 1989) and urbanisation (Rimal et al., 2019), with potential consequent impacts on flooding.
This study applies SCIMAP-Flood (Reaney, 2022), a catchment-scale decision support framework that uses geospatial data to identify CSAs of floodwater and informs the spatial targeting of flood management measures. SCIMAP-Flood can be used in both data-sparse and data-rich catchments. Implementation in data-sparse catchments is achieved using openly available elevation and land-cover datasets in tandem with regional resolution data, such as gauged rainfall data. Applying the SCIMAP-Flood approach to the relatively data-sparse East Rapti catchment in Nepal, this study aims to: (i) determine the flood source areas and key drivers of fluvial flooding, and (ii) identify locations where flood management measures would have a positive effect on the multiple flood-impacted areas within the catchment. We (iii) assess the sensitivity of the SCIMAP-Flood output by varying the quality and resolution of geospatial data inputs and by evaluating variations in locations identified for spatial targeting of flood mitigation measures.
2 METHODS
2.1 Study area
The East Rapti River drains a 3084-km2 sub-catchment of the Nayarani River catchment, located in southern central Nepal (Figure 1). The catchment has a maximum elevation of 2599 m above sea level (ASL) and in the higher elevation hills in the northern part of the catchment the slope ranges between 20° and 74°. The minimum elevation (145 mASL) is in the western part of the catchment at the confluence with the Narayani River. Large flat areas (slopes <10°) dominate the western part of the catchment; most of the population live in this agriculturally productive floodplain area (Singh, 2013). The dominant land cover (58%) is forestry (Shrestha et al., 2008). The study area includes parts of the Chitwan National Park, which extends along the southern bank of the main East Rapti River channel. A further 32% of the land-use is agriculture with settlements occupying 4%.
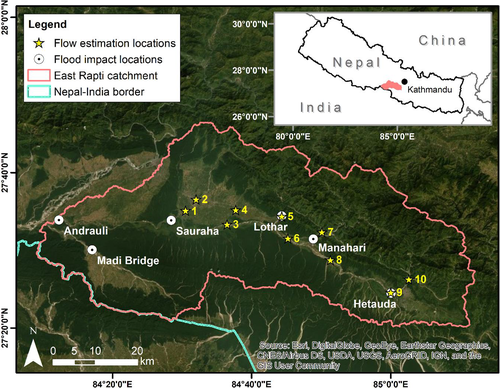
The flow regime in the East Rapti catchment, and across much of Nepal, is heavily controlled by the monsoonal rains (June–September), with 80% of the total rainfall and river flow occurring during this period (Andermann et al., 2011). There have been several major monsoon-related flood events documented in the catchment with the most recent occurring in 2017. Other notable flood events occurred in 1954, 1971, 1975 and 1993 with the 1993 flood being the most damaging with 24 deaths and over 5300 households affected (Singh, 2013).
2.2 SCIMAP-Flood
SCIMAP-Flood is a variant of SCIMAP, a decision support framework originally developed to identify diffuse pollution sources. It uses minimal information to provide a risk-based analysis at the catchment-scale (Reaney, 2022; Reaney et al., 2011). SCIMAP-Flood has been developed to gain an understanding of the runoff regime at a catchment-scale using the principles of hydrological connectivity. SCIMAP-Flood identifies CSAs for floodwaters based on spatial patterns of rainfall and land cover, the incorporation of transmission times across the catchment, and modelling of hydrological connectivity. A technical overview of the SCIMAP-Flood framework is available in Reaney (2022).
The SCIMAP-Flood approach used in this research to identify areas for the spatial targeting of flood management measures is shown in Figure 2 and includes the use of an inverse modelling approach with SCIMAP-Flood Fitted to derive optimised land cover weighting values.
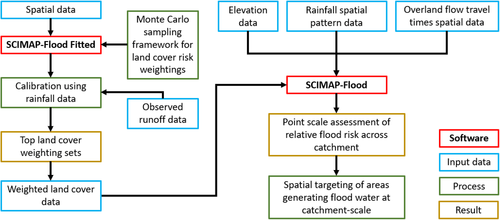
Local runoff generation potential is based on a combination of land cover, land management, soil properties and slope gradient (Bracken & Croke, 2007; Kirkby et al., 2002; Reaney et al., 2014). With the minimal information requirement of SCIMAP-Flood, these interrelated factors are simplified such that land cover is taken as the dominant factor and is scaled with slope gradient; a flood risk generation weighting is then assigned to the catchment land covers based on either expert definition or fitted to an observed pattern of flood magnitude. The hydrological connectivity is calculated from elevation data and is determined using the network index (Lane et al., 2004). Overland flow travel times are used within SCIMAP-Flood to determine the magnitude of a flood event due to the synchronisation of flows from sub-catchments. A simplified geomorphic unit hydrograph approach is used to calculate overland flow distance based on the Digital Elevation Model (Rigon et al., 2016). The median travel distance across the catchment to each flood impact point is given the highest weighting value with the values of the other individual cells across the domain being assigned travel times values that are rescaled linearly based on the comparative distance to the median.
2.3 East Rapti catchment data for SCIMAP-Flood
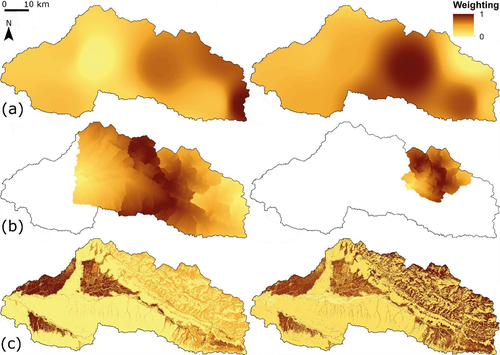
The SCIMAP-Flood framework requires four main data sources to operate: a digital elevation model, overland flow travel times, rainfall and land cover data. Examples of the weighted input data used for the East Rapti catchment are shown in Figure 3.
The ALOS global digital surface model (DSM) (AW3D30) was used for this study since it is an openly accessible global DSM with a spatial resolution of 30 × 30 m based on the average elevation values of a 5-m version (Tadono et al., 2014; Takaku et al., 2014). Using this data, the flow path lengths from the upstream catchment to the point of impact were calculated to predict the overland flow travel times for six locations within the East Rapti catchment (Figure 1). These locations were chosen as they were either settlements that were impacted in the 2017 floods or are vulnerable settlements close to the main channel network.
A combination of gauged rainfall data from the Government of Nepal's Department of Hydrology and Meteorology (DHM) and the Tropical Rainfall Measuring Mission (TRMM_3B42_Daily) satellite rainfall data (Huffman et al., 2007) was used to determine the spatial rainfall pattern. Daily rainfall data was acquired for the period 1998–2016 for eight DHM rainfall gauges around the catchment. A combination of gauged rainfall estimates, and bias-corrected satellite rainfall estimates was deemed necessary to compensate for areas poorly represented by the gauge network. To create the combined daily rainfall grid, a monthly bias correction approach using TRMM data has been adopted. The rainfall totals for each month were calculated for each rain gauge and compared against the monthly total rainfall estimate of the corresponding TRMM tile. This process produces a bias adjustment factor for each month. To spatially distribute the bias adjustment factor across the catchment, a Theissen polygon method using the DHM rain gauge locations was used. TRMM rainfall data in areas poorly captured by the DHM gauge network was adjusted at a monthly resolution, using the bias adjustment factor based on the closest DHM rainfall gauge using the Theissen polygon output. With the rainfall input data for SCIMAP-Flood at a sub-monthly resolution, the distribution of monthly to daily rainfall was calculated by attaining the percentage of total monthly rainfall for a given day in that month from the TRMM data and applying this percentage to the bias-adjusted monthly rainfall totals. The gridded product was created using an inverse distance weighted function using daily totals to create an interpolated grid over the catchment (Figure 3). This approach of scaling at a monthly temporal resolution was based on similar research utilising TRMM satellite data, with a combined approach successfully implemented in other data-sparse catchments (e.g., Arias-Hidalgo et al., 2013; Liu et al., 2017).
To identify CSAs of floodwater in the East Rapti catchment, it was necessary to determine the rainfall patterns responsible for the highest river flows across the catchment for the period 1998–2016; as mentioned above, this period had both gauged and satellite rainfall data available. The spatial distribution of rainfall in the buildup to and during high-flow events is required to help determine floodwater generating areas. The rainfall total for 5 days preceding the flow was considered part of the event rainfall total to account for the antecedent conditions. The 10 highest magnitude flow events were selected based on daily mean flow data within the catchment ranking each day between 1998 and 2016. To achieve this selection, the daily river flow for the three DHM flow gauges in the catchment (DHM station numbers 460, 465 and 470) were normalised to between 0 and 1. These three flow values were multiplied to indicate flow magnitude for each day across the catchment.
The East Rapti land cover data was created through supervised classification using maximum likelihood classification (Otukei & Blaschke, 2010), derived from a combination of Landsat 8 satellite imagery, slope and aspect data, generated from the AW3D30 elevation data. The land cover SCIMAP-Flood risk weightings were attained using the SCIMAP-Flood Fitted approach (see Section 2.4). The inclusion of ancillary information, such as slope, has been used previously to improve supervised classification of land cover in mountainous landscapes (e.g., Bahadur, 2009). At 30-m resolution, the Landsat 8 satellite imagery was selected in preference to higher resolution imagery due to the existing cell size limitation of the 30-m elevation data. The accuracy of the classified Landsat images was assessed through a random sampling approach, with 200 sample points generated across the catchment. The pixel class under each point was compared against high-resolution satellite imagery and aerial photographs. The Landsat 8 imagery was grouped into one of seven classes representing the dominant land cover within the East Rapti catchment (Table 1).
| Land cover class | Description |
|---|---|
| Rainfed agriculture | Terraced agriculture in the steeper, upland areas of the catchment |
| Irrigated agriculture | Areas of agriculture in the flat, lowland parts of the catchment |
| Shrubland | Areas with a mix of non-agricultural vegetation |
| Forest | Areas consisting of a mosaic of evergreen and deciduous forest |
| Bare ground | Areas with no vegetation, including dry river channels and bare rock |
| Builtup area | Residential and commercial areas and the road network |
| Water | Water bodies and rivers |
With a range of suitable geospatial data that can meet the requirements to run SCIMAP-Flood, it is necessary to assess the sensitivity of the SCIMAP-Flood output to rainfall and overland flow travel time data. To achieve this, three different sources of rainfall data were tested: (i) storm selection variation using only the five largest storm events; (ii) a spatially coarse but less time-intensive approach using only TRMM satellite data for the 10 largest storm events; and (iii) temporal resolution variation using monsoonal rainfall patterns with the TRMM satellite rainfall data. For these simulations, the overland flow travel time data, and the top 10 land cover weighting sets (Section 2.4) remained constant. The monsoonal rainfall patterns covered the total rainfall between May and September for the years 1998 to 2016. Further simulations varied the overland flow travel time data by iteratively removing each one of the six flood impact points and running SCIMAP-Flood with the remaining five flood impact points, the rainfall patterns for the 10 largest rainfall events and top 10 land cover weighting sets. The results of the sensitivity analysis are shown in Section 3.3.
2.4 SCIMAP-Flood Fitted
The risk weightings for each of the main land covers were determined using an inverse modelling approach, here called SCIMAP-Flood Fitted. This approach follows the method of Mosegaard and Tarantola (2002), in which observations are reproduced by inverting a forward model to predict the model parameters. This approach has been successfully applied elsewhere, including using SCIMAP to make assumptions about the drivers of river water quality patterns (Milledge et al., 2012; Reaney et al., 2011). A detailed description of the inference of land cover risk weightings using a fitted version of SCIMAP with measured instream nutrient concentrations is provided in Milledge et al. (2012); their approach is underpinned by the assumption that some land-use classes are more likely to generate diffuse pollution risk than others. In this research, the fitted approach of SCIMAP-Flood is underpinned by the assumption that some land covers have a higher potential to generate runoff than others.
The inverse modelling approach can be used to attain information on the influence of a specific land cover on the generation of overland flow. Land covers with below-average weightings (<0.5) will lower the risk of flow generation, whereby risk decreases as the weighting tends to zero. Land covers with above-average weightings (>0.5) tending to 1 will increase the risk of flow generation. The approach uses a Monte Carlo sampling framework, based on the GLUE approach (Beven & Binley, 1992), to deduce the land cover risk weightings. Here, 15,000 model simulations were undertaken with randomly selected weightings of between 0 and 1 based on a uniform distribution for each land cover category. This was based on a uniform distribution, with no a priori likelihood assigned. For each simulation, an objective function was determined to quantify the level of association between the estimated risk indicator and the spatially corresponding SCIMAP-Flood risk estimate. The objective function used here was the Pearson correlation coefficient. This was selected as it offers an appropriate solution for the continuous nature of the SCIMAP-Flood Fitted outputs. The estimated risk indicators used were the peak discharges associated with the August 2017 floods in the East Rapti (Section 2.5). This event was chosen as it was a high magnitude flood event and there was the opportunity to collect post-event data to help ascertain appropriate land cover risk weightings. The Pearson correlation coefficient is then used to detail the level of association between the August 2017 peak flow estimates and the corresponding SCIMAP-Flood risk estimates for each of the 15,000 model simulations. The model simulations with the correlation coefficient closest to 1 are determined to have a land cover weighting set that best represented the runoff generation in the East Rapti catchment. Acknowledging the concept of equifinality which underpins the GLUE approach, values from the best 10 land cover weighting sets are used in the final SCIMAP-Flood runs (Beven, 2006; Pechlivanidis et al., 2011).
2.5 East Rapti catchment data for SCIMAP-Flood Fitted
The AW3D30 elevation data were not of sufficient resolution or from a contemporaneous date for accurate characterisation of the channel conditions being modelled. Therefore, a higher-resolution digital elevation model was generated following the acquisition of images during a helicopter survey conducted in January 2018. The flight survey at 800 m altitude coincided with the low flow period, maximising the visible cross-sectional area. ‘Structure-from-Motion’ was used to generate a set of final elevation products for the area around each of the 10 cross-section locations (Westoby et al., 2012). For the 10 cross-section locations a set of between 13 and 96 50.6-megapixel images were processed with Agisoft Metashape Pro to build a DSM. The horizontal resolution of the models varied between 0.4 and 0.6 m across the 10 cross-section locations.
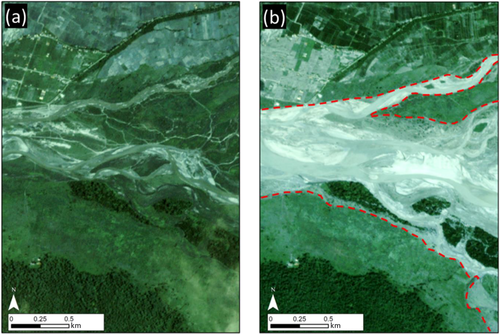
To determine the peak inundation extent of the August 2017 event, high-resolution (3 m) satellite imagery (Planet Team, 2017) taken from both before and after the August 2017 flooding was used. An example of this imagery is provided in Figure 4 where the peak inundation extent can be identified from extensive sediment deposits. Through the integration of these two datasets, the cross-sectional area, wetted perimeter and local slope through the cross-section could be extracted. Cross-section averaged velocities were empirically derived from flow gauging results undertaken throughout the East Rapti catchment in May 2018 (Table 2).
| ID | Channel area (m2) | Manning's n | Estimated discharge (m3/s) | Catchment area (km2) | Runoff depth (mm) |
|---|---|---|---|---|---|
| 1 | 154 | 0.0422 | 223 | 223 | 87 |
| 2 | 62 | 0.0422 | 85 | 92 | 79 |
| 3 | 1803 | 0.0484 | 3476 | 1518 | 198 |
| 4 | 15 | 0.0422 | 13 | 49 | 23 |
| 5 | 202 | 0.0484 | 579 | 169 | 295 |
| 6 | 1391 | 0.0484 | 2519 | 1156 | 188 |
| 7 | 362 | 0.0663 | 1303 | 425 | 265 |
| 8 | 569 | 0.0484 | 1223 | 605 | 175 |
| 9 | 374 | 0.0484 | 739 | 426 | 150 |
| 10 | 212 | 0.0663 | 551 | 292 | 163 |
Analysis indicated three classes of channel roughness in the East Rapti River. A Manning's n value of 0.0422 was calculated from the field data for the Terai plains in the downstream part of the catchment, a value of 0.0484 was calculated for the main East Rapti channel and large tributary channels and a value of 0.0663 was calculated in the steeper upstream locations in the northern part of the catchment. Incorporation of this data enables estimation of peak discharge for the observed inundation extents at each of the 10 locations within the East Rapti catchment. Flow estimates were then normalised by the catchment area to give runoff depth (mm).
3 RESULTS
3.1 Determining land cover risk weighting values from SCIMAP-Flood Fitted
Pearson correlation coefficients for the 15,000 model simulations (Figure 5a) and the top 750 simulations (5%; Figure 5a) illustrate the highly correlated land cover weighting value patterns. The top 10 land cover weighting sets, those with the Pearson correlation coefficient closest to 1, are taken forward to the final SCIMAP-Flood simulations.
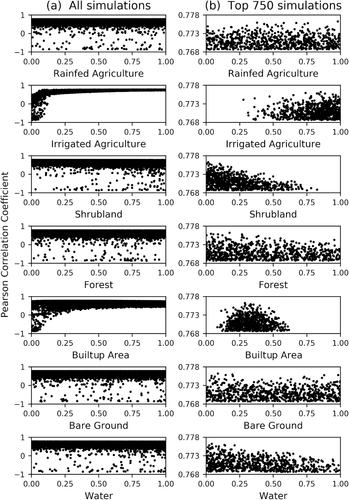
The irrigated agriculture class weightings show an improving correlation with the risk weighting value between 0.75 and 0.90. The builtup area land cover weighting value has the highest correlation coefficient between 0.20 and 0.40. The correlation coefficients increased for the shrubland, water and forest classes as the risk weighting value is closer to 0; this is most apparent for shrubland. The rainfed agriculture and bare ground classes show no discernible association between land cover weighting value and correlation coefficient with weighting values spanning the entire 0 to 1 range having correlation coefficients in the top 5%.
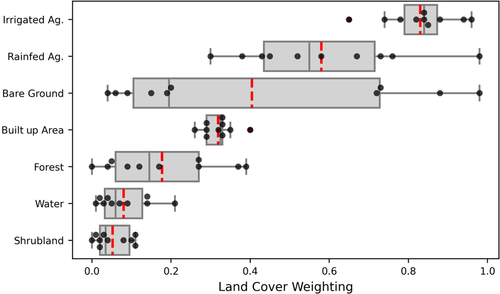
The SCIMAP-Flood weightings for each of the 7 land covers from the top 10 land cover weighting sets are shown in Figure 6. Of the top 10 weighting sets, the irrigated agriculture (0.65–0.96), shrubland (0.00–0.11), forest (0.00–0.39), builtup area (0.26–0.40) and water (0.01–0.21) class values are all constrained with a modal value either above or below 0.50. The irrigated agricultural weightings exhibit a higher potential to generate flow with all values >0.50. Shrubland, forest and water have the lowest risk weightings with the lowest potential for flow generation. With forest comprising 58% of the catchment, this implies a large proportion of the catchment currently has a low potential for flow generation. The weighting for the builtup area land cover class also had a below-average risk of flow generation. The values from the SCIMAP-Flood Fitted approach for rainfed agriculture and bare ground are less constrained with values between 0.30 and 0.98 for rainfed agriculture and 0.04 and 0.98 for bare ground. SCIMAP-Flood risk weightings for these two land covers are uncertain, with values signifying both a low and high risk of flow generation. Using the top 10 weighting values rather than one weighting value allows this range to be accounted for.
3.2 Identifying flood source areas using SCIMAP-Flood
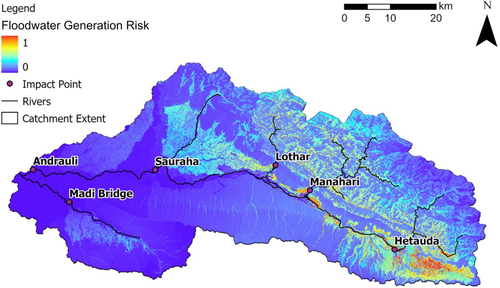
SCIMAP-Flood was used to identify areas within the East Rapti catchment that are more likely to generate floodwater during a high-flow event (Figure 7). Using the rainfall patterns associated with the 10 largest recent flow events, the top 10 land cover weighting sets from the SCIMAP-Flood Fitted inverse modelling approach and the six flood impact points overland flow travel time data, it is evident from this dataset that the eastern part of the East Rapti catchment near Hetauda is most likely to be the source of floodwater to the respective flood impact points. There are also areas along the main East Rapti channel and in the northern sub-catchments that were identified as having a higher floodwater generation potential than the catchment on average. This dataset is available in Reaney and Pearson (2022).
3.3 Sensitivity analysis of the SCIMAP-Flood inputs
Overall sensitivity to the SCIMAP-Flood inputs (Figure 8) was assessed using point density analysis comparing the coverage of areas with a flood risk value of >0.50 (more likely to generate floodwater) and >0.75 (very likely to generate floodwater). Most areas with a SCIMAP-Flood value of >0.50 are relatively insensitive to either the spatial or temporal resolution of the rainfall or the selection of flood impact points tested in this study. These areas are to the east of Hetauda, along the main East Rapti channel and in the northern part of the Lothar sub-catchment. Areas within the northern part of the Manahari sub-catchment are more sensitive to the selected SCIMAP-Flood inputs, having a SCIMAP-Flood value >0.50 in fewer than 50% of the sensitivity runs.
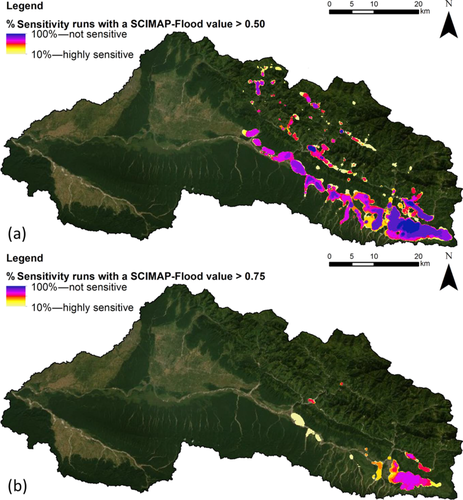
The process of identification of areas with a SCIMAP-Flood value of >0.75 is more sensitive to the SCIMAP-Flood inputs. These are the areas that are most likely to generate floodwaters to the flood impact locations within the catchment. The least sensitive area is to the immediate east of Hetauda featuring in >50% of the sensitivity runs. The parts of the catchment with a SCIMAP-Flood value >0.75 along the main East Rapti channel downstream of Hetauda are more sensitive to the SCIMAP-Flood inputs. It must be noted however that the more sensitive >0.75 areas still featured in areas >0.50 and therefore are still identified as having a higher-than-average potential for generating floodwater to the flood impact locations within the catchment.
4 DISCUSSION
4.1 Identifying locations for catchment-scale flood management measures in the East Rapti catchment using SCIMAP-Flood
The implementation of flood management measures at the catchment-scale should target source areas of flooding while minimising the possibility of increasing the risk of flooding at the flood impact areas within the catchment (Hooijer et al., 2004; Lane, 2017; Turner-Gillespie et al., 2003). With varying hydrological connectivity and land cover throughout the catchment producing variations in overland flow travel times and spatially diverse rainfall patterns associated with flooding events, there needs to be an approach that effectively integrates flood generating factors at the catchment-scale. The SCIMAP-Flood approach achieves this using limited data and lower computational cost than two-dimensional hydraulic modelling.
The spatial targeting of flood management measures can be achieved by reconsidering the initial SCIMAP-Flood output. Through reinterpreting the floodwater generation potential output in Figure 8 it is possible to consider the benefit of placing an intervention in any part of the catchment. This reinterpretation of the SCIMAP-Flood output, using point density analysis, is illustrated in Figure 9. Areas within the East Rapti catchment where flood management measures would have the highest impact on the flood regime are shown in red and orange. Flood management measures would be best implemented in these areas. Measures sited in the areas depicted in blue, green and yellow would also be expected to reduce flooding. By identifying areas that have a high likelihood of generating floodwaters to the selected flood impact points, it is possible to develop catchment-scale flood management measures through targeted implementation. By examining the identified flood source areas and establishing if they are highly connected or in areas with high rainfall, the dominant flood drivers can be better understood. Thus, better information on the dominant driver of floodwater generation in the identified area can help inform the type of mitigation measure to be implemented (Section 4.2).
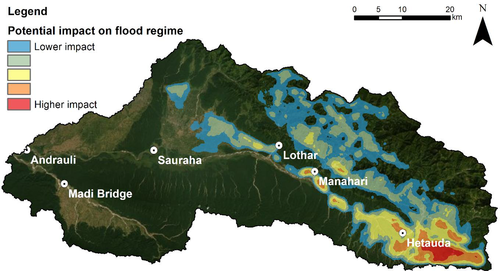
The SCIMAP-Flood results demonstrate that the eastern part of the East Rapti catchment near Hetauda had the greatest potential to generate floodwaters to the six flood impact locations and, as a result, this would be the area most appropriate to implement flood management measures from a catchment hydrology perspective. There were additional areas along the main East Rapti channel and in the upland areas of the Lothar, Manahari and Rapti sub-catchments that were also identified as having a higher floodwater generation potential. Consequently, these are also areas for the spatial targeting of flood management measures. Equally, these areas are also locations in which changes in the land use would have a negative effect. In the East Rapti catchment, and others in Nepal, land-use changes including terrace abandonment, deforestation and urbanisation are expected to increase the probability of flooding by increasing runoff generation potential (Chaudhary et al., 2016; Nepal et al., 2014). Managing such land-use changes at key areas identified at the catchment-scale could reduce the likelihood of increased flooding at the flood impact points in the future.
Notably, the builtup area land cover weightings derived here represented a below-average risk of flow generation. However, with a small areal coverage (4%) and a wide distribution between 0 and 1 across the top 750 model simulations (Figure 5), the final risk weightings given to builtup area could have been due to the limited impact of the land cover in the inverse modelling approach. It must be noted that, while the SCIMAP-Flood approach can be used to determine which flood management interventions could be most suitable for a chosen catchment, it is not designed to quantify how effective a given flood management scenario would be. For this, SCIMAP-Flood can create an effective set of possible land-use and management scenarios that can be assessed with a fully distributed catchment hydrological simulation model. This detailed simulation would be at a far greater computational cost but with more detail on the predicted changes in flows.
4.2 Determining flood source areas and key drivers of the flooding regime in the East Rapti catchment using SCIMAP-Flood
The SCIMAP-Flood results identified the parts of the East Rapti catchment that had the greatest potential to generate floodwaters to the six flood impact locations (Figure 8). Analysis through zonal statistics of the spatial data and SCIMAP-Flood inputs allows for the impact of key drivers of floodwater generation within the catchment to be assessed (Table 3).
| Land cover | % Of catchment area | Average slope (degrees) | SD slope (degrees) | Average network index | SD network index |
|---|---|---|---|---|---|
| Rainfed agriculture | 18.0 | 21.7 | 13.1 | 0.24 | 0.24 |
| Irrigated agriculture | 10.5 | 1.0 | 1.0 | 0.60 | 0.21 |
| Shrubland | 6.4 | 1.3 | 1.2 | 0.60 | 0.23 |
| Forest | 58.3 | 18.4 | 13.1 | 0.24 | 0.21 |
| Builtup areas | 4.4 | 1.5 | 1.2 | 0.55 | 0.21 |
| Bare ground | 1.6 | 6.5 | 6.8 | 0.56 | 0.30 |
| Water | 0.9 | 1.3 | 1.5 | 0.66 | 0.24 |
The mean slope of the areas in the catchment covered in rainfed agriculture (21.7°) and forest (18.4°) was notably higher than the average slope of the other land covers in the East Rapti catchment (<6.5°). These areas of land cover with steeper slopes (>15°) cover a large proportion (76%) of the catchment. The location and extent of the certain land covers are defined by the slope with rainfed agricultural terrace and forest coverage in the East Rapti concentrated in the higher elevations of the catchment. Subsequently, slope is one of the key inputs for calculating the Topographic Wetness Index, and thus the network index (Lane et al., 2004). The large difference between the slope values across the different land covers is also reflected in the average network index values. The areas of lower slope, predominantly located to the northeast of Sauraha but also to the southeast of Hetauda, are better connected with a greater upslope contributing area and so can transfer water into the drainage network more easily. Regardless of the land cover risk weightings, the impact of variations in slope across the East Rapti and the large percentage coverage of high slope values are key factors in driving the generation of floodwaters at the flood impact points.
The spatial distribution of rainfall was another dominant factor when identifying areas that generated floodwater during high flows in the East Rapti catchment. The spatial rainfall patterns developed using the DHM gauged data and scaled TRMM satellite rainfall show the highest rainfall totals associated with the top 10 high-flow events recorded principally in the southeast of the catchment around Hetauda. This is one of the areas with a high potential to generate floodwaters (Figure 8). The variation in land cover weightings can act as a further driver of the flood regime. The identified high potential flood generating areas around Hetauda in the southeast of the catchment are dominated by irrigated agriculture. The dominance of land cover with a high relative flood generation weighting will increase the likelihood of floodwaters generated from the area.
SCIMAP-Flood can be used to identify flood source areas in a catchment through a combination of flood generation factors. Within the East Rapti catchment it is evident that the rainfall patterns associated with high-flow events are a key factor and, as a result, both the greater scale of relief in the north-eastern part of the catchment and the highly connected agricultural and builtup areas in the southeastern part of the catchment have a high relative potential to generate floodwater. With the East Rapti exhibiting catchment characteristics typical to those of catchments across the southern edge of Nepal, the rainfall pattern dominance in SCIMAP-Flood is likely to be prevalent in similar catchments.
Through varying the SCIMAP-Flood data inputs, an assessment of the sensitivity of the framework for identifying floodwater generating areas has been demonstrated. The areal coverage of the floodwater generating areas (SCIMAP-Flood value >0.50) was comparable with a low sensitivity to input variation in the model (Figure 7). Certain areas with the greatest flood generation potential (SCIMAP-Flood value >0.75) were seen to be highly sensitive to variations in inputs. These areas were identified as flood source areas (SCIMAP-Flood value of 0.50–0.75) and would be appropriate areas to consider for flood management measures. With no ‘perfect’ ensemble of scenarios of SCIMAP-Flood for a given catchment, an alternative approach could be to consider the overall sensitivity of the catchment to the range of SCIMAP-Flood inputs. Using the sensitivity output to identify the least sensitive flood source areas to variation in the SCIMAP-Flood inputs could help avoid placing interventions in areas only identified as having a high floodwater generating potential under limited input combinations.
5 CONCLUSION
This research demonstrates the identification of areas within a catchment that are responsible for generating floodwaters which impacts downstream communities. The spatial targeting of flood management measures can be achieved by evaluating the SCIMAP-Flood output to implement measures in the identified flood source areas. The SCIMAP-Flood approach enables the user to determine where flood management interventions could be most suitable given the land use in the flood generating parts of the catchment. However, SCIMAP-Flood is not designed to quantify how effective a given flood management scenario would be and therefore further modelling can then be used to assess to effectiveness of a given catchment-scale flood management scenario.
Designed to run using a minimal data approach, SCIMAP-Flood can be used in both data-sparse and data-rich catchments. There is no maximum catchment size for using SCIMAP-Flood and it can be used for rapid assessments for very large catchments (e.g., the Ganges) or when investigating the potential for nationwide flood management approaches. SCIMAP-Flood can be deployed using available global elevation models, remotely sensed and hence globally available rainfall, and land cover datasets for catchments with sparsely available local data. However, the sensitivity analysis of the East Rapti inputs highlighted the potential influence of variation in the required SCIMAP-Flood input data. Identifying areas with a low sensitivity to different SCIMAP-Flood inputs could help avoid placing interventions in areas only identified as having a high floodwater generating potential under specific input combinations.
Within the East Rapti catchment it is evident that the rainfall patterns associated with high-flow events are a key factor in the generation of floodwaters and, as a result, both the higher relief topography of the north-eastern part of the catchment and the highly connected agricultural area in the southeastern part of the catchment have a high relative potential to generate floodwaters. The SCIMAP-Flood results demonstrated that the eastern part of the East Rapti catchment near Hetauda had the greatest potential to generate floodwaters at the selected flood impact locations. There were additional areas along the main East Rapti channel and in the upland areas of the Lothar, Manahari and Rapti sub-catchments that were also identified as having a higher floodwater generation potential in relation to the rest of the catchment. It is in these parts of the catchment where implemented flood management measures would have the greatest positive impact on the flooding regime.
ACKNOWLEDGEMENTS
This research was funded by the Natural Environment Research Council as part of the IAPETUS Doctoral Training Programme (NE/L002590/1). The authors acknowledge the financial support donated by Charles Wilson through the Institute of Hazard, Risk and Resilience at Durham University, which funded fieldwork conducted by S. M. Reaney and C. J. Pearson. The authors acknowledge the financial support provided by the Faculty of Humanities and Social Sciences Bid Preparation Fund at the University of Newcastle, which funded the fieldwork conducted by M. T. Perks & B. Hortobagyi.
Open Research
DATA AVAILABILITY STATEMENT
The data that support the findings of this study are openly available in the Durham Research Online Datasets Archive at http://doi.org/10.15128/r1kp78gg43q


