Trends in abundance indices derived from commercial fisheries for priority marine stocks in the Azores
Abstract
Large-scale assessments of fish and shellfish populations may be valuable for identifying the impacts of fishing pressure on stocks, but they are rarely possible due to a lack of long-term datasets. In this study, a two-part mixed-effect model for lognormal data was used to obtain historical abundance indices for 16 priority fish and shellfish stocks in the Azores region derived from catch per unit effort (kg per day at sea per vessel) and landing per unit effort (kg per landing per vessel). This data was obtained over the past 30 years under the EC Data Collection Framework and, in addition to information on effort and catch, included details about the fishing operation such as quarter, vessel length and fishing gear. This information was analysed to investigate how abundance indices changed over the years, verify if trends from different data sources were different and, if possible, relate these results to the population and fishery dynamics. The abundance indices derived from both datasets were generally in agreement with each other. Declining trends have been observed for some commercially important species, such as forkbeard Phycis phycis, European conger Conger conger, parrotfish Sparisoma cretense, red scorpionfish Scorpaena scrofa, offshore rockfish Pontinus kuhlii, common spiny lobster Palinurus elephas, splendid alfonsino Beryx splendens and alfonsino B. decadactylus, which is concerning because they are particularly slow-growing, long-lived and have low natural mortality, making them susceptible to overfishing. The results of this study are very important and should help future stock assessment and management initiatives.
1 INTRODUCTION
Aquatic ecosystems on continental shelves and in the open ocean are responsible for almost half of the planet's primary productivity and 75% of the world's fisheries harvests (Field et al., 1998; Pauly & Christensen, 1995). Fisheries play an important role in the global food production system and their resources must be sustainably managed in a way that protects food security, livelihoods, human dignity and natural resources (FAO, 2022). Nevertheless, several fisheries have shown a trend of fast decline after an initial few years of high capture rates (Pauly & Zeller, 2016). This widespread decline of important living resources has raised concerns about the consequences of overfishing on local communities (Vianna et al., 2020).
The global community has established some conservation and sustainable use plans for oceans, seas and marine resources. The United Nations Convention on Biological Diversity (CBD), which came into effect in 1993, marked the beginning of a new era for global conservation. It has three main objectives: the conservation of biological diversity, the sustainable use of the components of biological diversity, and the fair and equitable sharing of the benefits arising out of the utilization of genetic resources (UN, 1992). In the 2030 Agenda for Sustainable Development and Sustainable Development Goals (SDGs), world leaders acknowledged the importance of marine biodiversity to sustainable development, and they also stressed how important it is to take action to improve marine biodiversity conservation and sustainable use (UN, 2015).
With regard to the sustainable use of living marine resources, SDG 14 Life below water had a target of 100% of fish stocks within biologically sustainable levels by 2020. It meant that, by 2020, fish stocks had to be restored and maintained above levels capable of producing the maximum sustainable yield (MSY), i.e., the highest amount of fish that can be taken from a stock without affecting its reproduction (UN, 2015). However, the latest assessment performed by the FAO Fisheries and Aquaculture Division of the global indicator indicated that the 2020 target was not achieved (FAO, 2022).
An essential requirement for the stock restoration includes a comprehensive understanding of the composition and abundance of unexploited populations relative to those of the present time, and this trend is even considered by the CBD as a biodiversity indicator to evaluate progress toward its targets. The improved awareness of large-scale changes in marine resource abundance helps managers evaluate and respond to local fishery issues, and it enables local measures to be coordinated to solve regional or state-wide management challenges. On the other hand, these large-scale stock assessments are difficult to do due to a lack of long-term datasets (Gordon et al., 2018; Izzo et al., 2016; Schwerdtner Máñez et al., 2014).
The Azores is a Portuguese archipelago located in the North Atlantic Ocean, between 36° and 40°N and 24° and 32°W. In this region, fishing has always been an important means of subsistence and is traditionally concentrated in small-scale fishery communities. To prevent and mitigate the fishing impact on the living marine resources, fishery-dependent (e.g., catch, effort, discard) and survey-derived data have been systematically collected in the Azores for the main commercial species since the 1990s (Santos et al., 2020b). In recent years, efforts have been made to analyse these data and enhance the quality of input information for the assessment of certain stocks identified as priority in the Azores under SDG Indicator 14.4.1 ‘Proportion of fish stocks within biologically sustainable levels’ (Medeiros-Leal et al., 2021; Santos et al., 2020a, 2021a, 2021b, 2022a, 2022b).
The prioritization process of the Azorean stocks was based on the economic, ecological and sociocultural relevance of the exploited resources and excluded those that are known to migrate through or occur in multiple Exclusive Economic Zones (EEZs), also known as straddling stocks (e.g., tuna and tuna-like species) (Santos et al., 2020b). Despite the scientific efforts mentioned above to improve the input information for assessment, the stock status remains uncertain for most of these priority stocks. In such circumstances, catch and effort are the most common information sources for inferring abundance trends over time and may play an essential role in resource management, although numerous elements (related to species characteristics and fisheries dynamics) must be previously examined and discussed (Maunder et al., 2006).
The fisheries management structure in the Azores is defined within the framework of the European Union (EU) Common Fisheries Policy (CFP) and the International Council for the Exploration of the Sea (ICES). The CFP is the EU's policy for managing fishing activity in its waters, and it aims to ensure sustainable fish stocks and a fair standard of living for fishers (EU, 2013). The ICES is an intergovernmental organization that provides scientific advice to the EU, which also covers the waters around the Azores. It is the main source of scientific advice for the CFP on fish stocks and the ecosystem, and plays a crucial role in assessing the health of fish stocks and providing recommendations for total allowable catches (TACs) (ICES, 2020a).
As the Azores is a member of the EU and ICES, it is obliged to follow the rules and regulations set by these organizations in relation to the management of their fish stocks. This includes following the scientific advice provided by ICES, implementing the TACs and quotas set by the EU, and incorporating measures for sustainable fishing practices. In 2021, the ICES provided catch advice for 12 fish stocks in the Azores ecoregion. Most of these species are deep-water species, consisting of demersal [blackspot seabream Pagellus bogaraveo (Brünnich, 1768), splendid alfonsino Beryx splendens Lowe, 1834, alfonsino Beryx decadactylus Cuvier, 1829, and greater forkbeard Phycis blennoides (Brünnich, 1768)], elasmobranch [thornback ray Raja clavata Linnaeus, 1758, tope shark Galeorhinus galeus (Linnaeus, 1758), Portuguese dogfish Centroscymnus coelolepis Barbosa du Bocage & de Brito Capello, 1864, leafscale gulper shark Centrophorus squamosus (Bonnaterre, 1788), porbeagle Lamna nasus (Bonnaterre, 1788), kitefin shark Dalatias licha (Bonnaterre, 1788)] and pelagic [blue jack mackerel Trachurus picturatus (Bowdich, 1825) and black scabbardfish Aphanopus carbo Lowe, 1839] stocks (ICES, 2022b). Due to limited data availability, these stocks are considered data-limited (category 3–5 stocks) and the fisheries for these stocks are managed in accordance with the precautionary approach. With the exception of P. bogaraveo found in Subarea 10 and T. picturatus found in Subdivision 10.a.2, the fish stocks present in the Azores ecoregion and currently assessed by the ICES are defined as parts of the Oceanic Northeast Atlantic stock units (ICES, 2022b).
As a contribution to the assessment of the state of the priority fish and shellfish stocks exploited in the Azores, catch per unit effort (CPUE) and landing per unit effort (LPUE) of the Azorean commercial fleet were analysed in this study to produce standardized abundance indices for 16 of 22 priority stocks. Abundance indices for P. bogaraveo, R. clavata, blackbelly rosefish Helicolenus dactylopterus (Delaroche, 1809), common mora Mora moro (Risso, 1810) and silver scabbardfish Lepidopus caudatus (Euphrasen, 1788) were not investigated in this study as they have already been estimated and discussed in prior scientific literature (ICES, 2020c; Mariño-Briceño et al., 2022; Santos et al., 2022b). The rough limpet Patella aspera Röding, 1798, on the other hand, was excluded as no catch data were available.
The goal of this study was to put together all of the fishery-related data that had been collected over the past 30 years for forkbeard Phycis phycis (Linnaeus, 1766), European conger Conger conger (Linnaeus, 1758), Mediterranean slipper lobster Scyllarides latus (Latreille, 1802), Atlantic chub mackerel Scomber colias Gmelin, 1789, parrotfish Sparisoma cretense (Linnaeus, 1758), blacktail comber Serranus atricauda Günther, 1874, veined squid Loligo forbesii Steenstrup, 1856, red porgy Pagrus pagrus (Linnaeus, 1758), red scorpionfish Scorpaena scrofa Linnaeus, 1758, offshore rockfish Pontinus kuhlii (Bowdich, 1825), T. picturatus, amberjacks nei Seriola spp. Cuvier 1816, common spiny lobster Palinurus elephas (Fabricius, 1787), B. splendens, B. decadactylus and A. carbo, look at how abundance indices changed over time, see if the trends from different data sources were different and, if possible, connect these results to species and fishing operational characteristics.
The data analysed in this study were obtained ethically as part of routine sampling of fisheries under the European Commission's Data Collection Framework (DCF) (EC, 2008). It is worth noting that the data were primarily collected for the purpose of monitoring fishing activities and not specifically for the research presented in this study.
2 MATERIALS AND METHODS
The data used in this study came from the database of the Department of Oceanography and Fisheries, University of the Azores (DOP/UAz) and were obtained from the Azores Auction Services and collected through fishing inquiries under the DCF. Official landings were recorded from 1985 to 2017 for each fishing trip (n = 3,679,979) and included vessel size, métier (i.e., a group of fishing operations targeting a specific assemblage of species, using a specific gear, during a precise period of the year and/or within the specific area; EC, 2008) and catch in kg by species. Between 1990 and 2017, 31,616 fishing inquiries were conducted to harbour-present vessel captains at the moment of landing. These inquiries were undertaken to complete the information for fishing effort and covered all fleet segments, with a focus on those that are not obliged to maintain a logbook (i.e., vessels <10 m in length) (DGRM, 2016). Each inquiry included the size of the vessel, the number of days it spent at sea and information about the fishing operation, such as the type of gear used, the average depth at which fishing took place and the catch in kg by species.
LPUE and CPUE were estimated for P. phycis, C. conger, S. latus, S. colias, S. cretense, S. atricauda, L. forbesii, P. pagrus, S. scrofa, P. kuhlii, T. picturatus, Seriola spp., P. elephas, B. splendens, B. decadactylus and A. carbo as kg landing−1 vessel−1 and kg day at sea−1 vessel−1, respectively. To reduce the influence of potential drivers (e.g., targeted species, vessel size, fishing gear) on these catch rates, generalized linear models (GLMs) were utilized to calculate standardized abundance indices (Santos et al., 2022b). The explanatory factors included in the analysis differed across the different datasets and are reported in Table 1.
| LPUE (kg landing−1 vessel−1) | CPUE (kg day at sea−1 vessel−1) | ||||
|---|---|---|---|---|---|
| Factor | Type | Observations | Factor | Type | Observations |
| Year | Categorical (33) | Period: 1985–2017 | Year | Categorical (27) | Period: 1990–2017 |
| Quarter | Categorical (4) | 1: January–March | Quarter | Categorical (4) | 1: January–March |
| 2: April–June | 2: April–June | ||||
| 3: July–September | 3: July–September | ||||
| 4: October–December | 4: October–December | ||||
| Vessel size | Categorical (5) | 1: ≤10 m | Vessel size | Categorical (5) | 1: ≤10 m |
| 2: >10 and ≤12 m | 2: >10 and ≤12 m | ||||
| 3: >12 and ≤18 m | 3: >12 and ≤18 m | ||||
| 4: >18 and ≤24 m | 4: >18 and ≤24 m | ||||
| 5: >24 and ≤40 m | 5: >24 and ≤40 m | ||||
| Métier | Categorical (10) | HDP: Hand picking | Gear | Categorical (5) | LL: Longlines |
| FPO_CRU: Pots and traps for crustaceans | HL: Handlines | ||||
| GNS_FIF: Gillnets for coastal demersal and pelagic fish | NT: Nets | ||||
| LHP_CEP: Handlines for cephalopods – squids | TP: Traps and pots | ||||
| LHP_FIF: Handlines for demersal fish | MG: Multigear | ||||
| LHP_MDP: Handlines locally called “corrico” for pelagic fish | Depth (mean depth of fishing gear) | Categorical (3) | 1: Shallow (<200 m) | ||
| LHP_LPF: Pole and lines for pelagic fish | 2: Intermediate (200–600 m) | ||||
| LLD: Drifting longlines for pelagic and demersal fish | 3: Deep (>600 m) | ||||
| LLS_DEF: Set longlines for demersal fish | Target effect (percentage of species-specific catch related to the total catch) | Categorical (4) | 1: First quartile (≤25%) | ||
| PS_SPF: Purse seines for small pelagic fish | 2: Second quartile (>25% and ≤50%) | ||||
| Target effect (percentage of species-specific catch related to the total catch) | Categorical (4) | 1: First quartile (≤25%) | 3: Third quartile (>50% and ≤75%) | ||
| 2: Second quartile (>25% and ≤50%) | 4: Fourth quartile (>75%) | ||||
| 3: Third quartile (>50% and ≤75%) | |||||
| 4: Fourth quartile (>75%) | |||||
The following equations express the general GLM formulations used in this study:
Two submodels were fitted to the data using a GLM approach that assumed a hurdle–lognormal error distribution (Lo et al., 1992; Zuur & Ieno, 2016). Using a binomial error distribution and a logit link function, the first submodel modelled the likelihood of a positive observation (nonzero catch) happening. Positive observations were analysed using a second submodel that assumed a lognormal (hurdle-lognormal) error distribution with an identity link function and log-transformed catch rates. The influence of each explanatory factor or interaction was assessed by evaluating the proportion of the deviation that was explained by adding a particular factor or interaction to the model, and the outcome of the chi-squared test when comparing two different models. Factors and interactions that significantly explained at least 5% of the variation were chosen as explanatory variables (Ortiz & Arocha, 2004). To find patterns in abundance over time when standardizing catch and effort data, it was necessary to include the year in the model, even if it was not statistically significant (Maunder & Punt, 2004). Details on the procedure for selecting the interactions and explanatory factors that explained most of the variability in the data, model validation and catch standardization can be found in Santos et al. (2022b).
After the standardization procedure, linear trend models were used to obtain the y intercept (a) and slope (b) that best fit the standardized annual CPUE and LPUE per species. The two regression lines were compared using analysis of covariance (ANCOVA) to identify which had significantly (P value <0.05) different a and b values. Differences in a were seen as differences in magnitude, while differences in b as differences in the rate of change. All statistical analyses were conducted using the software R (R Core Team, 2021) with the additional packages MASS (Venables & Ripley, 2002), emmeans (Lenth, 2021) and lme4 (Bates et al., 2015).
3 RESULTS
3.1 Catch and effort
The total catches from Azorean commercial landings displayed a fluctuating pattern during the studied period. In 1992, there was a decrease in the catches, but this subsequently recovered. In the late 1990s, catches began to decline again, but they started to increase once more in the early 2000s and reached a peak in 2010. After that, the catches showed a downward trend in more recent years as illustrated in Figure 1a. Catches recorded through fishing inquiries were very low until the early 2000s. After this period, the observed trend is very similar to that of commercial landings (Figure 1b). Regarding the fishing effort, it was variable across the years studied, but an overall increase in the number of landings has been observed (Figure 1a). The total number of days at sea closely followed the catch trend (Figure 1b).

 , Catch;
  , Effort;
  , Catch;
  , Effort
3.2 Species composition of catches
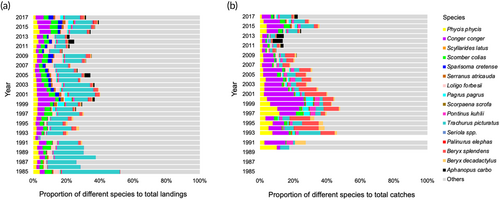
The 16 species represented up to 52% of the total annual catches recorded in the Azores both in the commercial landings and fishing inquiries, but the relative contribution of each of these species varied across the time (Figure 2). Overall, P. phycis, C. conger, S. colias, L. forbesii, T. picturatus and B. splendens collectively dominated the total catches each year. On the other hand, S. latus and P. elephas showed very low catches throughout the period studied, while species such as A. carbo showed catches restricted to a small set of years. A relatively larger proportion of species such as S. colias, S. cretense, L. forbesii and T. picturatus was observed in the landings than in the fishing inquiry data, while the opposite was observed for P. phycis, C. conger, P. kuhlii and B. splendens (Figure 2).
 , Phycis phycis;
  , Conger conger;
  , Scyllarides latus;
  , Scomber colias;
  , Sparisoma cretense;
  , Serranus atricauda;
  , Loligo forbesii;
  , Pagrus pagrus;
  , Scorpaena scrofa;
  , Pontinus kuhlii;
  , Trachurus picturatus;
  , Seriola spp.;
  , Palinurus elephas;
  , Beryx splendens;
  , Beryx decadactylus;
  , Aphanopus carbo;
  , others
3.3 Fishing operational characteristics
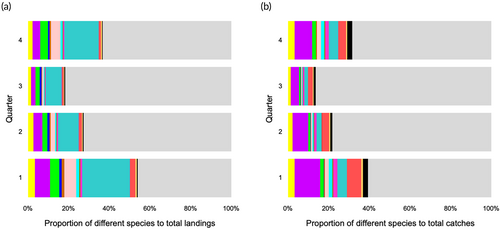
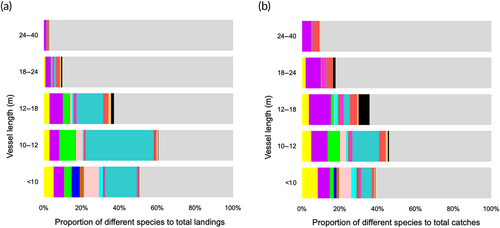
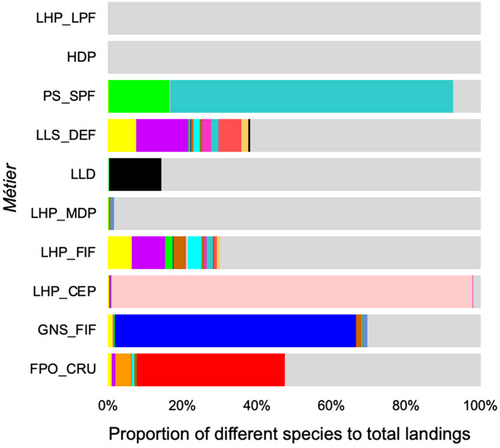
Both datasets presented increased catches of all species around the first and fourth quarters, and very low catches in the summer months (Figure 3). The great majority of species investigated were primarily captured by fleet components less than 12 m in length (Figure 4). Species such as S. cretense, S. atricauda and Seriola spp. were almost exclusively captured by vessels <10 m, whereas most of A. carbo was caught by vessels between 12 and 24 m. The proportions of the studied species were lowest on vessels longer than 18 m (<20% of total catches). Figure 5 illustrates the main métiers used to catch each of these species. Purse seines, targeting small pelagic fish (PS_SPF) appeared very effective for catching S. colias and T. picturatus, drifting longlines, targeting pelagic and demersal fish (LLD) for A. carbo, handlines, targeting cephalopods – squids (LHP_CEP) for L. forbesii, gillnets, targeting coastal demersal and pelagic fish (GNS_FIF) for S. cretense, and pots and traps, targeting crustaceans (FPO_CRO) for S. latus and P. elephas. Alternatively, the multispecificity of the set longlines, targeting demersal fish (LLS_DEF) and handlines, targeting demersal fish (LHP_FIF) was remarkable. Hand picking (HDP) and pole and line, targeting pelagic fish (LHP_LPF) were found to be inefficient in catching the species under study, as there was a low proportion of the different species in relation to the total landings. S. latus, S. colias, S. cretense, S. atricauda, L. forbesii, P. pagrus, S. scrofa, T. picturatus, Seriola spp. and P. elephas were the most common species caught at depths less than 200 m, between 200 and 600 m, P. phycis, C. conger, P. kuhlii and B. splendens, and deeper than 600 m, B. decadactylus and A. carbo (Figure 6).
 , Phycis phycis;
  , Conger conger;
  , Scyllarides latus;
  , Scomber colias;
  , Sparisoma cretense;
  , Serranus atricauda;
  , Loligo forbesii;
  , Pagrus pagrus;
  , Scorpaena scrofa;
  , Pontinus kuhlii;
  , Trachurus picturatus;
  , Seriola spp.;
  , Palinurus elephas;
  , Beryx splendens;
  , Beryx decadactylus;
  , Aphanopus carbo;
  , others
 , Phycis phycis;
  , Conger conger;
  , Scyllarides latus;
  , Scomber colias;
  , Sparisoma cretense;
  , Serranus atricauda;
  , Loligo forbesii;
  , Pagrus pagrus;
  , Scorpaena scrofa;
  , Pontinus kuhlii;
  , Trachurus picturatus;
  , Seriola spp.;
  , Palinurus elephas;
  , Beryx splendens;
  , Beryx decadactylus;
  , Aphanopus carbo;
  , others
 , Phycis phycis;
  , Conger conger;
  , Scyllarides latus;
  , Scomber colias;
  , Sparisoma cretense;
  , Serranus atricauda;
  , Loligo forbesii;
  , Pagrus pagrus;
  , Scorpaena scrofa;
  , Pontinus kuhlii;
  , Trachurus picturatus;
  , Seriola spp.;
  , Palinurus elephas;
  , Beryx splendens;
  , Beryx decadactylus;
  , Aphanopus carbo;
  , others
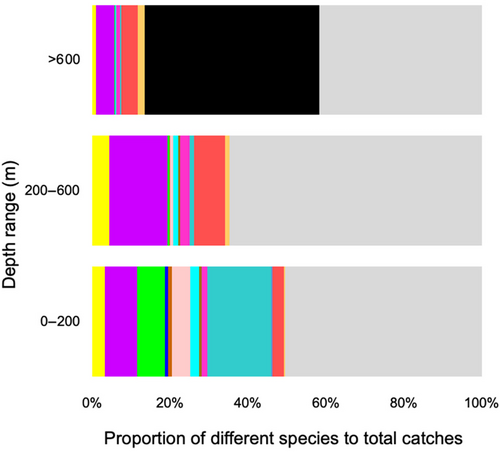
 , Phycis phycis;
  , Conger conger;
  , Scyllarides latus;
  , Scomber colias;
  , Sparisoma cretense;
  , Serranus atricauda;
  , Loligo forbesii;
  , Pagrus pagrus;
  , Scorpaena scrofa;
  , Pontinus kuhlii;
  , Trachurus picturatus;
  , Seriola spp.;
  , Palinurus elephas;
  , Beryx splendens;
  , Beryx decadactylus;
  , Aphanopus carbo;
  , others
3.4 Species abundances
Supporting Information Tables S1 and S2 show the deviance tables derived from the models and used to identify key explanatory variables and interactions that better described the data variability for LPUE and CPUE data, respectively. The best-fitted models for each species are shown in Supporting Information Tables S3 and S4. The diagnostic plots of each final model (Supporting Information Figures S1 and S2) did not indicate a severe divergence from the null pattern, indicating that the chosen model was well-fitted.
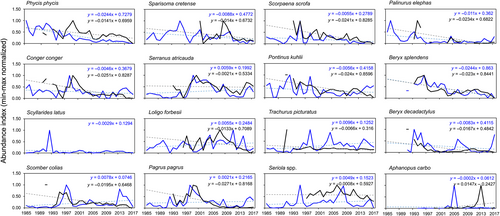
The predicted annual abundance indices for each species and dataset are shown in Supporting Information Table S5 and min–max normalized values are plotted in Figure 7. Based on the significant P value for the interaction term of the ANCOVA results, it is possible to assume that the rate of changes (regression slopes) in abundance indices varied across both CPUE and LPUE for P. phycis, C. conger, S. colias, L. forbesii, P. pagrus, S. scrofa, P. kuhlii and T. picturatus (Table 2). Except for P. phycis and T. picturatus, CPUE had a steeper trend line than LPUE (Figure 7). The significant P value for the type of data term indicated that the abundance varied systematically across the two datasets for P. phycis, S. atricauda, S. scrofa, T. picturatus and Seriola spp., with CPUE showing the greatest magnitude (y intercept value) (Table 2 and Figure 7). According to the significant P value for the year term, the abundance appeared to decrease with the year across both datasets for P. phycis, C. conger, S. cretense, S. scrofa, P. kuhlii, P. elephas, B. splendens and B. decadactylus (Table 2 and Figure 7). On the other hand, contradictory tendencies were observed for S. colias, S. atricauda, L. forbesii, P. pagrus, T. picturatus and A. carbo. Except for A. carbo, CPUE exhibited declining trends for these species whereas LPUE showed increasing ones (Figure 7).
| Phycis phycis | Scorpaena scrofa | ||||||||||
|---|---|---|---|---|---|---|---|---|---|---|---|
| Source | d.f. | SS | MS | F | P | Source | d.f. | SS | MS | F | P |
| Year | 1 | 1.773 | 1.773 | 62.220 | <0.001 | Year | 1 | 0.353 | 0.353 | 10.685 | 0.002 |
| Dataset | 1 | 0.385 | 0.385 | 13.518 | 0.001 | Dataset | 1 | 0.441 | 0.441 | 13.344 | 0.001 |
| Year: Dataset | 1 | 0.116 | 0.116 | 4.056 | 0.049 | Year: Dataset | 1 | 0.315 | 0.315 | 9.515 | 0.003 |
| Residuals | 56 | 1.596 | 0.029 | Residuals | 54 | 1.786 | 0.033 | ||||
| Conger conger | Pontinus kuhlii | ||||||||||
|---|---|---|---|---|---|---|---|---|---|---|---|
| Source | d.f. | SS | MS | F | P | Source | d.f. | SS | MS | F | P |
| Year | 1 | 0.617 | 0.617 | 16.090 | <0.001 | Year | 1 | 0.537 | 0.537 | 11.506 | 0.001 |
| Dataset | 1 | 0.080 | 0.080 | 2.093 | 0.154 | Dataset | 1 | 0.111 | 0.111 | 2.387 | 0.128 |
| Year: Dataset | 1 | 0.453 | 0.453 | 11.798 | 0.001 | Year: Dataset | 1 | 0.335 | 0.335 | 7.186 | 0.010 |
| Residuals | 56 | 2.148 | 0.038 | Residuals | 55 | 2.565 | 0.047 | ||||
| Scyllarides latus | Trachurus picturatus | ||||||||||
|---|---|---|---|---|---|---|---|---|---|---|---|
| Source | d.f. | SS | MS | F | P | Source | d.f. | SS | MS | F | P |
| Year | NA | NA | NA | NA | NA | Year | 1 | 0.035 | 0.035 | 0.952 | 0.333 |
| Dataset | NA | NA | NA | NA | NA | Dataset | 1 | 0.192 | 0.192 | 5.276 | 0.025 |
| Year: Dataset | NA | NA | NA | NA | NA | Year: Dataset | 1 | 0.284 | 0.284 | 7.805 | 0.007 |
| Residuals | NA | NA | NA | NA | NA | Residuals | 56 | 2.038 | 0.036 | ||
| Scomber colias | Seriola spp. | ||||||||||
|---|---|---|---|---|---|---|---|---|---|---|---|
| Source | d.f. | SS | MS | F | P | Source | d.f. | SS | MS | F | P |
| Year | 1 | 0.003 | 0.003 | 0.060 | 0.808 | Year | 1 | 0.342 | 0.342 | 6.246 | 0.016 |
| Dataset | 1 | 0.029 | 0.029 | 0.629 | 0.431 | Dataset | 1 | 1.215 | 1.215 | 22.198 | <0.001 |
| Year: Dataset | 1 | 0.738 | 0.738 | 15.809 | <0.001 | Year: Dataset | 1 | 0.023 | 0.023 | 0.422 | 0.519 |
| Residuals | 55 | 2.569 | 0.047 | Residuals | 51 | 2.791 | 0.055 | ||||
| Sparisoma cretense | Palinurus elephas | ||||||||||
|---|---|---|---|---|---|---|---|---|---|---|---|
| Source | d.f. | SS | MS | F | P | Source | d.f. | SS | MS | F | P |
| Year | 1 | 0.265 | 0.265 | 4.567 | 0.038 | Year | 1 | 0.762 | 0.762 | 20.615 | <0.001 |
| Dataset | 1 | 0.054 | 0.054 | 0.932 | 0.339 | Dataset | 1 | 0.036 | 0.036 | 0.965 | 0.331 |
| Year: Dataset | 1 | 0.012 | 0.012 | 0.202 | 0.655 | Year: Dataset | 1 | 0.113 | 0.113 | 3.064 | 0.087 |
| Residuals | 47 | 2.726 | 0.058 | Residuals | 46 | 1.701 | 0.037 | ||||
| Serranus atricauda | Beryx splendens | ||||||||||
|---|---|---|---|---|---|---|---|---|---|---|---|
| Source | d.f. | SS | MS | F | P | Source | d.f. | SS | MS | F | P |
| Year | 1 | 0.147 | 0.147 | 2.187 | 0.145 | Year | 1 | 1.569 | 1.569 | 49.954 | <0.001 |
| Dataset | 1 | 0.422 | 0.422 | 6.284 | 0.015 | Dataset | 1 | 0.002 | 0.002 | 0.052 | 0.821 |
| Year: Dataset | 1 | 0.057 | 0.057 | 0.856 | 0.359 | Year: Dataset | 1 | 0.001 | 0.001 | 0.047 | 0.830 |
| Residuals | 54 | 3.623 | 0.067 | Residuals | 47 | 1.476 | 0.031 | ||||
| Loligo forbesii | Beryx decadactylus | ||||||||||
|---|---|---|---|---|---|---|---|---|---|---|---|
| Source | d.f. | SS | MS | F | P | Source | d.f. | SS | MS | F | P |
| Year | 1 | 0.022 | 0.022 | 0.355 | 0.554 | Year | 1 | 0.487 | 0.487 | 8.825 | 0.005 |
| Dataset | 1 | 0.043 | 0.043 | 0.699 | 0.407 | Dataset | 1 | 0.125 | 0.125 | 2.256 | 0.140 |
| Year: Dataset | 1 | 0.243 | 0.243 | 3.987 | 0.051 | Year:Dataset | 1 | 0.055 | 0.055 | 0.993 | 0.324 |
| Residuals | 51 | 3.111 | 0.061 | Residuals | 49 | 2.707 | 0.055 | ||||
| Pagrus pagrus | Aphanopus carbo | ||||||||||
|---|---|---|---|---|---|---|---|---|---|---|---|
| Source | d.f. | SS | MS | F | P | Source | d.f. | SS | MS | F | P |
| Year | 1 | 0.191 | 0.191 | 3.588 | 0.064 | Year | 1 | 0.038 | 0.038 | 0.788 | 0.381 |
| Dataset | 1 | 0.007 | 0.007 | 0.131 | 0.719 | Dataset | 1 | 0.017 | 0.017 | 0.350 | 0.558 |
| Year: Dataset | 1 | 0.772 | 0.772 | 14.490 | <0.001 | Year: Dataset | 1 | 0.074 | 0.074 | 1.536 | 0.223 |
| Residuals | 54 | 2.877 | 0.053 | Residuals | 37 | 1.779 | 0.048 | ||||
- Abbreviations: d.f., degrees of freedom; F, F-statistic; MS, mean sum of squares; P, p-value; SS, sum of squares.
4 DISCUSSION
The Azores is traditionally a small-scale fishing community, whose fishing activities around the islands and seamounts are an important source of livelihood and food security in the region. Around 85% of the boats are smaller than 12 m, and most of them use handlines and bottom longlines as their main fishing gear to catch different demersal and small pelagic species (ICES, 2022b). Seasonally, usually between April and October, a part of the Azorean fleet directs its effort toward capturing tuna and tuna-like species, operating mainly around the central and eastern parts of the archipelago with pole and line fishing methods (ICES, 2022b). This explains the low catches of the studied species during the second and third quarters. The temporal analysis of the fishing activity in the Azores also revealed a trend of increasing effort, accompanied by cyclical fluctuations in catches with a periodicity of approximately 10 years. This supports the established notion that fishery resources may exhibit natural variability in their abundance, which is reflected in fluctuations in landings. Such fluctuations are attributed to a host of factors including, but not limited to, climate change, ocean temperature fluctuations (Cheung et al., 2010) and changes in the availability of food for fish (Worm et al., 2006). However, the effects of these factors on the catches examined in this study extend beyond the scope of the research objectives and should be investigated in the future. Despite this natural variability, human activities, such as fishing, may also contribute to declines in fish populations and subsequent reductions in landings.
Notwithstanding its artisanal nature, fishery resources in the Azores have been intensively exploited by Azorean fishers (Santos et al., 2019b) and evidence of this is the overall decreasing trend in total catches and increasing trend in total effort observed in this study. This intensive exploitation was further reflected in the decreasing trends in abundance indices of commercially important species such as P. phycis, C. conger, S. cretense, S. scrofa, P. kuhlii, P. elephas, B. splendens and B. decadactylus. This is a worrying signal, as these species share the common characteristic of being relatively slow-growing, long-lived and low natural mortality species, which makes them particularly vulnerable to overfishing if there is a failure in their fisheries management actions (Medeiros-Leal et al., 2021; Santos et al., 2019a, 2022a, 2022b). P. elephas is a good example of this. Given the species' high first sale price and moderate mobility, P. elephas has been intensively exploited throughout its range and is today widely considered overfished (Groeneveld et al., 2013). In the Azores, the lobster fishery is still classified as a developing fishery, but recent studies have indicated a worrying situation if stock assessment and management initiatives are not developed (Santos et al., 2022a). It is therefore critical for scientists to provide policymakers with the best available information since effective management is more likely when decision-makers are properly informed.
The trends in abundance observed in this study should therefore be considered as warnings and the indices used in future analytical stock assessments. On the other hand, the assessments of fish populations and communities should be based on consideration of all available data, and historical data should be carefully examined before being included to rule out invalid assumptions and erroneous conclusions. Overfishing events have been observed, for example, for Beryx species (B. splendens and B. decadactylus) in the northern Mid-Atlantic Ridge region (Shotton, 2016). In the northern Mid-Atlantic Ridge, these species have been exploited by the Soviet-Russian fleet since the 1970s, but since 2000 some minor landings have been recorded for this region (Santos et al., 2019a). Currently, in the north-east Atlantic, this resource is mainly exploited by the Azorean fleet, and this fishery has been subject to a set of control measures that have, for example, limited the annual catches of these species (ICES, 2022c). These measures have been adopted on a precautionary basis due, especially, to the uncertainties associated both with the identity of the stock (distribution much larger than the EEZ of the Azores) and the uncertainties in the estimates of the biological parameters (e.g., size at maturity) (Santos et al., 2019a). Consequently, the ICES considers that a precautionary reduction of catches should be implemented where there is no ancillary information clearly indicating that the current level of exploitation is appropriate for the stock (ICES, 2022a). Therefore, the decreasing trends observed for B. splendens and B. decadactylus in this study warrant further investigation as they may not be solely attributed to overfishing. Rather, uncertainties associated with the distribution of these fish stocks, especially for B. decadactylus (Santos et al., 2019a), may also be contributing factors. It is important to note that the large discrepancy observed between the two trends for B. decadactylus in recent years may also be indicative of this distribution uncertainty.
Discrepancies in abundance indices obtained from CPUE and LPUE for commercial species are often observed and can be attributed to a variety of factors, such as differences in gear selectivity, fish behaviour and data collection methods (e.g., Feijó et al. (2018)). For species such as S. colias, S. atricauda, L. forbesii, P. pagrus, T. picturatus and A. carbo, contradictions in abundance trends were observed between the datasets evaluated here. These species, except for A. carbo, whose fishery is not yet established in the Azores unlike what occurs in Madeira and mainland Portugal (ICES, 2022c), are targeted by an artisanal fleet operating with surface nets (S. colias and T. picturatus) and bottom longlines (S. atricauda and P. pagrus). In the case of S. colias and T. picturatus, the catches analysed in this study may be biased since these species are often used as live bait in tuna fisheries and their catches made through purse seines are not usually reported in fishing inquiries or official landings. For these species, it is necessary to reconstruct catches based on information from onboard observers and logbooks, as has been done but in a discontinued manner within the framework of the ICES (ICES, 2020b). For S. atricauda, catches obtained through fishing inquiries may be more realistic than those obtained through landings because it is a species of low commercial value that is caught in the coastal zone (depths up to 200 m) by vessels smaller than 10 m and is frequently not landed at auction for commercialization. This behaviour may also be reflected in other species, such as P. phycis and Seriola spp., whose abundance indices derived from CPUE were higher in magnitude than those from LPUE. In the case of P. pagrus, despite also being caught around the islands, the higher abundances in recent years derived from the LPUE were responsible for the differences in trends between the datasets, and the underestimation in the CPUE may be associated with the sampling procedure and methodology or the knowledge status on the fishery dynamics.
Although fishing inquiries apply to all fleet segments, they are focused more on those that are not compelled to fill out a logbook (i.e., vessels less than 10 m in length). To acquire more information on the small-scale fleet (vessels under 10 m), questionnaires are given to fishers using a panel survey methodology (DGRM, 2016). This fleet component mostly employs hook-and-line gear and operates within the jurisdiction of the port of registration. It generally performs daily fishing trips, carrying one or two fishers, and directs the fishing effort to the coastal resources of demersal and deep-sea communities (at depths up to 600 m). As a result, species primarily caught by this fleet through métiers such as LLS_DEF and LHP_FIF (e.g., P. phycis, C. conger, P. kuhlii and B. splendens) may have well-represented abundances in both fishing inquiries and landings data. However, the reliability of the abundance estimates should be thoroughly examined individually for each species captured.
Disparities in abundance trends seen between the two datasets for L. forbesii may be attributed to the fact that this is a cyclical resource, whose occurrence in the region is still poorly understood and whose fishery operates by opportunism, i.e., when the resource is largely available (Santos et al., 2020b, 2020c). In the case of A. carbo, sporadic landings from vessels operating with drifting longlines and uncertainties in the stock distribution, as the ICES considers a single stock exists in the north-east Atlantic (ICES, 2022c), may have contributed to the variability and divergence observed in the abundance trends. A. carbo is found in the Azores at depths between 800 and 1500 m (Menezes et al., 2006), but it is not targeted by local fishers. This is likely due to the low market price for the species in the Azores, which has likely constrained the development of a fishery for the species in the region (Machete et al., 2011). For P. pagrus, the issues associated with the discrepancies in the trends remain unclear and require additional investigation.
In conclusion, there was an agreement between the trends of abundance indices computed from CPUE and LPUE data for most of the studied priority stocks. However, for species such as P. phycis, S. atricauda, Seriola spp. and S. cretense, the CPUE indices appeared to be more reliable in terms of the magnitude of abundance than those obtained from LPUE data because these species are mainly caught in the coastal zone and may not always be landed at auction for commercialization. On the other hand, the indices estimated for P. pagrus, S. colias, T. picturatus, L. forbesii, A. carbo and B. decadactylus may be biased due to factors such as stock distribution, unreported catches or other factors associated with fisheries dynamics that are still poorly understood. The estimated indices provide valuable information on temporal changes in fisheries resources, discussion points on the fleet exploitation pattern and auction sampling system, and opportunities for further research. Nevertheless, future stock assessment attempts must consider all available data, including fishery-independent data, and information must be rigorously reviewed before inclusion to avoid false assumptions and incorrect conclusions. Stock assessment methods for identifying the effect of mixed fisheries acting on the same stock (e.g., integrated stock assessment models) should be explored to better analyse the current information, and further data is encouraged to be acquired to improve the results before they are used in fisheries management. Finally, since simple factors are unlikely to be driving the observed abundance patterns, future research should also investigate how species abundance trends are connected to trends in climate, oceanographic features and water quality variables. The results may reveal which factors are influencing catch rates besides the fishing tactics.
AUTHOR CONTRIBUTIONS
Régis Santos conceived the original idea, performed the analysis and interpretation of data, and wrote the manuscript. Wendell Medeiros-Leal and Mário Pinho provided critical feedback and helped shaped the final manuscript. Régis Santos supervised the project.
ACKNOWLEDGEMENTS
The authors thank all who participated in data collection in the fisheries sector in the Azores under the EC Data Collection Framework (EC–DCF).
FUNDING INFORMATION
This work is part of the PESCAz project (ref. MAR–01.03.02–FEAMP–0039) financed by the European Maritime and Fisheries Fund (EMFF) through the Regional Government of the Azores under the MAR2020 operational program. W.M.-L. was funded by an FCT Ph.D. fellowship (ref. UI/BD/153596/2022).
Open Research
DATA AVAILABILITY STATEMENT
Data supporting reported results are available from the corresponding author upon reasonable request.


