Three-dimensional migratory behaviour of European silver eels (Anguilla anguilla) approaching a hydropower plant
Funding information: Norges Forskningsråd, Grant/Award Numbers: 244022, 257588; Norges Teknisk-Naturvitenskapelige Universitet, Grant/Award Number: -
Abstract
The global population of European eel (Anguilla anguilla) is rapidly declining, and migration barriers in rivers are believed to be one of several key causes. While progress has been made in the development of bypass solutions, they are often constructed based on a limited knowledge of swimming behaviour. A bypass close to the stream bed is often recommended at fish passage facilities to accommodate downstream eel migration. The results of this recommendation are poorly studied, and the few studies that exist show varying bypass efficiencies. The current study used acoustic telemetry with depth sensors to explore the three-dimensional migratory behaviour of downstream-migrating silver eels. The eels were tracked as they approached a hydropower plant with a state-of-the-art angled bar rack and full-depth bypass. Downstream and upstream swimming differed in preferred vertical and lateral positions. During periods of local downstream movement, the density of observations was largest in the upper middle section, away from the river boundaries and in higher velocities. Conversely, when moving upstream, eels tended to avoid the upper layers of the middle part of the river, swimming closer to the riverbed and using the bank areas to a greater extent. Downstream-moving fish swam higher in the water column during night and in turbid conditions (high discharge). When approaching the impassable bar rack and the full-depth bypass, the eels searched most intensely but not exclusively along the bottom third of the rack, often exploring at new depths after changing direction. The impediment passage efficiency was 100% when both bypass solutions were considered. The study provides knowledge of the swimming behaviour of silver eels, which is relevant for the design of bypass solutions for eels at migration barriers.
1 INTRODUCTION
The population of the European eel Anguilla anguilla (Linnaeus) is critically endangered (Pike et al., 2020). The extent of the continental distribution of the species ranges from Europe to northern Africa, covering the entire Mediterranean and the Baltic Sea (Tesch, 2003). Fishing yields are estimated to have decreased by 90% over the past century, and in the North Sea distribution area the recruitment has dropped up to 98.4% over the course of a few decades (Correia et al., 2018; Dekker et al., 2018). Many factors contribute to this decline, among them habitat loss, pollution, overfishing, parasitic infections, and migration barriers (De Meyer et al., 2020). Migration barriers pose a particularly large threat to diadromous fish species, which require both freshwater and marine habitats to fulfil their life cycle.
The European eel exhibits three life stages: the glass eel stage, the yellow eel stage and the silver eel stage. All eels are hatched in the Sargasso Sea and a large proportion of the larvae drift with the Gulf Stream to the European coast. Here they migrate up the rivers and streams as glass eels. Depending on living area, the eels spend on average 8–15 years in freshwater as yellow eels. After reaching adulthood, they start their transformation into silver eels and begin their migration back to the Sargasso Sea, a journey that was first directly documented in 2022 ( Wright et al., 2022). The current paper will focus on the silver eel stage. The silver eels usually start their downstream migration in autumn and early winter, and the beginning of migration events is typically associated with rainfall episodes (Durif & Elie, 2008). Runs happen during night-time, usually during rising river discharge (Behrmann-Godel & Eckmann, 2003). Other associated triggers are water temperature, moonlight, luminosity and turbidity (Durif et al., 2002; Stein et al., 2016; Teichert et al., 2020).
Hydropower plants (HPPs) are among the most common migration barriers, and there are more than 21,000 HPPs on the European continent (Schwarz, 2019). Apart from alpine regions, these are often located in lowland areas, where the eel populations are most abundant. Since silver eels typically migrate downstream semipassively and distribute according to the distribution of flow, the eels are predisposed to entering hydropower intakes (Breukelaar et al., 2009; Porcher, 2002). Turbine entrainment is associated with high mortality, and mortality rates depends on factors such as turbine type, discharge, hydraulic head, fish species and body length (Adam et al., 2005). Eels are especially vulnerable due to their elongated body shape (Porcher & Larinier, 2002). Mortality rates are typically in the order of 10%–50% but for Pelton and cross-flow turbines mortality can reach 100% (Adam et al., 2005; Dainys et al., 2018; Larinier, 2008). In low-land areas, Kaplan turbines are most common and are associated with turbine mortality in the range 25%–40% (Calles et al., 2010; Dainys et al., 2018; Dönni, 2001; Porcher & Larinier, 2002). Impingement on intake screens is also a major source of mortality, as well as injuries and delayed mortality (Calles et al., 2010; Gosset et al., 2005). Even if mortality is avoided, eels may be considerably delayed in their migration by obstructions in the river (Besson et al., 2016; Larinier, 2008; Verhelst et al., 2018). Finally, the cumulative effect of multiple dams in the same river should be considered, with delays and added mortality due to each obstruction (Calles et al., 2021; Larinier, 2008).
Knowledge about the behaviour and swimming depth of silver eels is important for improving HPP bypass and mitigating mortality risk at migration barriers. While the benthic nature of yellow-stage eels in lacustrine habitats is well known (Tesch, 2003; Yokouchi et al., 2009), the swimming depth of silver-stage eels during riverine migration is poorly documented and the sources are somewhat contradicting. Eels are often reported to migrate close to the riverbed (Acou et al., 2008; Adam et al., 2005; Behrmann-Godel & Eckmann, 2003; Trancart et al., 2020), but the claims are not supported by swimming depth data. Other authors maintain that the eels drift in mid to deep layers of water or even in the upper layers (Tesch, 2003). Newer telemetry studies have demonstrated that American silver eels (Anguilla rostrata) swim at a variety of depths and can change swimming depths quickly (Haro et al., 2000). In a HPP forebay, American eels were observed at all depths, but they spent most of the time near the bottom, with occasional ascents to the surface (Brown et al., 2009). The recommendation for eel bypass solutions is an inclined impassable intake rack with approach velocities lower than impingement velocity in combination with an adjoining bypass with an opening close to the stream bed (Adam et al., 2005). Results from some HPP facilities indicate that bottom bypasses outperform surface sluices (Durif et al., 2002; Gosset et al., 2005). However, in other cases, eels do not use the custom-built eel bypasses but prefer undershot sluice gates intended for debris or surface bypasses constructed for salmon smolts (Egg et al., 2017; Økland et al., 2017).
The aim of this study was to provide knowledge of the swimming behaviour of downstream-migrating silver eels as a foundation for improving eel bypass practices. To do so, we mapped the three-dimensional behaviour of silver eels in four locations at a hydropower station in Sweden: (a) the upstream river reach, (b) a ponded area upstream of the HPP, (c) an artificial intake channel and (d) in the vicinity of a 15 mm spaced angled intake rack with a full-depth bypass. We also explored the difference in swimming behaviour during local upstream and downstream movements, during the day and night and at different inflow discharges. Furthermore, the study provides additional and more detailed evaluation of the eel bypass solutions implemented at the study site (Calles et al., 2010, 2012, 2013, 2021).
2 MATERIALS AND METHODS
2.1 Study river
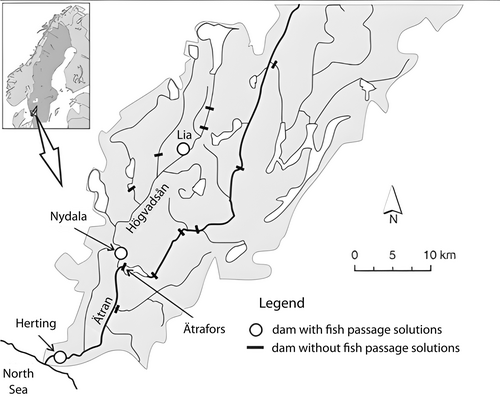
The study was carried out at Herting HPP in the River Ätran in Sweden in 2017. The river, with its estuary in the town of Falkenberg (56°52'55″N, 12°28'46″E; Figure 1), has a catchment area of 3342 km2 and a mean annual discharge of 57 m3/s (minimum 20 m3/s, maximum 319 m3/s between 1990 and 2011) (Olofsson, 2013). The river is home to several diadromous fish species: Atlantic Salmon (Salmo salar), sea trout (Salmo trutta trutta) and European eel (Anguilla anguilla) (Calles et al., 2012). Three kilometres upstream from the river mouth they meet the Herting HPP, the lowermost HPP on the river. The main stem of the river has a length of 243 km, which is blocked 24 km further upstream by the Ätrafors HPP. However, migrating fish that succeed in bypassing the Nydala HPP can access a further 34 km in the Högvadsån tributary (Calles et al., 2010, 2012).
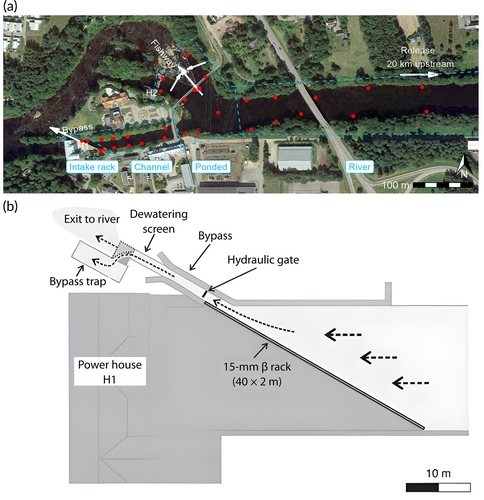
The Herting HPP consists of two powerhouses (Figure 2). Herting 1 (H1) has two Kaplan turbines with installed capacities of 25 and 15 m3/s, respectively, and Herting 2 (H2) has one Kaplan turbine with a capacity of 25 m3/s. The fish passage solutions underwent major modifications in 2013. The H1 conventional trash-rack was replaced by a 40 m long composite angled rack with 15 mm bar spacing, installed 30° towards the approach velocity (Nyqvist et al., 2018). The rack aims to guide downstream-migrating fish to a full-depth bypass with a hydraulic gate that is opened and closed electronically. In the closed state, the hydraulic gate is equipped with two openings: a bottom slot (200 mm width × 200 mm height) and a surface slot (300 mm width × 650 mm height). The two slots have a combined discharge of 0.6 m3/s. When the pressure gradient across the rack exceeds a specific threshold, the full-depth gate opens, releasing up to 3 m3/s. This procedure is only implemented for short periods during cleaning of the rack. However, in agreement with Calles et al. (2021), we use the term “full-depth bypass” for this bypass installation because there are parallel openings near the bottom and at the surface. Since 2018, as a fish protection measure, the turbine unit at H2 has not been in operation during the fish migration period (Calles et al., 2021). Three flood gates are located to the right of the H2 powerhouse but were not in operation during the study period. Fish can also bypass through a large nature-like fishway, either via the hydraulic entrance or over the concrete weirs. A surface trash gate is located on the right bank.
2.2 Hydrological conditions and hydraulic modelling
Hydrological data were provided by the HPP operator Falkenberg Energi. The mean inflow over the study period (23 September–25 October 2017) was 79.6 m3/s (minimum 24 m3/s, maximum 158 m3/s). The H1 HPP had a mean discharge of 34.8 m3/s (minimum 0 m3/s, maximum 40 m3/s), running at full capacity for 55% of the period and with only the largest turbine (25 m3/s) running for 27% of the period. All three flood gates were closed for the entire study period, whereas the total inflow and its distribution varied largely (Table 1). With the gates closed, the water level in the ponded area was primarily governed by the discharge over the weir and ranged between 6.84 and 7.45 metres above sea level during the study period.
| Location | Discharge (m3/s) | ||
|---|---|---|---|
| Mean | Minimum | Maximum | |
| Inflow | 79.6 | 24.1 | 157.8 |
| H1 | 34.8 | 0.0 | 40.0 |
| H2 | 0.0 | 0.0 | 0.0 |
| Weirs | 36.7 | 4.2 | 118.3 |
| Fishway | 7.4 | 4.6 | 13.7 |
| Other | 0.7 | 0.4 | 1.2 |
- Note: ‘Other’ includes the full-depth bypass and the surface trash gate.
To explore the velocities experienced by the eels during their migration computational fluid dynamics (CFD) modelling was performed for the study area. The OpenFOAM platform was used for this task, following the procedures described by Szabó-Mészáros (2019). Bathymetry data were obtained with an Acoustic Doppler Current Profiler (ADCP; RiverSurveyor ADCP M9, SonTek, San Diego, CA, USA) and the geometry of the gates and the intake structures were taken from technical drawings and field measurements. The digitalized structures and bathymetry were combined into a geometry model. The CFD model was validated with velocity transects from ADCP measurements at an inflow discharge of 51 m3/s with full HPP discharge. The variation of discharges in the study period made a computational simulation of the entire time series unfeasible. To analyse the flow conditions experienced by the eels, 23 flow scenarios were identified in such a way that all fish observations could be linked to a scenario with flow conditions similar to those experienced by the eels. Further links between hydraulics and fish behaviour will be explored in a separate study.
2.3 Telemetry studies
The swimming behaviour of eels approaching the HPP was studied by three-dimensional (3D) acoustic telemetry. In total, 98 downstream-migrating silver eels were caught in four eel traps 13–17 km upstream of the Herting HPP (see Calles et al. (2010) for details). The eels were tagged and released at Vessigebro, 20 km upstream of the powerplant, on three consecutive dates in September 2017 (23rd: n = 45, 24th: n = 22, 25th: n = 31). The silver stage was selected on site by colouration and girth firmness. In addition, external morphological measurements (body weight, body length, pelvic fin length, horizontal and vertical eye diameter) were recorded for subsequent calculation of the silver index. The tagged eels had a mean length of 0.80 m (minimum 0.64 m, maximum 1.0 m) and weighed on average 0.95 kg (minimum 0.52 kg, maximum 2.0 kg). The acoustic receiver array tracking the tagged eels was operational from 22 September to 5 December.
The eels were tagged with acoustic tags with pressure sensors (length 65 mm × diameter 12 mm, mass 5.6 g in water; Lotek Inc., Newmarket, Canada), which were surgically implanted into the body cavity of the eels. Before tagging, the eels were anaesthetized in a 40 mg/L solution of metomidate (Aquacalm, Syndel, Nanaimo, Canada). The eels were placed ventral side up and a 15–20 mm incision was made on the ventral surface ~4–6 cm in front of the anus. The incision was closed with three or four independent sutures (permanent monofilament, Ethilon*II, 4–0 polyamide; Johnson&Johnson, New Brunswick, NJ, USA). During the surgical procedure, the eels were resting on a wet towel and the rest of the skin was kept wet and in direct contact with air to allow the animal to get oxygen through the skin. After introducing the eels to the anaesthetic bath all air was evacuated, forcing the eels to ventilate water until they were anaesthetized. The time in the anaesthetic bath varied between 3 and 5 min, the tagging took 3–4 min and recovery times were between 2 and 5 min.
Eel movement was tracked using an array of 33 Lotek WHS 3250 hydrophones located from 600 m upstream of the H1 intake and extending all the way down to the bypass facility (Figure 2a). The acoustic tracking system worked at a frequency of 76 kHz. Tags emitted signals at 5 s burst intervals, with every 10th signal being a binary motion signal (0 or 1) and the other signals containing pressure measurements. Pressure sensor resolution was 0.1 m.
2.4 Processing of telemetry data
Detections of tagged fish were processed in combination with pressure tag data using the Yet Another Positioning Solver (YAPS) (Baktoft et al., 2017) to estimate the time-dependent 3D tracks. The data from each pressure sensor were corrected for air pressure using a times series from the nearby Torup A weather station, retrieved from the Swedish Meteorological and Hydrological Institute. For detection of final route choice, the processed YAPS data were supplemented from the raw data since the number of hydrophone detections was often limited when the eels were exiting the study domain. Pressure sensor data from final observations were used to evaluate the choice between the surface and bottom bypass.
The YAPS data were post-processed using R 4.1.3 (R Core Team, 2022). Data points positioned outside the river boundary were removed (7.3% of the data). Parts of the time series of individual eels (hereafter names eel tracks) with extended periods of only one or zero hydrophone detections were excluded from the analysis (additional 10.4% of the data, from 12 eel tracks, mostly at a small number of locations). Finally, parts of eel tracks with large multipath positioning uncertainties close to concrete surfaces (see Baktoft et al. (2017)) were removed (additional 8.2% of the data, from three eel tracks). The eels detected in the telemetry array all migrated downstream from the tagging location, but many of them also temporarily swam upstream within the telemetry array, and the effects of local swimming direction on behaviour were of interest. The instantaneous swimming direction was obtainable from the eel positions after YAPS processing, but we were interested in the effects of a maintained swimming direction. To achieve this, eel tracks were split and classified as ‘inactive, ‘upstream’ or ‘downstream’ movement. Active and inactive periods were determined based on the ground speed of the eel. To avoid small-scale fluctuations, the ground velocity was smoothed using a centred rolling average filter in the zoo package for R (Zeileis & Grothendieck, 2005) with k = 17, where k is the number of observations in the rolling window. The k value was chosen based on manual inspection as the value that best separated periods of movement from inactive periods. An eel was defined to be inactive if its smoothed ground speed was less than a threshold of 0.02 m/s and moving if the threshold was exceeded. Brief rests (< 20 min) and short movements (< 20 m) were assumed to be part of the higher-level moving and resting event, respectively. For most observations (98.1%) the classification was based on the velocity threshold alone, and these threshold values were chosen iteratively with the purpose of reducing small-scale swimming speed fluctuations while still retaining the overall movement patterns. Moving events were further split into events where the eel was moving either upstream or downstream, each event with a range of at least 50 m in the direction parallel to the river axis. Some eel tracks had periods with no detections, leaving gaps in the data series. An event was split into separate events if there was a gap > 6 h or if the gap duration was longer than 1 h and the eel had moved at least 100 m.
To analyse the lateral and vertical position preferences of the eels in a cross-section, a coordinate system of relative width and depth was used (Figure 3). Relative width (Wrel) was defined as the relative position between the two banks, with −0.5 at the left bank and +0.5 at the right bank, i.e., . Relative depth (zrel) was defined as the ratio of swimming depth (z) to local water depth (d), with zero at the water surface, i.e., . Between data points in the bathymetry coverage, the zrel value sometimes exceeded the physical limit of 1.0. For the combined lateral and vertical analysis, the data are presented as rectangular plots (Figure 3b). The swimming depth preference was analysed on the zrel dimension. To exclude bank effects, only data from the middle 90% of the river width were included in this analysis. To explore the combined lateral and vertical distribution, the number of observations was calculated on a 10 × 10 grid with Wrel and zrel as dimensions, averaged over the longitudinal dimension for each of the predefined areas (Figure 2a). Since each tag produced an observation at a fixed time interval, the raw counts would give an overrepresentation of eels with a slow speed, skewing the apparent preferences towards areas where the eels tended to move slowly. To compensate for this, the observations were weighted by the ground speed of the eels.
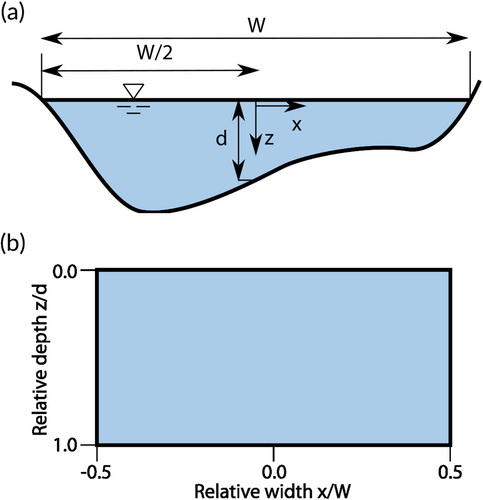
Owing to the repeated measurements, the data had a very high temporal autocorrelation. The analysis on differences in swimming depth and lateral position for upstream and downstream swimming under varying conditions was done on median relative depth for each individual in each group. Comparisons between sample means were performed with two-sided Student t-tests, and interactions with continuous covariates were tested with correlation tests. The analysis on lateral position was performed with the absolute value of the relative width as response variable (Figure 3). As a supplement, the data were analysed with linear models, and the best model subset was chosen based on the Akaike information criterion (AIC). Swimming direction, time of day and inflow discharge were assessed as covariates. Effects of daylight were analysed with a categorical variable set as ‘night’ if the observation occurred between dusk and dawn. The timing of dusk and dawn was calculated using the suncalc package in R (Thieurmel & Elmarhraoui, 2019). Only eels in motion were included in the analysis, and downstream movement was chosen as the reference level. Similarly, daytime was chosen as reference level for time of day.
2.5 Ethical statement
The study was performed under ethical permission from the Swedish Board of Agriculture (85–2013).
3 RESULTS
3.1 Telemetry results and route choice
Out of the 98 tagged eels, 90 were detected in the telemetry array, of which 87 provided enough data for YAPS processing. For all the 90 detected eels, there was enough information to determine the passage route of the eel. The first and last observations in the dataset are from 23 September and 25 October. Individual eel detection durations ranged from 85 s to 19 days (median 20 min), with the number of observations of each eel ranging from 18 to 199,156 (median 234). A total of 57,982 observations (8.7%) were classified as moving downstream, 51,306 observations (7.7%) as moving upstream, with the remaining 558,712 (83.6%) classified as inactive. For eel tracks, a total of 205 events were classified as downstream (mean per eel 2.36 events, minimum 1, maximum 17), 113 as upstream (mean 1.30, minimum 0, maximum 16) and 118 as inactive (mean 1.36, minimum 0, maximum 18). Median swimming velocity was 0.16 m/s (minimum 0.01 m/s, maximum 0.90 m/s) and 0.08 m/s (minimum 0.01 m/s, maximum 0.34 m/s) for eels swimming downstream and upstream, respectively. The eel tracks contained 49 gaps of more than 1 h (on average 0.56 gaps per fish, minimum 1, maximum 7). The duration of these periods ranged from 2 h to 14.7 days (median 25 h). During these periods, the eels were spotted again a median of 18 m away from the previous location (minimum 0.5 m, maximum 376 m). These locations of missing data were spread out over the telemetry array.
The eels arrived at the study domain 20 km downstream of the release site from 0 to 32 days after release (23–25 September, median 11 days). All the 90 detected eels passed the facility successfully using the bypass options, giving an impediment passage efficiency of 100% (Table 2). Twenty-eight eels (31%) passed through the hydraulic entrance to the fishway, 24 (27%) over the weir and 38 (42%) via the rack and bypass. In the third group, the choice between the surface or bottom slot could be determined for 31 individuals. Twenty-two out of these 31 eels (71%) used the bottom slot. The eels mainly (80 out of 87 eels with valid tracks, 92%) entered the study site at night. Sixty-seven out of 87 eels (77%) entered during an inflow discharge between 50 and 90 m3/s, but considering the duration of each inflow discharge bin, the largest peak in detections was for discharges > 140 m3/s. For such discharges, the ratio of eels that entered during the day was also the highest (four out of 10 eels, 40%; Figure 4).
| Final route choice | Frequency |
|---|---|
| Bottom bypass | 22 (24%) |
| Surface bypass | 9 (10%) |
| Bypass, slot not determined | 7 (8%) |
| Intake rack and bypass, total | 38 (42%) |
| Over weirs | 24 (27%) |
| Through hydraulic entrance | 28 (31%) |
| Nature-like fishway, total | 52 (58%) |
| Grand total | 90 (100%) |
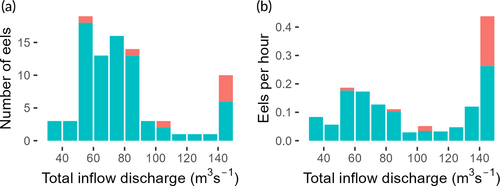
 , day;
  , night
Most eels (80%) successfully passed the bifurcation (where the river flow divides between the H1 and H2 areas) on the first attempt, while the remaining eels turned upstream at least once before returning for a successful passage. Two eels needed five attempts, exploring both the H1 intake channel and the area in front of the H2 flood gates before exiting through the fishway. For these two eels, 7–9 days passed from the first observation to the last. Thirty-two out of the 39 eels (82%) that approached the rack and bypass entered the bypass on the first attempt. The median passage time from the first observation in the forebay (the ponded area in Figure 2a) to the last observation was 7 min, with a wide range from 80 s to 19 days. The median value was independent of bypass choice, but the variance was much greater for the group of eels choosing the nature-like fishway. The 75% quantile was 35 min for the eels migrating through the full-depth bypass, but 3 days for the eels migrating through the nature-like fishway. The difference in means was significant (two-sided t-test, P < 0.001). Fifteen out of 86 individuals (17%) with continuous tracks through the intake area spent more than 1 day, only one of which swam through the full-depth bypass. The median moving event duration was 53 min (minimum 55 s, maximum 7.4 h), with a corresponding median distance of 94 m (minimum 5 m, maximum 740 m). The median duration for inactivity events was 109 min (minimum 75 s, maximum 97 h).
3.2 Swimming depth
There was large variation in the estimated swimming depths. The mean relative depth across all observations was 0.93, but this number is dominated by the large number of observations of inactive eels on the riverbed. Inactive eels had a mean relative depth of 0.97, whereas downstream and upstream-swimming fish had mean relative depths of 0.82 and 0.72, respectively. The difference between upstream and downstream-swimming fish was significant (t-test, P < 0.001). Thus, the general pattern was that eels swimming upstream were closer to the riverbed than downstream-swimming fish in the whole study area.
To further explore relationships between relative swimming depths and behavioural and environmental variables, we focused on the river section. The results from this part of the study area are likely to better represent the general river migration patterns of eels and are less influenced by search behaviour in the vicinity of barriers and bypass options. In the river section, the mean relative depth of downstream-swimming eels (0.61) was significantly lower (closer to the surface) than for upstream-swimming fish (0.78, t-test, P < 0.001). Moreover, the eels swam closer to the surface during night (in darkness) than during daytime when swimming downstream (t-test, P < 0.001), whereas no such difference was found for upstream-swimming fish (t-test, P > 0.05) (Figure 5a). Finally, there was a significant negative correlation between swimming depths and water discharge for fish swimming downstream during daytime (R = −0.57, P < 0.001; Figure 6), but not during the night (R = −0.028, P > 0.05) and no corresponding correlations for upstream-swimming eels (both P > 0.05). Thus, during daytime, downstream-swimming eels swam closer to the surface at high discharges than at low discharges. Compiled linear modelling analyses confirmed the above patterns, with significant main effects of swimming direction and day/night (Table 3) in the same direction as described above, and after allowing for interactions the best model (AIC criteria) included discharge as well, and all interaction effects.
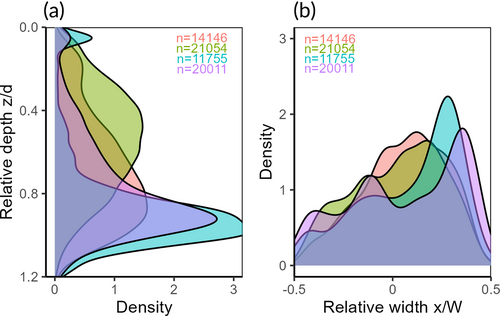
 , downstream day;
  , downstream night;
  , upstream day;
  , upstream night
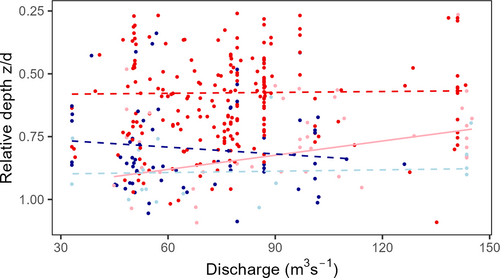
 , downstream day;
  , downstream night;
  , upstream day;
  , upstream night
| Good models | Best model | ||||
|---|---|---|---|---|---|
| Model parameters | AIC | ΔAIC | Var | Estimate | P value |
| Main effects models | int | 0.75 | <0.001 | ||
| dir + nig | −39.4 | 0 | dir | 0.15 | <0.001 |
| dir + nig + dis | −37.7 | 1.7 | nig | −0.17 | <0.001 |
| Models including interactions | int | 1.04 | <0.001 | ||
| dir + nig + dis + dir:nig + dir:dis | −41.2 | 2.0 | dir | −0.25 | 0.072 |
| dir + nig + dis + dir:nig + dir:dis + nig:dis | −42.2 | 0 | nig | −0.45 | <0.001 |
| dir + nig + dis + dir:nig + dir:dis + nig:dis + dir:nig:dis | −40.9 | 1.3 | dis | −0.0027 | 0.029 |
| dir:nig | 0.25 | 0.0091 | |||
| dir:dis | 0.0031 | 0.048 | |||
| nig:dis | 0.0024 | 0.090 | |||
- Note: The covariates are swimming direction (dir), time of day (nig) and inflow discharge (dis), where ‘downstream’ and ‘night’ were chosen as baselines.
Some more qualitative observations on swimming depths were also done. While upstream movement was generally along the riverbed, there were occasional ascents to the surface with immediate descents back to the riverbed during night-time. In daytime, these ascents were fewer, and only up to 0.5–1.0 m below the water surface. However, a few eels also moved upstream at mid-depth during low-discharge conditions. At night or during high discharges, downstream movement was associated with varying swimming depth: an eel would rarely swim at a constant depth for any amount of time, but instead move up and down in the water column. These movements could be described as oscillations around a swimming depth anywhere between the lower and the upper third of the water column, with frequent ascents to higher levels and dives to the riverbed, usually at vertical speeds of 0.05–0.2 m/s. Two out of the 59 eels with straight paths to the nature-like fishway swam just below the water surface.
3.3 Lateral position
As for the swimming depth analyses, we focused on the lateral distribution in the upstream river section. The lateral distribution of the eels did not show as large variation as the depth distribution. In general, downstream swimming was largely closer to the centreline, with 67% of the observations in the middle half of the river compared to 50% of the observations in this mid-section for upstream-swimming fish. Only 5% of the observations of downstream swimming were outside the middle 80% of the river, compared to 15% for upstream swimming (Figure 5b). The same pattern was also found in the other areas upstream of the powerplant.
The best model for lateral distribution had swimming direction and time of day as covariates (Table 4), but only the effect of swimming direction was significant. The analysis was performed on the absolute value of the relative width (see Figure 3), ranging from 0 (centreline) to 0.5 (banks). Thus, the main pattern was that downstream-swimming fish primarily swam in the middle part of the river, with a tendency for broader river width use during night, whereas upstream-swimming eels also used the areas towards the riverbanks.
| Good models | Best model | ||||
|---|---|---|---|---|---|
| Model parameters | AIC | ΔAIC | Var | Estimate | P value |
| dir | −252.1 | 0.3 | int | 0.17 | <0.001 |
| dir + nig | −252.4 | 0 | dir | 0.11 | <0.001 |
| dir + dis | −250.5 | 1.9 | nig | 0.028 | 0.14 |
| dir + nig + dis | −250.5 | 1.9 | |||
| dir + nig + dir:nig | −250.9 | 1.5 | |||
- Note: The covariates are swimming direction (dir), time of day (nig) and inflow discharge (dis), where ‘downstream’ and ‘night’ were chosen as baselines.
3.4 Combined spatial analysis
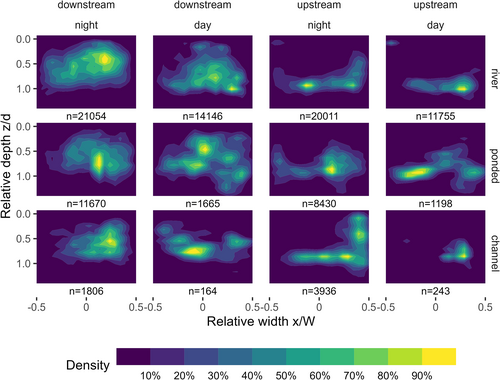
A combined analyses of lateral and vertical distribution gives an overview of the preferred positioning of the eels in the river cross-section (Figure 7). For downstream movement, the density of observations was low in the vicinity of the riverbed and banks, and high in the open water. For upstream movement, the opposite was true, with low densities in the middle upper section of the river and comparatively higher densities closer to the bed and banks. The distribution of inactive observations was dominated by a few eels staying in one location for extended periods.
In the four transects with simulated water velocities, the observations of eels swimming upstream were mostly distributed along the river boundaries, where the water velocity was low, whereas the observations of eels swimming downstream experienced a broader distribution of water velocities (Figure 8, top). The simulated relative water velocities experienced by the eels swimming downstream had a higher mean value than for eels moving upstream (t-test, all P < 0.001; Figure 8, bottom). This difference was largest in the intake channel.
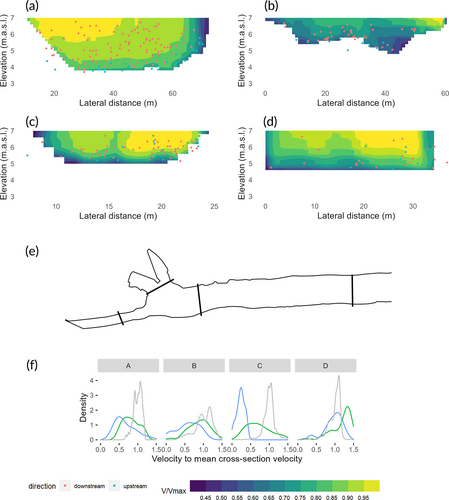
 , downstream;
  , upstream;
  , cross-section
3.5 Behaviour near the bar rack and bypass
Forty-five out of the 48 eels (94%) that entered the H1 intake channel did so during the night and swam generally closer to the surface than in the upstream sections. However, there was no significant difference in the mean relative depth for eels swimming downstream during the night compared to the other sections (P = 0.14). Most of them (71%) entered the channel during full HPP discharge. The first interaction with the rack (first observations closer than 3 m from the rack) were mostly (24 out of 41 observations, 58%) along the right half of the rack (distance along rack > 20 m in Figure 9a). Most eels (23 out of 41 eels, 56%) approached the bar rack along the lower third of the rack (Figure 9b). The median search time (time spent within 3 m of the rack) in the lower third of the bar rack was 60 s (minimum 5 s, maximum 410 s) compared to 25 s (minimum 5 s, maximum 175 s) in the middle third and 13 s (minimum 5 s, maximum 50 s) in the upper third (Figure 10). The eels spent longer in the half of the rack closest to the full-depth bypass than in the other half (69 s vs 35 s, two-sided t-test, P = 0.035). Considering that most eel tracks were cut off before reaching the final bypass, this difference is likely to be underestimated. The difference between the time spent in the lower third versus the middle and upper thirds was significant (two-sided t-test, P = 0.018 and 0.0047, respectively), but the difference between the middle and upper thirds was not significant (P = 0.085).
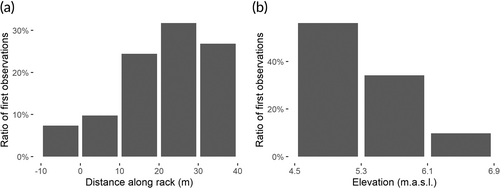

Most of the eels found one of the openings in the full-depth bypass quickly. The total bypass efficiency among fish that interacted with the rack was estimated at 72%, with 11 out of 39 eels that approached the rack and bypass moving downstream through the nature-like fishway. The median time from first interaction with the bar rack to the final observation was 92 s. One eel spent more than 30 min in the area before entering the bypass. Thirty-one out of the 36 eels (86%) passed straight to the bypass entrance without stopping or returning upstream. The eels that eventually returned upstream spent a longer time close to the bar rack before doing so, with a median duration of 8 min (minimum 1 min, maximum 30 min). This difference was significant (two-sided t-test, P = 0.011). Although the total search time was different for successful and unsuccessful passes, the relative distribution of time spent in different depths along the bar rack was largely similar, with most of the search along the bottom third (Figure 10). The time from first interaction with the bar rack to final observation was slightly longer for eels that were identified as exiting through the bottom slot than for those using the surface slot, but the difference was not significant (86 and 68s, respectively, t-test, P = 0.36).
The eels typically searched in horizontal sweeps along the bar rack, often exploring at new depths after changing direction (Figure 11, left). The median number of sweeps was two (minimum one, maximum seven). Twenty out of 34 eels (59%) searched at more than one level of the bar rack, with a median vertical searching range of 1.2 m. Only two eels failed to find the full-depth bypass. Some of the eels exhibited an escape behaviour where they swam 2–7 m upstream after interacting with the screen (Figure 11, right), as first described by Adam et al. (2005).

4 DISCUSSION
All the 90 eels observed in the study area left through one of the safe bypass options, yielding an impediment passage efficiency of 100%. Forty-two percent of the eels moved through the full-depth bypass and the remaining 52% through the nature-like fishway. Eight tagged eels lacked enough observations for analysis, and tag failure, predation or behavioural tagging effects (e.g., Durif et al. (2002)) are candidate explanations. The median passage time from first observation in the forebay was 9 min (minimum 80 s, maximum 19 days), with a wider range of passage times for eels moving through the nature-like fishway. At the bar rack, eels are guided to the bypass, whilst at the nature-like fishway eels may either pass over the weirs or via the hydraulic fishway, which may explain the greater variety in passage times in the latter group. A previous radio-telemetry study in the same location saw an overall median passage time of 1 h when the eels were released at the same spot as in the present study (Calles et al., 2021). The differences may be related to different flow conditions or limited sample size (30 eels) in the previous study. Overall, the present study confirms the exceptional passage efficiency of the solutions implemented at Herting HPP (see discussion in Calles et al. (2021)).
Although most of the eels used the bottom slot at the bar rack and bypass, the eels spent most time searching along the bottom third of the rack, and in particular close to the bypass opening. The same pattern was observed at the inclined rack at the upstream Ätrafors HPP in a previous study (Calles et al., 2013). The limited size of the bottom slot (200 mm in both dimensions) might be a deterrent for the eels. The width of deep bypass slots has previously been shown in an experimental study to affect the number of eels using the bypass option, with the argument that the larger opening creates higher velocities in front of the slot, attracting more eels (Egg et al., 2017). In our study, the eels seem to find the slot without much effort, but hesitated to use it. The reason might be related to the hydraulics in the vicinity of the entrance, where the small opening creates a strong contraction of the water. This high acceleration might trigger an avoidance response in the eels, as compared to the surface slot, which provides a more gradual acceleration of the water. However, the small difference in time from first interaction with the bar rack and final observation in the two groups suggests that this effect does not pose a large problem to the eels in this case.
At the bar rack, eels were observed to search in horizontal lines at different depths. This searching behaviour is similar to that observed by Brown et al. (2009) for American eels. While in our case the bar spacing of 15 mm rendered passage impossible, their study featured a trash rack with 32 mm bar spacing, with almost 90% of the eels using the turbines as the final passage route. However, for the eels that did not pass the trash rack immediately, the horizontal search behaviour at different depths seems to be similar in the two studies. Piper et al. (2015) found that close to a bar rack 84% of the eels were detected close to the channel bed, while only 56% of the upstream-moving eels were detected at this depth, suggesting that the eels may have a reduced benthic orientation after rejecting the rack. We could not find this pattern in our data since individual depth changes after rack interaction were just as much towards the bottom as towards the surface. The depth variation close to the bar rack in our study seems to be more related to searching behaviour.
Some eels were observed to swim rapidly upstream 2–7 m after interaction with the rack. This behaviour has previously been described in flume studies by Adam et al. (2005), where eels on hitting screens with bar spacing of 5–20 mm performed a 180° turn and aligned themselves against the current to push themselves off the screen. Although our data were limited to positions at 5 s intervals and we cannot confirm physical contact with the bar rack, the observations fit the descriptions of this behaviour. We also know from previous studies that eels tend not to react to obstacles before reaching physical contact, which corroborates the assumption that the observed behaviour is the same as in the previous studies (Russon & Kemp, 2011). That the same behaviour was not reported in the study on American eels might be ascribed to the larger bar spacing of the trash rack in that study. Previous studies have found a circling behaviour with repeated approaches of the rack and sprinting upstream before finally passing through the racks and into the turbines at a higher discharge (Behrmann-Godel & Eckmann, 2003; Trancart et al., 2020). These studies were performed at intakes with racks perpendicular to the direction of main flow. In the case of an impassable angled rack, as in the current study, the water velocity component parallel to the rack (Calles et al., 2013) allows for a drift between each circulation, and if the eels do not reject the bar rack, they eventually end up at the full-depth bypass, as long as the normal velocity at the rack is lower than the impingement velocity.
Our data show that the assumption of eels migrating along the riverbed may be inaccurate. For eels moving upstream, the majority of the observations were indeed close to the bed. When moving downstream, however, they made use of the full height of the water column. The findings are similar to what Brown et al. (2009) observed for American silver eels. They noted that eels were located at all depths in the forebay but spent the largest proportion of their time close to the bed, with some movements to the surface. Their study did not make a distinction between upstream and downstream moving behaviour, which was the most significant finding in our study. Direct ratios of time spent at different depths tend to overrepresent the zone close to the riverbed, where the eels typically move at a much lower speed. The number of eels crossing a specific transect will probably be better approximated when weighting the observations by the ground speed of the eels.
We suggest that the observed difference in preferred swimming depth for upstream- and downstream-swimming silver eels is mainly a response to the hydraulic conditions, with eels taking advantage of the velocity distribution in the river. For eels moving downstream, the distribution of eels resembled a typical velocity distribution in a river cross-section, with low values close to the bed and banks, and higher values in the open water. The observed distribution for eels moving upstream was the complete opposite, with low values in the upper middle section and comparatively higher values close to the river boundaries. The difference in preferred water velocities for upstream and downstream swimming was most pronounced in the concentrated flow in the intake channel, where upstream swimming was only observed in areas where the water velocity was <50% of the mean velocity in the cross-section. From an energy-saving perspective, this makes sense: when moving downstream, the eel would take advantage of the high velocities in the open waters for efficient locomotion, while at the same time avoiding obstacles along the bed and banks. For upstream movement, high water velocities might make locomotion more energy consuming, forcing the eel to either go to rest or continue swimming in areas with lower velocities (Jonsson, 1991).
The eels in our study showed mainly nocturnal activity, with peak activity in the hours before midnight. The nocturnal nature of eels is well documented in the literature, but the timing of the peak activity varies among studies, with most studies showing peaks in the first half of the night (Aarestrup et al., 2008; Breukelaar et al., 2009; Brown et al., 2009; Gosset et al., 2005; Lennox et al., 2018; Stein et al., 2016; Verhelst et al., 2018). We found that the downstream-swimming eels swam close to the surface during night and at high discharges. The lower parts of the River Ätran are described as having considerable turbidity (Madestam, 2021), and turbidity is typically higher at high discharges than low discharges (e.g., Zabaleta et al. (2007)). This pattern is supported by several visits to the river section during varying flow conditions (Olle Calles, own observation). This behaviour is typical of organisms avoiding surface exposure to predators during daytime while benefiting from other favourable conditions nearer the surface during night. Aarestrup et al. (2009) showed that European eels exhibit distinct diel vertical movements (DVMs) during their oceanic spawning migration. The behaviour in our data did not show as predictable DVMs as in the oceanic data, with other factors influencing depth preferences as well. While eels during oceanic migration are constantly moving, riverine migration is more intermittent, with eels resting on the riverbed for up to 4 days in our data. This corresponds with previous studies documenting periods of 4–5 days of rest (Durif et al., 2002). Thermal stratification in rivers is usually low except for in deep pools, so the advantage of mid-water swimming is likely the higher water velocities closer to the surface. This assumption is supported by the lack of effect from water visibility on vertical preference during upstream movement.
The lateral distribution showed that most of the eels moved downstream in the middle of the river. This was indeed the case also for upstream movement, albeit with a greater use of the bank areas, particularly the right bank. This is a contrast to a previous study by Piper et al. (2015), where eels moved downstream following the streamlines close to the banks. The dissimilarity may be related to the lower water velocities in the channel of that study.
In some contrast to earlier assumptions, we have shown that downstream-migrating silver eels mainly swim in the higher velocity mid-water parts of the river and higher in the water column during night and in turbid conditions (high discharge). In contrast, during upstream swimming eels moved in areas of low velocities along the bottom and to some extent towards the banks, independent of visibility conditions. At the impassable angled rack in front of the HPP intake the eels approached and searched primarily in the deeper parts of the rack, but also explored the upper parts. A majority of the fish exited through the bypass bottom slot, but nearly 30% used the surface slot. In agreement with some recent studies (Egg et al., 2017; Økland et al., 2017) our study indicates that silver eels may not depend on bottom bypasses for successful passage. It is likely that it is the combined design of the rack and escape openings and the associated hydraulic conditions that determines the success of the bypass solutions. As such, the 30° angled (towards the direction of flow) rack with horizontal 15 mm spaced bars and the full depth bypass slot at the lower end installed at Herting HPP may serve as an example, with 72% bypass efficiency among fish that entered the rack area and, including the other bypass options, a 100% impediment passage efficiency. Considering the number of HPPs acting as migration barriers for eels, increasing the bypass efficiency at as many sites as possible should be a high priority if we are to save this critically endangered species.
ACKNOWLEDGEMENTS
Field studies were made possible by Jonas Elghagen, Karl Göran Olofsson and other operators at the Herting HPP and with the assistance of Lennart Schönfelder from SINTEF Energy Research. The study was mainly funded by the SafePASS project through the ENERGIX program of the Research Council of Norway (RCN Project no. 244022) with contributions from 13 hydropower companies, the Norwegian Environment Agency and the Norwegian Water Resources and Energy Directorate. Additional funding was provided by the Norwegian Research Centre for Hydropower Technology—HydroCen (RCN Project no. 257588). Finally, Norwegian University of Science and Technology (NTNU) provided PhD funding for Halvor Kjærås.


