Diets and trophic-guild structure of a diverse fish assemblage in Chesapeake Bay, U.S.A.
Abstract
Dietary habits and trophic-guild structure were examined in a fish assemblage (47 species) of the Chesapeake Bay estuary, U.S.A., using 10 years of data from >25 000 fish stomachs. The assemblage was comprised of 10 statistically significant trophic guilds that were principally differentiated by the relative amounts of Mysida, Bivalvia, Polychaeta, Teleostei and other Crustacea in the diets. These guilds were broadly aggregated into five trophic categories: piscivores, zooplanktivores, benthivores, crustacivores and miscellaneous consumers. Food web structure was largely dictated by gradients in habitat (benthic to pelagic) and prey size. Size classes within piscivorous species were more likely to be classified into different guilds, reflecting stronger dietary changes through ontogeny relative to benthivores and other guilds. Relative to predator species and predator size, the month of sampling had negligible effects on dietary differences within the assemblage. A majority of sampled fishes derived most of their nutrition from non-pelagic prey sources, suggesting a strong coupling of fish production to benthic and demersal food resources. Mysida (predominantly the opossum shrimp Neomysis americana) contributed substantially to the diets of over 25% of the sampled predator groups, indicating that this species is a critical, but underappreciated, node in the Chesapeake Bay food web.
Introduction
The continued development and application of ecosystem-based fisheries management (EBFM) approaches rely in large part on accounting for ecological processes that are known to influence fishery systems and resources (Larkin, 1996; Link, 2002; Latour et al., 2003). Identifying and quantifying trophic interactions within ecosystems are fundamental requirements for EBFM, as they govern ecosystem structure and function (Whipple et al., 2000; Tyrrell et al., 2011). Predator–prey relationships provide the topographic structure of food webs, regulate the flow of energy in the system and mediate most of the direct and indirect effects among species (Wootton, 1998; Link, 2010). Predation can also be the strongest mechanism governing mortality for fishes, exceeding fishing mortality for highly exploited species (Bax, 1991, 1998; Gamble & Link, 2009; Tyrrell et al., 2011). As fisheries management becomes more holistic in its application, detailed dietary information for fishes in managed systems is critical.
Classification of trophic guilds provides a useful framework for simplifying and synthesizing dietary information across a diverse assemblage of organisms. Root (1967) formally defined a guild as ‘a group of species that exploit the same class of environmental resources in a similar way’. Trophic guilds aggregate ecologically similar species that consume similar food resources. Trophic guilds have proven useful in describing the functional roles of species within ecosystems (Franco et al., 2008), identifying species most likely to compete for food resources (Specziár & Rezsu, 2009), simplifying complex food webs (Garrison & Link, 2000) and facilitating comparison across systems (Elliott et al., 2007).
Data on trophic interactions in estuaries are needed for understanding the basic ecology of fishes and to support EBFM, but most trophic studies are limited in species, spatial and temporal coverage. The federal U.S. and Canadian fishery-independent surveys provide ample, long-term dietary information along the north-west Atlantic shelf (Garrison & Link, 2000; Bundy et al., 2011), but similar, extensive diet sampling has historically been lacking from estuarine and nearshore waters of the region. Within estuaries, trophic interaction information for ecosystem modelling endeavours or comprehensive analyses of fish diets is typically garnered from a litany of disparate sources that are often limited in sample size, number of species, spatial coverage, annual duration and seasonal representation (Baird & Ulanowicz, 1989; Marancik & Hare, 2007; Christensen et al., 2009; Frisk et al., 2011). The lack of comprehensive, long-term diet monitoring in estuaries is problematic given the essential role of these habitats as nursery and foraging grounds for numerous migratory and broadly distributed species (Murdy et al., 1997; Able & Fahay, 2010).
In this study, dietary habits are synthesized for a diverse collection of estuarine fishes from Chesapeake Bay, U.S.A. As the largest estuary in the north-west Atlantic, Chesapeake Bay supports a large fraction of the production for several valuable commercial and recreational fisheries throughout the eastern U.S.A. (Murdy et al., 1997; Able & Fahay, 2010). Extensive stomach-content data were obtained from a fishery-independent trawl survey of Chesapeake Bay spanning 10 years and multiple seasons. This study represents the most comprehensive study of fish diets in Chesapeake Bay, and it may also be one of the largest trophic studies of any estuarine fish assemblage in the world. The objectives were to (1) quantify dietary patterns and identify key prey groups for a large suite of estuarine fishes, (2) characterize trophic guilds within the assemblage of fishes, (3) evaluate the dominant gradients regulating resource partitioning and (4) test the relative influence of predator species, predator size and sampling month on dietary differences. This work addresses stated research needs for EBFM in Chesapeake Bay (Houde, 2006) but also applies broadly to ongoing EBFM and ecosystem modelling efforts throughout estuarine and coastal systems of the north-west Atlantic Ocean where many of the studied species are found and fished (Link, 2010; Essington & Punt, 2011). More fundamentally, this work addresses basic ecological questions related to the underlying processes and gradients that structure food webs and niche partitioning.
Materials and methods
Data sources
This study relied on 10 years of data (2002–2011) obtained from the bottom-trawl survey conducted by the ongoing Chesapeake Bay Multispecies Monitoring and Assessment Programme (ChesMMAP) of the Virginia Institute of Marine Science. Full details of the survey gear and sampling design are available elsewhere (Bonzek et al., 2008; Buchheister et al., 2013). Briefly, the survey operated in March, May, July, September and November using an otter trawl designed to target late juvenile and adult fishes. The survey samples 3900 km2 of the mainstem of the Chesapeake Bay, excluding shallow littoral habitats (<3·0 m) that are inaccessible by the research vessel (Fig. 1). The survey area was stratified by latitude (five regional strata) and depth (three strata: 3·0–9·1, 9·1–15·2 and >15·2 m). Each cruise sampled c. 80 stations during daylight hours, with tows typically lasting 20 min.

 , n = 80) and year (
 , n = 398) for the Chesapeake Bay Multispecies Monitoring and Assessment Programme (ChesMMAP) trawl survey.
  delineate the five regional strata and shading denotes the three depth strata (
 , 3·0–9·1;
  , 9·1–15·2;
  , >15·2 m).
Fishes captured at each station were identified, enumerated and weighed. Species exhibiting a broad length range or distinct length groups were divided into two to four size classes. Random sub-samples of these species–size class groups were processed for length (fork length for teleosts, pre-caudal length for sharks and disc width for batoids, and mass). Stomachs were excised and preserved in Normalin fixative for later diet determination. If stomachs were visually confirmed to be empty in the field, additional specimens (when available) were processed to obtain three to five non-empty stomachs for the species and size class. All protocols pertaining to sampling and euthanizing fishes were approved by the College of William and Mary's Institutional Animal Care and Use Committee. Northern kingfish Menticirrhus saxatilis (Bloch & Schneider 1801) and southern kingfish Menticirrhus americanus (L. 1758) were combined to avoid misidentification problems caused by damage to the elongate dorsal spine that aids in identifying M. saxatilis.
In the laboratory, stomach contents were sorted and identified to the lowest possible taxon. Wet masses were collected for each prey taxon in their various states of digestion. Fresh masses of prey could not be backcalculated given the lack of hard parts for many prey remnants (e.g. annelids and bivalve siphons), and taking dry mass measurements was unfeasible given the scale of sampling. Although the methodology is consistent with other large-scale surveys and trophic-guild studies, it is acknowledged that these methods may bias the magnitude of trophic linkages towards prey types that are harder to digest, assimilate or evacuate (Fry, 2006; Chipps & Garvey, 2007).
Prey were aggregated into 59 prey groups (Table 1) to (1) account for the difficulty in identifying some prey to species (due in part to variability in prey digestive state), (2) simplify the >400 unique prey codes recorded and (3) achieve a balance between capturing individual prey species of significance and providing broader functional groupings when individual species were less important. Particularly important prey that accounted for a substantial portion of the mean diet for a predator (>15% by mass) were retained at the species level or at a lower taxonomic level such as genus or family. In some cases, a prey group (e.g. Engraulidae and Mysida) was predominantly represented by a single species although other rarer species were included (Table 1). When possible, prey groups were defined at the family level; however, broader resolution was needed for some groups, notably the non-crustacean invertebrates. All statistical analyses were based on the 59 prey groups, but groups were aggregated into 12 general taxonomic and functional groupings to simplify the presentation of results while still preserving the major dietary differences among predators (Table 1). For the general prey groupings, any unidentified teleosts were allocated proportionally to the pelagic and demersal fish groupings.
| General prey grouping | Scientific name | Common name |
|---|---|---|
| Bivalvia | Bivalvia | Bivalves |
| Copepoda | Copepoda | Copepods |
| Crustacea* | Amphipoda | Unclassified amphipod |
| Anomura | Anomuran crabs | |
| Brachyura | True crabs | |
| Cancridae | Cancer crabs | |
| Caridea | Caridean shrimp | |
| Cirripedia | Barnacles | |
| Corophiida | Corophiidan amphipods | |
| Crangonidae | Crangonid shrimp | |
| Crustacea | Unclassified crustacean | |
| Cumacea | Hooded shrimps | |
| Decapoda - crab | Decapod crabs | |
| Decapoda - shrimp | Decapod shrimps | |
| Dendrobranchiata | Prawns | |
| Gammaridea | Gammaridean amphipods | |
| Isopoda | Isopods | |
| Paguridae | Pagurid hermit crabs | |
| Panopeidae | Mud crabs | |
| Penaeidae | Penaeid shrimp | |
| Portunidae | Portunid crabs | |
| Squillidae | Mantis shrimps | |
| Tanaidacea | Tanaids | |
| Thalassinidea | Ghost shrimps | |
| Gastropoda | Gastropoda | Snails |
| Miscellaneous | Anthozoa | Corals and anemones |
| Ascidiacea | Sea squirts | |
| Branchiostomidae | Lancelets | |
| Bryozoa | Moss animals | |
| Cephalopoda | Cephalopods | |
| Ctenophora | Comb jellies | |
| Echinodermata | Echinoderms | |
| Hydrozoa | Hydroids | |
| Insecta | Insects | |
| Miscellaneous | Miscellaneous or inorganic item | |
| Miscellaneous zooplankton | Miscellaneous zooplankton | |
| Plant matter | Plant matter | |
| Unidentified or other mollusca | Unidentified or other mollusca | |
| Mysida | Mysida (mostly Neomysis americana) | Mysid shrimp |
| Polychaeta | Polychaeta | Polychaete worms |
| Other annelida | Other worms | |
| Scyphozoa | Scyphozoa | True jellyfish |
| Teleostei-demersal | Cynoscion regalis | Weakfish |
| Leiostomus xanthurus | Spot | |
| Micropogonias undulatus | Atlantic croaker | |
| Moronidae | Temperate basses | |
| Other Sciaenidae | Other drum | |
| Other Teleostei and Elasmobranchii | Other fishes | |
| Phycidae | Phycid hakes | |
| Pleuronectiformes | Flatfish | |
| Sparidae | Porgies | |
| Syngnathidae | Seahorses and pipefishes | |
| Triglidae | Sea robins | |
| Teleostei-pelagic | Brevoortia tyrannus | Menhaden |
| Engraulidae (mostly Anchoa mitchilli) | Anchovies | |
| Other Clupeidae | Herrings | |
| Pomatomidae | Bluefishes | |
| Teleostei-unidentified | Unidentified teleostei | Unidentified fish |
| Unidentified | Unidentified material | Unidentified material |
- * Excluding Copepoda and Mysida.
Data for this study were restricted to fish species with non-empty stomachs sampled from >15 stations. Empty stomachs were excluded as they did not provide information on relative importance among prey types, but those data have been analysed in other work (Buchheister, 2013). Where appropriate, predators were divided into multiple size classes. For each predator and size class combination, diets were summarized gravimetrically using a cluster sampling estimator (Bogstad et al., 1995; Buckel et al., 1999; Latour et al., 2008). Per cent diet composition of each prey group (k) by mass (%Dk) was calculated as 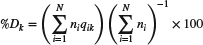 , where qik = mikmi− 1, N = the number of trawls containing the predator, ni = the number of individuals of the predator collected at sampling site i, mi = the total mass of all prey groups encountered in the stomachs of the predator from sampling site i and mik = the total mass of prey group k occurring in the predator stomachs from sampling site i.
This cluster sampling estimator accounts for the lack of independence among fish collected at the same sampling location; individuals from the same station typically have relatively similar diets and are thus pseudoreplicates (Bogstad et al., 1995). Given the approximately equal stomach sampling effort across stations, this estimator also provides a more accurate population-level description of diet than a simple mean because the estimate is weighted by the number of fishes caught at each station (Bogstad et al., 1995). Diet indices were developed for each predator size-class combination, using data pooled across years, months and regions, unless otherwise indicated.
Size-class determination
Ontogenetic shifts in feeding are common among fishes, and individuals can occupy substantially different ecological niches in the environment as they grow and mature (Wootton, 1998; Scharf et al., 2000; Specziár & Rezsu, 2009). To account for discernible ontogenetic differences in feeding habits, hierarchical agglomerative cluster analysis (with group-average linkage) was used to identify size classes whose diets were dissimilar. Within each species, diets were calculated for length bins of 25 mm, which represented a compromise between maintaining adequate sample sizes and achieving small length bins. A cluster analysis was run based on a Bray–Curtis similarity matrix for the size groups (Latour et al., 2008; Specziár & Rezsu, 2009). Designation of size classes (S, small; M, medium; L, large) was determined from cluster analysis results, provided that (1) size-based groupings were evident, (2) sample sizes within a size class were greater than an arbitrary threshold (>15 stations) and (3) prey saturation curves for each size class approached a stable maximum. This relatively objective analytical approach to determining size classes was used to avoid subjective length delineations with small sample sizes or without statistical significance (Specziár & Rezsu, 2009). Species–size class combinations (hereafter termed predator groups) were treated as functionally distinct predators for all remaining analyses. Cluster analyses were conducted using the statistical package R (www.r-project.org).
Multivariate analyses of trophic guilds
Two multivariate statistical methods were used to aggregate predator groups into trophic guilds. First, hierarchical agglomerative clustering with group-average linkage was used to identify trophic guilds of fishes. Cluster analysis relied on Bray–Curtis dissimilarities and sequentially aggregated predator groups together based on dietary similarity. Statistically significant cluster groupings were identified using a bootstrap randomization technique in which the non-zero values in the predator–prey diet matrix were resampled (with replacement) and used to generate pseudovalues of Bray–Curtis dissimilarities under the null hypothesis of there being no structure in the diet matrix (Jaksic & Medel, 1990). A frequency distribution of pseudovalues was generated from 1000 randomizations of the diet matrix, and the 95th percentile was used as the critical value to determine significance in the cluster analysis of the observed data (Jaksic & Medel, 1990). Second, non-metric multidimensional scaling (NMDS) was used to corroborate and visualize trophic-guild designations from the cluster analysis. NMDS is a non-parametric ordination technique that relied on the rank order of pair-wise predator dietary dissimilarities (Bray–Curtis dissimilarities in this study), and it does not make any underlying distributional assumptions of the data (Clarke & Warwick, 2001). NMDS was chosen over other parametric ordination approaches because the diet data were skewed and not normally distributed. Predators were plotted in ordination space with distance among points being positively related to dietary dissimilarity (i.e. predators with similar diets plot more closely to one another). All multivariate analyses were conducted with either R or PRIMER (www.primer-e.com).
Two approaches were used to identify the most influential prey groups within and across trophic guilds. First, to identify the prey groups most responsible for the significant trophic-guild classifications, a similarity percentage analysis (SIMPER) routine was used in PRIMER to decompose the average similarity ( ) between all pairs of predators within a guild into percentage contributions from each prey group (Clarke & Warwick, 2001). This method highlights the prey groups most responsible for within-guild dietary similarity. Prey groups whose
  was more than 20% greater than the s.d. of similarity values (S) were indicative of prey groups that were more consistently important across predators within a guild (Clarke & Warwick, 2001). Second, the importance of individual prey groups to the fish assemblage as a whole was evaluated based on the number of predators deriving an appreciable amount of nutrition from each prey group. The number of predator groups whose diets comprised at least 20% of a prey group was calculated. Analysis focused on only those prey groups (n = 9) with ≥20% dietary contribution to at least three predator groups. The per cent occurrence of each of these nine prey groups across the fish assemblage was also calculated, based on the presence or absence of the prey in the mean diet of each predator group.
Additional analyses were conducted to assess the relative influence of predator species, predator size and sampling month on diets. To maintain adequate sample sizes, analyses focused on the six most sampled species: Atlantic croaker Micropogonias undulatus (L. 1766), summer flounder Paralichthys dentatus (L. 1766), weakfish Cynoscion regalis (Bloch & Schneider 1801), striped bass Morone saxatilis (Walbaum 1792), white perch Morone americana (Gmelin 1789) and spot Leiostomus xanthurus Lacépède 1802. These six species accounted for 65% of total stomachs analysed in this study (Table 2) and comprised 76% of the total biomass captured by the survey (Buchheister et al., 2013). For this species sub-set, NMDS was conducted using a Bray–Curtis dissimilarity matrix derived from diet estimates by species, size class and month. Analysis of similarity (ANOSIM) was used in PRIMER to test for significant differences in dietary similarity among the three factors (species, size classes and months) using one-way and two-way crossed analyses (Bundy et al., 2011; French et al., 2013). ANOSIM is a multivariate permutation test [conceptually similar to a univariate analysis of variance (ANOVA)] that relies on a test statistic, R, whose value determines a factor's significance and can be used to assess the relative importance of factors (Clarke & Warwick, 2001). For a two-way crossed ANOSIM, the effect of one factor is tested after accounting for the effect of the second factor.
| Latin name | Common name | Abbreviation | No. Stom. | No. Stat. | Size classes (mm) | ||
|---|---|---|---|---|---|---|---|
| Small | Medium | Large | |||||
| Alosa aestivalis | Blueback herring | Aaes | 73 | 35 | — | 75–274 | — |
| Alosa mediocris | Hickory shad | Amed | 29 | 28 | — | 75–374 | — |
| Alosa pseudoharengus | Alewife | Apse | 360 | 162 | — | 50–299 | — |
| Alosa sapidissima | American shad | Asap | 53 | 35 | — | 100–499 | — |
| Ameiurus catus | White catfish | Acat | 28 | 16 | — | 175–624 | — |
| Archosargus probatocephalus | Sheepshead | Apro | 84 | 51 | — | — | 425–649 |
| Bairdiella chrysoura | Silver perch | Bchr | 217 | 114 | — | 75–224 | — |
| Carcharhinus plumbeus | Sandbar shark | Cplu | 26 | 22 | — | 375–874 | — |
| Centropristis striata | Black sea bass | Cstr | 225 | 141 | — | 50–274 | — |
| Chaetodipterus faber | Atlantic spadefish | Cfab | 250 | 136 | 25–124 | 125–549 | — |
| Chilomycterus schoepfii | Striped burrfish | Csch | 150 | 117 | — | 75–299 | — |
| Cynoscion regalis | Weakfish | Creg | 5060 | 1301 | 25–99 | 100–324 | 325–624 |
| Dasyatis americana | Southern stingray | Dame | 108 | 71 | 200–349 | 350–924 | — |
| Dasyatis sabina | Atlantic stingray | Dsab | 52 | 41 | 150–349 | 350–599 | — |
| Dasyatis say | Bluntnose stingray | Dsay | 246 | 152 | 175–399 | 400–774 | — |
| Gymnura altavela | Spiny butterfly ray | Galt | 57 | 39 | — | 375–2124 | — |
| Gymnura micrura | Smooth butterfly ray | Gmic | 38 | 31 | — | 350–874 | — |
| Ictalurus punctatus | Channel catfish | Ipun | 103 | 50 | 200–449 | 450–549 | — |
| Larimus fasciatus | Banded drum | Lfas | 58 | 31 | — | 25–224 | — |
| Leiostomus xanthurus | Spot | Lxan | 1597 | 645 | — | 50–199 | 200–249 |
| Menticirrhus spp. | Kingfishes | Ment | 893 | 417 | 25–199 | 200–399 | — |
| Micropogonias undulatus | Atlantic croaker | Mund | 2949 | 1095 | 25–149 | 150–349 | 350–499 |
| Morone americana | White perch | Mame | 1853 | 560 | 75–149 | 150–374 | — |
| Morone saxatilis | Striped bass | Msax | 2639 | 970 | 25–199 | 200–599 | 600–1074 |
| Mustelus canis | Smooth dogfish | Mcan | 301 | 155 | — | 300–649 | 650–1224 |
| Myliobatis freminvillii | Bullnose ray | Mfre | 138 | 86 | 225–549 | 550–1330 | — |
| Opsanus tau | Oyster toadfish | Otau | 96 | 74 | — | 25–424 | — |
| Orthopristis chrysoptera | Pigfish | Ochr | 55 | 31 | — | 75–224 | — |
| Paralichthys dentatus | Summer flounder | Pden | 2867 | 1695 | 125–249 | 250–374 | 375–724 |
| Peprilus paru | Harvestfish | Ppar | 123 | 67 | — | 25–199 | — |
| Peprilus triacanthus | Butterfish | Ptri | 90 | 38 | — | 25–224 | — |
| Pogonias cromis | Black drum | Pcro | 64 | 45 | 150–299 | — | — |
| Pomatomus saltatrix | Bluefish | Psal | 244 | 149 | 100–274 | 275–549 | — |
| Prionotus carolinus | Northern searobin | Pcar | 764 | 338 | — | 25–224 | — |
| Prionotus evolans | Striped searobin | Pevo | 194 | 147 | 25–149 | 150–274 | — |
| Raja eglanteria | Clearnose skate | Regl | 826 | 387 | 75–374 | 375–524 | — |
| Rhinoptera bonasus | Cownose ray | Rbon | 82 | 61 | — | 225–599 | 600–1024 |
| Scophthalmus aquosus | Windowpane | Saqu | 300 | 204 | 50–174 | 175–349 | — |
| Selene setapinnis | Atlantic moonfish | Sset | 70 | 38 | — | 25–174 | — |
| Selene vomer | Lookdown | Svom | 33 | 23 | — | 50–149 | — |
| Sphoeroides maculatus | Northern puffer | Smac | 995 | 384 | — | 25–274 | — |
| Squalus acanthias | Spiny dogfish | Saca | 70 | 30 | — | 600–949 | — |
| Stenotomus chrysops | Scup | Schr | 733 | 314 | — | 50–224 | — |
| Synodus foetens | Inshore lizardfish | Sfoe | 25 | 21 | — | 100–324 | — |
| Tautoga onitis | Tautog | Toni | 40 | 19 | — | 225–599 | — |
| Trinectes maculatus | Hogchoker | Tmac | 178 | 124 | — | 75–199 | — |
| Urophycis regia | Spotted hake | Ureg | 516 | 255 | 50–149 | 150–324 | — |
| Total | 25 952 | 10 945 | |||||
Results
Diets of 47 fish species (36 teleosts and 11 elasmobranchs) were analysed for this study, based on a total of 25 952 non-empty stomachs (Table 2). Of the 47 species included in the study, 20 species were divided into two or three size classes, yielding 71 different species–size class combinations, or predator groups. For all predator groups, diet composition estimates and associated coefficients of variation (c.v.) can be found in Table SI (Supporting Information). The median c.v. for diet composition estimates was 0·23 after excluding the more variable prey groups that were <5% of a predator's diet (for all data, median c.v. = 0·59). Predators consumed a median of 22 distinct prey groups indicative of a flexibility in feeding. This study included c. 25–35% of the 267 Chesapeake Bay fishes described by Murdy et al. (1997) after excluding vagrant species rarely found in the bay's mainstem. Only two of the biomass-dominant species from the mainstem, Atlantic menhaden Brevoortia tyrannus (Latrobe 1802) and bay anchovy Anchoa mitchilli (Valenciennes 1848), were not sampled because they are pelagic and not efficiently captured by the gear (Jung & Houde, 2003; Buchheister et al., 2013).
Dietary patterns and trophic guilds
The trophic-guild analyses yielded robust groupings of fishes that displayed significantly different food habits. The cluster analysis (cophenetic correlation = 0·78) and bootstrap randomization identified 10 unique trophic guilds that characterize the diversity of feeding modes among Chesapeake Bay fishes (Fig. 2). A dissimilarity value of 0·69 was determined to be the critical value for group significance; any groupings with a dissimilarity <0·69 were unlikely to have occurred by chance (P < 0·05; Jaksic & Medel, 1990). Dietary differences among trophic guilds were largely evident when prey were aggregated into general prey groupings (Fig. 2). Some guilds, however, were differentiated by taxonomic differences at finer scales, as seen in the full predator–prey diet matrix with all 59 prey groups (Table SI, Supporting Information). To classify broader patterns in consumptive habits, pairs of guilds (designated as a and b) were aggregated into five major feeding categories (Fig. 2): piscivores (PISC), zooplanktivores (ZOOP), benthivores (BENT), crustacivores (CRUS; defined as predominant consumers of Crustacea, excluding Mysida and Copepoda) and miscellaneous consumers (MISC).

 ), based on a bootstrap randomization test (α = 0·05). Trophic guilds were aggregated into five broader categories (PISC, piscivores; ZOOP, zooplanktivores; BENT, benthivores; CRUS, crustacivores; MISC, miscellaneous consumers). Within each broad trophic category, significant guilds are indicated with letters (a and b),
  and
and  (to the right). Gravimetric diet compositions for the predator groups are summarized by general prey groupings (
 , miscellaneous;
  , unidentified;
  , Polychaeta;
  , Bivalvia;
  , Gastropoda;
  , Crustacea;
  , Mysida;
  , Teleost-demersal;
  , Teleost-pelagic;
  , Copepoda;
  , Scyphozoa), with prey organized along a benthic to pelagic gradient.
The broad piscivore category included 15 predator groups (10 species) that mostly consumed fishes but were differentiated by the size and type of fish consumed (Figs 2 and 3). The PISC-a guild, included higher trophic-level predators [L C. regalis, L M. saxatilis, M bluefish Pomatomus saltatrix (L. 1766), sandbar shark Carcharhinus plumbeus (Nardo 1827) and spiny dogfish Squalus acanthias L. 1758] and was characterized by consumption of large pelagic fishes (Figs 2 and 3). Brevoortia tyrannus in particular was the prey most strongly responsible for the intra-guild dietary similarity (contributing 61·1% of the total) based on the SIMPER analysis (Table 3). The PISC-b guild consumed greater proportions of smaller pelagic fishes (mostly Engraulidae) and demersal fishes including juvenile sciaenids (Figs 2 and 3, and Table 3). PISC-b predators included smaller size classes of three PISC-a species (M C. regalis, S P. saltatrix, and S and M M. saxatilis) as well as M and L P. dentatus, inshore lizardfish Synodus foetens (L. 1766), hickory shad Alosa mediocris (Mitchill 1814), spiny butterfly ray Gymnura altavela (L. 1758) and smooth butterfly ray Gymnura micrura (Bloch & Schneider 1801). Large P. dentatus and Gymnura rays consumed a large proportion (58–83%) of demersal fishes (mainly L. xanthurus and M. undulatus), and this cluster was close to being sufficiently different to constitute a separate trophic guild (Fig. 2). Diets of fishes from the two significant piscivore guilds were augmented predominantly by Mysida and other crustacean prey, most notably for C. regalis (M and L), C. plumbeus, P. dentatus (M and L) and M. saxatilis (S and M) (Fig. 2).

 denote the interquartile range with the median indicated.
  extend to the most extreme value that is no further than 1·5× the interquartile range from the box. Outliers are shown (
 ).
). ) within each of the 10 trophic guilds based on the similarity percentage routine (SIMPER) results. Contributions <5% are excluded (—). Bold values denote prey groups that are more consistently important across the predators in a guild (defined by
  divided by s.d. (S) >1·2). See Fig. 2 for trophic-guild definitions
| Prey category | Prey group | PISC | ZOOP | BENT | CRUS | MISC | |||||
|---|---|---|---|---|---|---|---|---|---|---|---|
| a | b | a | b | a | b | a | b | a | b | ||
| Bivalvia | Bivalvia | — | — | — | — | 10·9 | 60·2 | 18·6 | — | — | — |
| Copepoda | Copepoda | — | — | — | 40·0 | — | — | — | — | — | — |
| Crustacea | Corophiida | — | — | — | — | — | — | — | 5·2 | — | — |
| Crangonidae | — | — | 6·2 | — | — | — | — | — | — | — | |
| Decapoda - crab | — | — | — | — | — | 6·2 | 5·5 | 9·9 | — | — | |
| Paguridae | — | — | — | — | — | — | — | — | 8·6 | — | |
| Panopeidae | — | — | — | — | — | — | — | 32·4 | — | — | |
| Portunidae | — | — | — | — | — | — | 14·5 | — | — | — | |
| Squillidae | — | — | — | — | — | — | 25·3 | — | — | — | |
| Teleostei-demersal | Cynoscion regalis | — | 6·1 | — | — | — | — | — | — | — | — |
| Leiostomus xanthurus | — | 10·0 | — | — | — | — | — | — | — | — | |
| Teleostei-pelagic | Brevoortia tyrannus | 61·1 | — | — | — | — | — | — | — | — | — |
| Engraulidae | — | 37·6 | — | — | — | — | — | — | — | — | |
| Teleostei-unidentified | Unidentified teleostei | 18·5 | 14·0 | — | — | — | — | 6·6 | 12·5 | — | — |
| Scyphozoa | Scyphozoa | — | — | — | — | — | — | — | — | — | 88·1 |
| Miscellaneous | Unidentified or other Mollusca | — | — | — | — | — | 7·6 | — | — | — | — |
| Mysida | Mysida | — | 14·7 | 79·6 | 21·0 | — | — | — | — | — | — |
| Gastropoda | Gastropoda | — | — | — | — | — | — | — | — | 81·8 | — |
| Unidentified | Unidentified material | — | — | — | 30·4 | 28·4 | 7·9 | — | 12·5 | — | 11·3 |
| Polychaeta | Polychaeta | — | — | — | — | 41·3 | — | — | — | — | — |
| Average within-guild similarity | 50·0 | 41·2 | 61·0 | 58·8 | 46·0 | 47·9 | 38·2 | 39·6 | 73·2 | 87·6 | |
Zooplanktivores, including 17 predator groups (14 species), consumed large amounts of zooplankton, primarily Mysida and Copepoda. The ZOOP-a guild was the larger of the two zooplanktivore guilds (14 predator groups and 11 species) and relied heavily on Mysida (28–94% of diet by mass). The opossum shrimp Neomysis americana was the overwhelmingly dominant mysid species, accounting for 99% of all mysid occurrences identifiable to species. Mysida alone accounted for 79·6% of the similarity within the ZOOP-a guild (Table 3). This guild included small size classes of some piscivores (C. regalis and P. dentatus), as well as silver perch Bairdiella chrysoura (Lacépède 1802), Atlantic moonfish Selene setapinnis (Mitchill 1815), windowpane Scophthalmus aquosus (Mitchill 1815), banded drum Larimus fasciatus Holbrook 1855, spotted hake Urophycis regia (Walbaum 1792), northern searobin Prionotus carolinus (L. 1771), striped searobin Prionotus evolans (L. 1766), lookdown Selene vomer (L. 1758) and Atlantic stingray Dasyatis sabina (Lesueur 1824). Three alosines [alewife Alosa pseudoharengus (Wilson 1811), American shad Alosa sapidissima (Wilson 1811) and blueback herring Alosa aestivalis (Mitchill 1814)] comprised the ZOOP-b guild with diets dominated by Copepoda (18–66%), Mysida (7–46%) and other unidentified material (16–25%; Figs 2 and 3). Each of these prey groups contributed substantially to the intra-guild similarity (Table 3).
Benthivores represented the largest feeding category, including 23 predator groups from 16 species. All benthivores consumed a mixture of Polychaeta, Bivalvia, unidentified material and Crustacea in varying proportions (Figs 2 and 3). The major bivalve species consumed included Ensis directus, Gemma, Macoma spp., Mercenaria mercenaria, Mya arenaria and Tagelus plebeius. The eastern oyster Crassostrea virginica was only identified twice in the stomachs, but its densities are greater in shallower habitats that were not sampled. Fishes commonly foraged on bivalve siphons, preventing detailed identification. Common polychaete annelids included the Nereis, Pectinaria, and Glycera genera, with additional representation from the Maldanidae, Terebellidae, Chaetopteridae and Capitellidae families. The two significant benthivore guilds were largely differentiated by the predominance of Polychaeta (BENT-a) or Bivalvia (BENT-b) in the stomachs (Figs 2 and 3, and Table 3). The BENT-a guild consumed Polychaeta (1–76%) and unidentified material (2–63%) to a larger extent than the BENT-b guild (Fig. 3) and included a variety of predator species: M. undulatus (all sizes), L. xanthurus (M and L), scup Stenotomus chrysops (L. 1766), hogchoker Trinectes maculatus (Bloch & Schneider 1801), S Menticirrhus, S and M bluntnose stingray Dasyatis say (Lesueur 1824), pigfish Orthopristis chrysoptera (L. 1766), S southern stingray Dasyatis americana Hildebrand & Schroeder 1928, S and M M. americana, S and M Atlantic spadefish Chaetodipterus faber (Broussonet 1782) and black drum Pogonias cromis (L. 1766) (Fig. 2). The BENT-b guild generally exhibited higher consumption of Bivalvia (21–63%; Fig. 3) and included the northern puffer Sphoeroides maculatus (Bloch & Schneider 1801), sheepshead Archosargus probatocephalus (Walbaum 1792), tautog Tautoga onitis (L. 1758), M and L cownose ray Rhinoptera bonasus (Mitchill 1815) and striped burrfish Chilomycterus schoepfii (Walbaum 1792) (Fig. 2).
Crustacivores were the fourth identified trophic category and contained 12 predator groups (nine species), all of which fed on a variety of Crustacea, particularly decapod shrimp, decapod crabs and Squillidae. The CRUS-a guild diets were variable with no single unifying prey group, but the SIMPER analysis indicated that Squillidae, Bivalvia, Portunidae, unidentified Teleostei and other decapod crabs were the prey most responsible for dietary similarity within the guild (Table 3). Some CRUS-a predators had appreciable (c. 20%) consumption of Bivalvia [clearnose skate Raja eglanteria Bosc 1800, M Menticirrhus and channel catfish Ictalurus punctatus (Rafinesque 1818)] or Polychaeta (M D. sabina and M D. americana) that were similar to the benthivores (Figs 2 and 3). The CRUS-b guild [black sea bass Centropristis striata (L. 1758), oyster toadfish Opsanus tau (L. 1766), S I. punctatus and white catfish Ameiurus catus (L. 1758)] shared a stronger reliance on panopeid mud crabs (11–29% of diets) (Figs 2 and 3). Unidentified Teleostei, unidentified material, decapod crabs and Corophiida also contributed to the intra-guild similarity (Table 3).
The fifth general trophic category of miscellaneous consumers included two guilds that were grouped for convenience as opposed to dietary similarity. The MISC-a guild, S and M bullnose ray Myliobatis freminvillii Lesueur 1824, was more closely related to the crustacivores and benthivores, but they fed predominantly on Gastropoda (60–83%; Figs 2 and 3), which alone accounted for 81·8% of the guild's similarity (Table 3). The MISC-b guild consisted of two Peprilus congeners that can be classified as gelatinous zooplanktivores, with 77–86% of the diet coarsely identified as scyphozoan cnidarians.
NMDS scaling corroborated the cluster analysis results, establishing clear multivariate differences in predator diets among the five major trophic categories and the 10 guilds (Fig. 4). Slight overlap among trophic categories or guilds reflected the gradual and transitional nature of dietary differences among predators that was not as visually prominent in the discretized approach of cluster analysis. NMDS does not account for any explanatory variables and NMDS plots can be rotated freely (i.e. they are not constrained to specific axes such as parametric ordination methods). Two seemingly independent trophic gradients, however, emerged from the NMDS plots. As presented, the y-axis reflected a size gradient from smaller to larger prey, with consumers of Polychaeta, Copepoda, Mysida and gelatinous zooplankton plotted below consumers of Squillidae, portunid crabs and teleosts (Fig. 4). The x-axis of the NMDS plot largely segregated guilds along a benthic to pelagic habitat gradient; consumers of infaunal and epifaunal benthic organisms (the benthivores and crustacivores) grouped together to the left of consumers of more mobile prey that can be found in the water column (zooplanktivores and piscivores) (Fig. 4).

 , PISC-a;
  , PISC-b;
  , ZOOP-a;
  , ZOOP-b;
  , BENT-a;
  , BENT-b;
  , CRUS-a;
  , CRUS-b;
  , MISC-a;
  , MISC-b; see Fig. 2 for definitions). Predator groups with similar diets plot more closely to one another. (b) NMDS plot highlighting predator groups with multiple size classes. Species with more drastic ontogenetic diet shifts had size classes designated into different trophic guilds (filled, coloured symbols), whereas some species (open, coloured symbols) had all size classes classified into the same guild. Arrows sequentially join the size classes within a species and point to the larger size class. For these species, the largest size class is labelled with the species code from Table 2. Predator species without multiple size classes are plotted as
  .
.The main pelagic prey resources were B. tyrannus, Engraulidae, Copepoda and Scyphozoa, whereas most other prey groups can be considered demersal or benthic. After apportioning unidentified Teleostei to pelagic and demersal components, only 10/71 predator groups derived >50% of their diets directly from pelagic sources, with most of these predators in the piscivore guilds. Thus, the majority (86%) of predator groups were primarily supported through non-pelagic food resources.
Few individual prey groups were consistently important (i.e. dietary contribution ≥20% by mass) across multiple predators, even if the prey occurred in a majority of predators. Mysida was the most essential prey, accounting for ≥20% of the mean diet in 27% of predator groups (19 out of 71) and occurring in 85% of predators groups (60 out of 71) [Fig. 5]. Polychaeta, Bivalvia and unidentified material each contributed substantially to the diet of c. 17–18% of sampled predator groups. Engraulidae, B. tyrannus, Squillidae, unidentified Teleostei and L. xanthurus were each important in the diets of 4–7% of sampled predators. Many of these prey groups occurred in a majority of the predators [70–96%; Fig. 5(b)]. Only B. tyrannus, Squillidae, and L. xanthurus occurred in less than half of the sampled predators [28–48%; Fig. 5(b)].

Ontogenetic and seasonal variability
Length-based, ontogenetic differences in diets were substantial for several of the species examined. Of the 20 species divided into multiple size classes, eight species had size classes designated into different trophic guilds (D. sabina, P. saltatrix, I. punctatus, Menticirrhus, D. americana, M. saxatilis, P. dentatus and C. regalis), although three of these remained within the same broad trophic category (P. saltatrix, I. punctatus and M. saxatilis) [Fig. 4(b)]. Ontogenetic effects on fish diets were stronger for piscivores, with ZOOP-a and PISC-b often acting as precursors for the terminal PISC-a guild. Benthivorous species demonstrated a weaker ontogenetic signal that was less ecologically significant, as a larger proportion of these species remained within the same trophic guild as they grew (e.g. M. undulatus, L. xanthurus and M. americana). Larger size classes within all 20 species, however, always plotted higher than smaller size classes in the NMDS plot, consistent with an underlying prey size gradient [Fig. 4(b)].
Analyses focused on the sub-set of predators with the largest sample sizes indicated that monthly differences in diets tended to be minimal with respect to the differences observed across species or across size classes. All one-way and two-way ANOSIM tests of species effects on diets were significant (Table 4). Size class effects were significant in the one-way test and also after accounting for any species effects. In contrast, all tests of the month effect were not significant, even after accounting for differences among species or size classes. The relative values of the test statistic R (Table 4) suggest that the effect of species was the strongest, followed by size class and lastly by month. ANOSIM results were corroborated visually by an NMDS plot of diet data summarized by predator, size class and month (Fig. 6). The NMDS demonstrated that monthly diets were typically more similar for each species–size class combination, as compared with the stronger differences among species or size classes. For some predators (C. regalis and P. dentatus), however, diets were notably different in March and May due to above average consumption of Crangonidae (Fig. 6), indicating that seasonal dietary shifts can occur depending on prey availability.
| Factor 1 | Factor 2 | R | Significant level (%) |
|---|---|---|---|
| Species | — | 0·57 | 0·1 |
| Species | Size class | 0·694 | 0·1 |
| Species | Month | 0·546 | 0·1 |
| Size class | — | 0·2 | 0·1 |
| Size class | Species | 0·454 | 0·1 |
| Size class | Month | 0·125 | 5·8 |
| Month | — | 0·026 | 20·5 |
| Month | Species | 0·012 | 45·6 |
| Month | Size class | −0·053 | 79·2 |

 , Micropogonias undulatus;
  , Leiostomus xanthurus;
  , Morone saxatilis;
  , Paralichthys dentatus;
  , Cynoscion regalis;
  , Morone americana), and size classes are indicated by shape (
 , S, small;
  , M, medium;
  , L, large). Multiple, identical symbols denote different months of sampling. Ellipses and labels designate trophic-guild classification based on the predator and size class. March and May diets with high contributions of crangonid shrimp (12–56%) are demarked with the dashed polygon.
Discussion
This study synthesized diet data for a broad assemblage of estuarine fishes and classified predators into 10 functionally different trophic guilds. These trophic guilds consumed varying amounts of five principal prey groups (Mysida, Bivalvia, Polychaeta, Teleostei and other Crustacea), of which Mysida appeared particularly important. Trophic guild structure was arranged along two gradients of body size and vertical habitat that can act to minimize competition and niche overlap among predators, as observed in other estuarine and marine systems (Garrison & Link, 2000; Marancik & Hare, 2007; French et al., 2013). The present work demonstrates the basic trophic structuring of a large estuarine assemblage and the functional roles that different predators play within the ecosystem.
Trophic structure and trophodynamic gradients
The general trophic structure of the Chesapeake Bay fish assemblage was comparable to the structure in other fish communities. The Chesapeake Bay fishes described in this study were largely carnivorous generalists that fed on a diversity of animal prey, and this characteristic is typical of many fishes in estuarine and marine ecosystems (Gerking, 1994; Franco et al., 2008). Herbivory and direct detritivory are more common in lower latitudes (Horn, 1989; Franco et al., 2008) and thus were not prevalent in the present temperate estuary; however, the survey did not sample two common Chesapeake Bay fishes known to consume detritus [gizzard shad Dorosoma cepedianum (Lesueur 1818) and common mummichog Fundulus heteroclitus (L. 1766)] because they reside in shallower habitats (Allen et al., 1994; Yako et al., 1996).
The prey habitat gradient was arranged from benthic to pelagic environments, but the majority of consumption was directly derived from non-pelagic sources. As shown in other studies, the vertical habitat gradient distinguishes benthivores from zooplanktivores and piscivores (Garrison & Link, 2000; Marancik & Hare, 2007; Reum & Essington, 2008), but habitat gradients can also be arranged along other spatial variables of importance such as depth (Colloca et al., 2010) or benthic structure (e.g. seagrasses and reefs; Marancik & Hare, 2007). As with other eutrophic estuaries, the Chesapeake Bay is a system dominated by pelagic primary production (Baird & Ulanowicz, 1989; Diaz & Schaffner, 1990; Kemp et al., 2005), but the data suggest that most of the carbon directly fuelling the studied fishes (at the sizes examined) is funnelled through the benthic food web via filter-feeding, detritivorous or omnivorous invertebrates. Mysida, in particular, act as a unique biological conduit for coupling pelagic and benthic food webs because they make diel vertical migrations, making them vulnerable to predation in both habitats (Jumars, 2007). By residing near the benthos but feeding nocturnally in the water column, Mysida have a more pelagic isotopic signature (Woodland & Secor, 2013) and thus act as a more direct pathway for transporting pelagic carbon to benthic and demersal predators. This migratory mysid behaviour also explains the placement of ZOOP-a predators as being more pelagic than benthivores and crustacivores in the NMDS plot (Fig. 4). Similar reliance on Mysida and benthic food sources has been noted in other U.S. and European systems (Franco et al., 2008; Reum & Essington, 2008; Woodland & Secor, 2013).
The body size gradient was influenced by both the size of prey types and size of predators (typically positively correlated), emphasizing resource partitioning both within species and across guilds (Scharf et al., 2000; Colloca et al., 2010). Body size hierarchically regulates relative prey vulnerability and capture success, and plays a dominant role in structuring food webs through resource partitioning (Scharf et al., 2000; Kerr & Dickie, 2001). The broader intra-species trophic niche breadth of piscivores (relative to other guilds) has been documented in other systems (Bulman et al., 2002) and can be attributed to the attainment of larger body sizes and foraging that is more gape-limited. Fishes can serve dramatically different functional roles through ontogeny in estuarine food webs, particularly piscivorous species that exploit a large range of prey sizes as they grow (Specziár & Rezsu, 2009). Some trophic guilds (e.g. BENT-a, ZOOP-a and PISC-b in this study) appear to be largely transitional for smaller individuals of a given species that are ultimately adapted to be crustacivores or piscivores, provided they manage to grow and survive (Garrison & Link, 2000).
Key estuarine prey groups
Mysida was the single most important prey group, establishing a critical node in the Chesapeake Bay food web as in other mid-latitude estuaries and marine environments (Mauchline, 1980; Jumars, 2007). Mysids are particularly dominant in diets of small juvenile fishes (c. 30–150 mm) in a variety of freshwater, estuarine and marine habitats (Mauchline, 1982; Baldo & Drake, 2002; Nunn et al., 2011), but the present work suggests that Mysida can continue to support fishes at substantially larger sizes >300 mm. Given the typically large biomass and relatively high production rates of Mysida, it is unlikely that demersal fish communities in estuaries exert significant top–down control (Hostens & Mees, 1999); instead, fishes may be regulated through bottom-up processes with respect to Mysida. The major mysid species consumed in this study, N. americana, is dominant throughout estuarine and coastal waters from Canada to Florida, U.S.A. (Wigley & Burns, 1971; Nemerson & Able, 2004). Some predators (e.g. C. regalis) can be highly selective of N. americana over alternative prey in the laboratory (Lankford & Targett, 1997), and fish growth and condition in the wild appear to be linked to mysid consumption (Grecay & Targett, 1996). Based on stable isotope data, the dietary contribution of Mysida to fish production may be even greater than estimated by stomach contents due to their rapid digestion (Buchheister & Latour, 2011), suggesting that the present diet estimates may be conservative. Due in part to sampling difficulties and insufficient data, Mysida are regularly under-represented in ecological research and in ecosystem models (Jumars, 2007), as is the case in Chesapeake Bay (Baird & Ulanowicz, 1989; Christensen et al., 2009). The present results suggest that future research efforts focused on mysids (particularly N. americana) are warranted given their important role in transferring energy to fishes in estuarine environments.
Bivalvia and Polychaeta are regularly identified as dominant prey groups for estuarine and marine fishes (Baldo & Drake, 2002; Reum & Essington, 2008; French et al., 2013). The relative specialization of some fishes on either of these two groups may be a common mechanism for partitioning macrobenthic resources. Both groups are ubiquitous, although bivalves are typically a larger proportion of infaunal benthic biomass (Diaz & Schaffner, 1990). Bivalve consumption is often limited by morphological adaptations, especially oral and pharyngeal dentition, as evidenced by the molariform or plate-like dentition found in many of the bivalve predators (P. cromis, A. probatocephalus, L. xanthurus and R. bonasus) (Chao & Musick, 1977; Grubich, 2003). Fishes that predominantly consume polychaetes and other benthos (BENT-a fish) tend to be less morphologically specialized than bivalve predators. This generalism in morphology and diet is facilitated by the diversity of polychaete feeding behaviours (carnivores, detritivores and planktivores) and lifestyles (from sessile tube builders to mobile predators) which offer a wider range of foraging options to predatory fishes (Diaz & Schaffner, 1990; Gillett & Schaffner, 2009). Thus, polychaetes can act as a general benthic prey, accessible to a wider array of predators of various sizes and morphologies (French et al., 2013).
Crustaceans can be the most taxonomically and trophically diverse group of benthic animals encountered in estuaries (Gillett & Schaffner, 2009), but the present study indicated that this diverse prey category was partly differentiated by the structuring gradients of size and habitat. As evidenced by previous work (Ellis & Musick, 2006; Latour et al., 2008), larger predator body sizes (e.g. elasmobranchs and larger teleosts) tended to be a prerequisite for consumption of the largest crustaceans (Squillidae and Portunidae). Consumption of smaller portunid crabs (i.e. Callinectes sapidus) by smaller predators, however, would be greater in the unsampled shallow creek and seagrass habitats where juvenile C. sapidus densities are higher (Heck & Thoman, 1984; Ralph et al., 2013). The role of prey and predator habitat affinities were particularly evident for the panopeid mud crabs and certain fishes (C. striata, O. tau, I. punctatus and A. catus) that favour structured or hard-bottom habitats (e.g. shell, cobble, hard reefs, sponges and hydroids). Other crustaceans, particularly Crangonidae, emphasized the importance of spatio-temporal overlap for trophic interactions. Crangonid consumption (by P. dentatus, C. regalis, U. regia, Prionotus, Menticirrhus and others) was seasonally opportunistic with peak consumption occurring in March and May when Crangon septemspinosa are aggregated and most abundant in the lower Chesapeake Bay before they move to shallower areas (Price, 1962; Haefner, 1976).
The two most important forage fishes in Chesapeake Bay, A. mitchilli and B. tyrannus, are also the bay's most abundant and most commercially harvested fishes, respectively (Houde & Zastrow, 1991; Able & Fahay, 2010). The critical role that these prey fishes play as forage for several commercially and recreationally important fishes (e.g. M. saxatilis, C. regalis, P. saltatrix and P. dentatus) is well documented (Hartman & Brandt, 1995; Walter & Austin, 2003; Latour et al., 2008). For example, up to 80% of seasonal A. mitchilli production in Chesapeake Bay is estimated to be consumed by the bay's piscivores (Baird & Ulanowicz, 1989). Some authors have highlighted, however, the potential for long-term shifts in predator–prey dynamics in the Bay (e.g. between B. tyrannus and M. saxatilis) resulting from fishery-induced changes in their respective populations (Griffin & Margraf, 2003; Hartman & Margraf, 2003; Pruell et al., 2003).
Dietary variability and extrapolation
Temporal or seasonal variability is a common consideration for studies of fish diets in dynamic environments (Reum & Essington, 2008). Interannual changes in diet composition (e.g. for Mysida and Bivalvia) have been documented for this data set and appear to be mediated by prey availability (Buchheister, 2013). The goal of this study, however, was to examine annually integrated, broad-scale diets, and the annual changes did not appear to alter trophic-guild classifications. The relatively negligible dietary effect observed for sampling month was surprising, but is supported by Baird & Ulanowicz (1989) who documented a consistent seasonal topology of the Chesapeake Bay food web based on network analysis. Other studies have also documented a relatively small or non-significant seasonal effect on dietary structure of fish assemblages (Reum & Essington, 2008; Colloca et al., 2010; Bundy et al., 2011; French et al., 2013). Seasonal shifts in diets caused by changing prey availability and species migrations can indeed occur (Hajisamae & Ibrahim, 2008; Latour et al., 2008); however, the magnitude of these changes within the broader assemblage was relatively weak compared with dietary differences among species and size classes. Species and body size appeared to be the two predominant factors influencing trophic dynamics; species identity regulates the unique combination of functional morphologies and foraging behaviours that each fish has evolved (Gerking, 1994; Reecht et al., 2013), while body size influences prey vulnerability, foraging success and predatory diet breadth (Scharf et al., 2000; Kerr & Dickie, 2001).
Habitat heterogeneity can influence prey availability, foraging success and realized diets of fishes (Orth et al., 1984; Nemerson & Able, 2004; Marancik & Hare, 2007), and the present sampling was confined to mainstem waters in bottom, trawlable habitat. The majority of the Chesapeake Bay mainstem can be classified as muddy or sandy bottom (Diaz & Schaffner, 1990); any structural diversity in the trawled habitats were largely determined by aggregations of invertebrate organisms (e.g. tunicates, hydrozoans, bryozoans, bivalves and Porifera). Despite low sample sizes for species associated with hard structures (e.g. C. faber, A. probatocephalus and T. onitis) and for pelagic fishes (e.g. P. saltatrix and alosines), captured specimens were representative for these species based on similarity to previous work (Murdy et al., 1997; Marancik & Hare, 2007; Able & Fahay, 2010). There was a lack of samples for some biomass-dominant pelagic fishes (particularly A. mitchilli and B. tyrannus) that are known to be planktivorous (Able & Fahay, 2010). Diets of some predators may differ when individuals reside in shallow, littoral regions where there is greater availability of certain prey species (e.g. Fundulus, Atherinidae, Crassostrea and juvenile Callinectes). At broader spatial scales, diets of ubiquitous species (e.g. M. undulatus and M. saxatilis) can vary with latitude and salinity in the mainstem (Buchheister, 2013), but such regional effects were less pronounced than the influence of species, body size and month and they did not alter trophic-guild classifications in preliminary analyses.
The predator diet estimates can provide ecological information beyond the sampled areas of Chesapeake Bay, but any extrapolation or application to other ecosystems, time periods or species should be made with appropriate caution. Results were influenced by the habitats, times (e.g. time of day and seasons) and predator sizes sampled, which affect prey availability and foraging outcomes. For example, dietary differences between conspecifics in estuaries and coastal waters can be quite notable with respect to consumption of cephalopods and other prey (Link et al., 2002; Marancik & Hare, 2007). Trophic-guild designations, however, are more robust as they are indicative of the general prey types, prey sizes and bentho-pelagic habitats that constrain each species' successful foraging. Extrapolation to other time periods should also be made cautiously; this study represents the current, decadal realization of a dynamic system that may differ from previous or future ecosystem states due to a variety of environmental and anthropogenic stressors (Hartman & Margraf, 2003; Kemp et al., 2005; Najjar et al., 2010). Lastly, the reliance on stomach contents and prey wet masses has the potential to misrepresent the true contributions of each prey type to predator growth and production due to differences in prey digestibility and energy density. Additional research relying on stable isotope analysis could provide a more time-integrated representation of prey importance, complementing the higher taxonomic resolution typically afforded by traditional stomach-content analysis (Fry, 2006).
Utility and application to EBFM
Making progress towards EBFM requires detailed knowledge of the trophic interactions in a system (Larkin, 1996; Link, 2010). Ecosystem models can be valuable tools for EBFM, used for quantifying ecosystem structure and function, assessing the direct and indirect effects of anthropogenic and environmental perturbations and evaluating the tradeoffs of different management strategies (Pauly et al., 2000; Sainsbury et al., 2000; Christensen & Walters, 2004). The present synthesis of diets and trophic-guild structure in Chesapeake Bay can help parameterize ecosystem models in Chesapeake Bay and other north-west Atlantic Ocean systems. For that purpose, data from this study are available in Table SI (Supporting Information) or through the customizable online data interface for the ChesMMAP trawl survey (www.vims.edu/fisheries/fishfood). Also, the trophic-guild results can aid the development of indicators of ecosystem status, such as trophic-guild biomasses or their ratios, which have proven to be responsive to changes in ecosystem status and fishing pressure (de Leiva Moreno et al., 2000; Cury et al., 2005; Methratta & Link, 2006). Such indicators can operate within a suite of metrics to help establish ecosystem reference points, control rules or decision criteria to inform management actions (Link, 2005; Rice & Rochet, 2005). More generally, this work contributes to the collective understanding of the structure, function and ecological gradients of estuarine food webs, which is fundamental to more holistic ecosystem approaches to fisheries management.
Acknowledgements
Our sincere gratitude is expressed to all ChesMMAP staff (especially C. F. Bonzek and J. Gartland) and the crew of the R.V. Bay Eagle for their excellent and diligent work on the trawl survey. ChesMMAP was funded by the NOAA Chesapeake Bay Office, the Virginia Environmental Endowment, the U.S. Fish and Wildlife Service and the Virginia Marine Resources Commission. Research support was provided by Virginia Sea Grant, the National Science Foundation (award number OCE-1041713), a VIMS Council fellowship and an International Women's Fishing Association scholarship. P. D. Lynch and K. Sobocinski helped through several discussions of the work. J. E. Duffy, J. S. Link, T. S. Miller, T. T. Sutton and two anonymous reviewers provided constructive comments on earlier drafts of this manuscript. This paper is contribution number 3420 of the Virginia Institute of Marine Science, College of William & Mary.