High-frequency ultrasound accuracy in preoperative cutaneous melanoma assessment: A meta-analysis
Georgina Sellyn and Andrea Lopez should be considered co-first authors.
Linked article: K. Eisendle et al. J Eur Acad Dermatol Venereol 2025;39:13–14. https://doi.org/10.1111/jdv.20424.
Abstract
Background
High-frequency ultrasound (HFUS) can safely and efficiently visualize cutaneous tumour characteristics including depth.
Objectives
We aimed to evaluate its accuracy in measuring melanoma depth against the gold standard, histopathology, for treatment planning.
Methods
A review of publications was conducted in March 2023 through five electronic databases. Thirty-six included articles studied patients who received HFUS (≥10 MHz) measurements, melanoma biopsy or excision, and reported a tumour depth correlation coefficient between HFUS and histopathology. We analysed correlation coefficients between HFUS and histopathology, measured tumour depths and shed light on reasons for mismeasurements. Additionally, we identified the reporting of critical metrics including, lesion characteristics, melanoma subtype, type of correlation coefficient, 95% confidence intervals for Pearson coefficients and sample size.
Results
The most common tumour imaged was superficial spreading melanoma on the trunk and extremities, followed by head/face. Maximum ultrasound frequencies ranged from 13 MHz to 100 MHz with participants ranging from 5 to 264. Histopathology and HFUS correlation coefficients ranged from 0.417 to 0.997 (median: 0.94, mean: 0.89 and SD: 0.13). Lower frequency probes (10–20 MHz) were less accurate in assessing melanoma thickness, with a cumulative mean correlation coefficient of 0.87 compared to 0.94 (20–25 MHz) and 0.98 (≥70 MHz). Studies demonstrated higher sonographic accuracy in melanomas >0.75 mm.
Additionally, ultrasound may report increased melanoma depth compared to histopathology for reasons including lymphocytic infiltration, presence of a nevus and shrinkage during specimen processing. Furthermore, we found a gap in the reporting of details such as fundamental characteristics of lesion populations. Specifically, 86% (31 out of 36) of the studies failed to report one or more critical metrics, such as mean, median or range of lesion depths.
Conclusions
HFUS may serve as a supplementary tool for preoperative melanoma assessment, with increased accuracy in thicker tumours. Frequencies <20 MHz are less reliable in assessing depth. Frequencies ≥70 MHz demonstrate stronger correlations to histopathology. Higher ultrasound accuracy was seen for melanomas with Breslow depth >0.75 mm.
INTRODUCTION
The prevalence of cutaneous melanoma has steadily risen over the last few decades, with expectations of increased melanoma global burden in the near future.1 Factors such as Breslow depth, mitotic rate and presence of tumour ulceration significantly influence patient survival.2 This information is critical to appropriately stage melanomas and understand the likelihood of lymph node involvement as well as risk of distant metastasis, thus, informing appropriate treatment plans.
Mohs micrographic surgery and staged surgical excisions serve as primary methods for melanoma resection, facilitating meticulous histologic assessment and visualization of peripheral margins.3 Accurate preoperative evaluation is essential to determine appropriate surgical planning and ensure successful melanoma removal. In the preoperative phase, skin cancer biopsies aid in melanoma diagnosis, but may not represent the full extent of a tumour, introducing sampling bias. Therefore, non-invasive preoperative measurement tools can assist in determining the maximum depth of a melanoma, and may prove invaluable in guiding surgical decisions, selecting appropriate margins and setting patient expectations, particularly when the lesion is larger, multifocal or heterogenous.
With advancements in technology, non-invasive diagnostic tools such as, reflectance confocal microscopy (RCM), optical coherence tomography (OCT) and high-frequency ultrasound (HFUS), are becoming more prominent within the field of dermatology. Jung et al. demonstrated that RCM, OCT and HFUS can help assess skin tumour margins and response to treatment.4 However, Schuetzenberger et al. reported that HFUS has increased depth penetration to enable visualization of deeper structures, potentially exposing sites that could harbour portions of melanoma.5
High-frequency ultrasound offers real-time visualization of tumour depth and characteristics, without additional harmful patient exposures, thus, making it a valuable tool in melanoma assessment, though time delay may be added to surgical planning.5 Studies have explored various sonographic frequencies, ranging from below 15 MHz to over 70 MHz, to investigate the efficacy of HFUS in preoperative melanoma assessment. This review aims to analyse studies that have investigated the correlation coefficient between tumour depth measured by HFUS and histopathology, shedding light on factors that may contribute to mismeasurements. Understanding the accuracy and limitations of HFUS in measuring tumour depth will aid clinicians in making informed decisions regarding treatment planning and surgical interventions. Results from this systematic review contribute to ongoing efforts to optimize the use of HFUS in clinical practice, enriching the management of melanomas and ultimately improving patient outcomes.
MATERIALS AND METHODS
Literature search
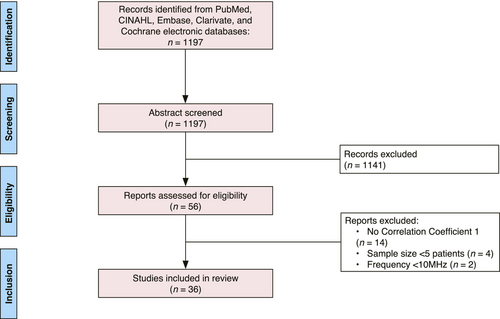
A search of English-language publications through the PubMed, CINAHL, Embase, Clarivate and Cochrane electronic databases was conducted in March 2023 according to Preferred Reporting Items for Systematic Reviews and Meta-Analyses (PRISMA) criteria, reflected in Figure 1.6, 7 Our search syntax included, “melanoma”, “ultrasonography”, “skin neoplasm” and “HFUS”. The initial literature search yielded 1197 articles. After eliminating studies that did not meet inclusion criteria by abstract review, 56 studies were identified for full-text review, of which 36 met inclusion criteria. Full-text review and data extraction were performed by the primary authors (G.S. and A.L). This study was registered with PROSPERO, the international prospective register of systematic reviews (https://www.crd.york.ac.uk/prospero/).
Inclusion and exclusion criteria
We included all patients who received a HFUS measurement and biopsy or excision of a melanoma. Four exclusionary criteria were applied: (1) the ultrasound frequency in the study was not high (10 MHz or greater); (2) the study did not provide a correlation coefficient for depth of tumour assessment between HFUS and histopathology; (3) there were fewer than five patients in the study; (4) the type of publication was an opinion paper, technical report or review. Included studies are listed in Table 1.
| Study | HFUS maximum frequency (MHz) | Patient # (M/F, if provided) | Mean age in years (range) | Location of lesions (N, if reported) | Total melanomas; histologic subtypes | Sonographic tumour depth (mm) | Histological tumour depth (mm) | Correlation | Correlation coefficient |
|---|---|---|---|---|---|---|---|---|---|
| Hoffman et al. 1999, Germany34 | 20 | 264 | – | – | 264 MM | – | – | – | 0.97 |
| Serrone et al. 2001, Italy20 | 20 | 261 (119M, 142F) | 51 (14–85) | Trunk (140), head and neck (17), extremities (104) | 193 MM: 145 SSM, 15 NM, 1 LMM, 1 ALM | Range: ≤0.75–4.00 mm | Range: 0.20–11.00 mm; mean: 0.80 mm | Pearson | 0.95 |
| Tacke et al. 1995, Germany32 | 20 | 259 (127M, 132F) | 53 (17–86) | – | 259 MM: 202 SSM, 32 NM, 7 LMM, 5 ALM, 10 MIS, 3 unclassified | – | – | 0.88 | |
| Ulrich et al. 1999, Germany35 | 20 | 249 | – | – | – | – | – | – |
20 MHz: 0.94 7.5 MHz: 0.76 |
| Meyer et al. 2014, France25 | 25 | 131 (37M, 63F) | Median; 57 (39–70) | Head and neck (17 tumours), trunk (55), extremities (28 tumours) | 67 MM | – | Range: 0.20–0.90 mm; median: 0.50 mm | Spearman | 0.81 |
| Linkeviciute et al. 2017, Lithuania36 | 22 | 127 | 47 | Trunk (82), upper extremity (27), lower extremity (33), Face (3) | 54 MM: 29 SSM, 1 NM, 5 LM, 19 unclassified | Manual median: 0.96 mm; automated median: 0.98 mm | Median: 0.97 mm | Spearman | 0.86 |
| Bessoud et al. 2002, France37 | 20 | 111 (47M, 64F) | 55 | – | – | Range: 0.20–10.00 mm | Range: 0.25–8.00 mm | Pearson | 0.96 |
| Lassau et al. 2006, France38 | 13 | 111 (49M, 62F) | 64 (27–97) | Back | 107 MM | Range: 0.15–8.00 mm | Range: 0.15–8 mm | Pearson | 0.93 |
| Guitera et al. 2008, Australia21 | 75 | 109 | – | – | 45 MM | – | Median: 0.40 mm | Pearson | 0.91 |
| Kaikaris et al. 2011, Lithuania18 | 14 | 100 (33M, 67F) |
Female: 60 Male: 58 |
Head and neck, trunk (37), upper extremities, lower extremities | 100 MM | – | – | Pearson |
1–2 mm: 0.28 >2 mm: 0.87 |
| Chaput et al. 2018, France24 | 20 | 90 (35M, 55F) | 45–68 | – | 97 MM: 42 SSM, 33 LM, 3 NM, 13 ALM, 6 unclassified | – | – | Spearman | 0.88 |
| Pellacani et al. 2003, Italy10 | 20 | 88 | – | – | 60 MM | Mean: 1.26 mm | Total mean: 1.14 mm; ≤1 mm mean: 0.41 mm; >1 mm mean: 2.69 mm | Pearson | 0.89 |
| Krahn et al. 1998, Germany29 | 20 | 80 | – | – | 39 MM | – | Range: 0.18–1.90 mm | – | 0.95 |
| Solivetti et al. 1998, Italy39 | 20 | 78 | – | – | 66 MM | – | – | Pearson | 0.93 |
| Hayashi et al. 2009, Japan40 | 30 | 74 | – | Soles (26) | 68 MM |
≤1 mm (15 tumours), 1.01–2 mm (18 tumours) 2.01–4 mm (16 tumours) >4 mm (19 tumours) |
≤1.00 mm (15 tumours) 1.01–2.00 mm (16 tumours) 2.01 mm–4.00 mm (19 tumours) >4.00 mm (18 tumours) |
– |
All: 0.89 26 on the sole of foot: 0.95 |
| Gassenmaier et al. 1990 41 | 20 | 72 | – | – | 72 MM | Range: <0.76– >1.50 mm | Range: <0.76–>1.50 mm | – | 0.97 |
| Kucinskiene et al. 2014, Lithuania13 | 14 | 72 (26M, 46F) | – | Head and face (2), trunk (4), upper extremities (2), lower extremities (4) | 12 MM | ≤1 mm mean: 0.70 mm; >1 mm mean: 2.13 mm; Total mean: 1.19 mm | ≤1 mm mean: 1.14 mm; >1 mm mean: 3.06 mm; Total mean: 1.81 mm | Spearman |
≤1.00 mm: 0.42 >1.00 mm: 0.78 All: 0.56 |
| Partsch et al. 1996, Austria42 | 20 | 71 (34M, 37F) | 53 (21–89) | – | 58 MM: 39 SSM, 12 NM, 5 LM, 2 unclassified | Range: 0.71–1.74 mm; Median: 1.36 mm | Range: 0.65–1.50 mm; Median: 0.89 mm | Pearson | 0.92 |
| Lassau et al. 1997, France43 | 20 | 70 | – | – | 19MM | Range: 0.26–6.20 mm | Range: 0.25–6.00 mm | – | 0.99 |
| Music et al. 2010, Slovenia14 | 15 | 69 (44M, 25F) | 60 |
Trunk (37), Extremities (28) Head (5) |
56 MM | Range: 0–7.60 mm; Mean: 1.80 mm | Range:0–9.00 mm; Mean: 1.97 mm | Pearson | 0.82 |
| Lassau et al. 2002, France44 | 20 | 67 (38M, 29F) | 58 (22–85) | – | 65 MM | Range: 0.26–8.00 mm | Range: 0.15–8.00 mm | Pearson | 0.96 |
| Hoffmann et al. 1992, Germany45 | 20 | 54 (23M, 31F) | Median: 59.5 (34–85) | – | 52 MM: 37 SSM, 5 NM, 5 LMM, 3 ALM, 2 unclassified | – | Mean: 1.47 | – | 0.98 |
| Vilana et al. 2009, Spain12 | 10 | 54 (26M, 28F) | 48 (21–79) |
Head and neck (4) Trunk (28), Extremities (22) |
54 MM | Range: 0–4.80 mm; Median: 1.85 mm | Median: 1.33 mm | Pearson | 0.93 |
| Andrekute et al. 2016, Lithuania28 | 22 | 52 (16M, 36F) | – | Trunk, upper extremities, lower extremities | 6 MM,a 45 MN | Manual mean: 0.57 mm, automatic mean: 0.46 mm | Mean: 0.74 mm | Spearman |
Manual: 0.64 Automatic: 0.83 |
| Kozarova et al. 2018, Slovakia17 | 20 | 50 (19M, 31F) | 55 | Arm, Back (2) | 50 MM: 45 SSM, 5 NM | – | Range: 0.40–5.30 mm | Spearman |
All: 0.92 ≤1.00 mm: 0.58 1.01–2.00 mm: 0.74 >2.00 mm: 0.86 |
| Crisan et al. 2013, Romania31 | 20 | 46 (20M, 26F) |
Female: 42 Male: 52 |
Trunk, lower extremities | 28 MM: 8 SSM, 20 NM |
SSM: 0.92 mm NM: 1.72 mm |
SSM: mean 0.70 mm; NM: mean 1.91 mm | Pearson |
All: 0.99 SSM: 0.99 NM: 0.98 |
| Botar-Jid et al. 2016, Romania16 | 40 | 39 patients, (18M, 21F) | 57 | Lower extremity, thoracic, face | 37 MM | Mean: 2.53 mm | Mean: 2.78 mm | Pearson | 0.96 |
| Gambichler et al. 2007, Germany11 | 100 | 37 (17M, 20F) | 53 | – | 13 MM: 11 SSM, 2 LM | 20 MHz mean: 0.38 mm; 100 MHz mean: 0.37 mm | Mean: 0.34 mm | Pearson |
20 MHz: 0.99 100 MHz: 0.99 |
| Oranges et al. 2022, Italy23 | 70 | 27 (14M, 13F) | 58 | Back (15), legs (5), gluteal (2), trunk (4), plantar area of foot (1) | 27 MM: 23 SSM, 3 NM, 1 ALM | Maximum depth: 4.56 mm | Maximum depth: 5.00 mm | Pearson | 0.98 |
| Lassau et al. 1999, France26 | 20 | 27 | – | – | 27 MM | Range: 0.3–8.00 mm | Range: 0.26–8.00 mm | Pearson | 0.95 |
| Shafir et al. 1984, Israel9 | 10 | 26 | – | – | 15 MM: SSM 1, NM 1 | Mean: 2.03 mm | Frozen: 1.92 mm; paraffin: 1.71 mm | – |
Paraffin: 0.96 Frozen: 0.96 |
| Pilat et al. 2020, Poland 46 | 50 | 19 (6M, 13F) | 57 | – | 19 MM: 4 NM, 8 SSM, 6 LM, 1 unclassified | Mean: 0.74 mm | Mean: 0.56 mm | – |
20 MHz: 0.76 50 MHz: 0.73 |
| Borroni et al. 199215 | 20 | 10 (5M, 5F) | 58.4 (18–87) | Back (3), lower extremity (3), upper extremity (1), face (2), trunk (1) | 10 MM: 1 NM | Mean: 4.09 mm | 4.40 mm | Pearson | 0.97 |
| Janowksa et al. 2021, Italy22 | 70 | 10 (4M, 6F) | 51 | Back (5), lower extremity (2), anterior trunk (2), upper extremity (1) | 10 MM | Range: <0.25–>2.00 mm | Range: 0.40–1.30 mm | Pearson | 0.99 |
| Hinz et al. 2011, Germany47 | 20 | 5 (3M, 2F) | 66 (57–79) | Head (1), extremities (4) | 5 MM: 2 other, 2 LMM, 1 SSM | Range: 0.23–1.10 mm; median: 0.44 mm | Range: 0.06–1.50 mm; median: 0.25 mm | Spearman | 0.39 |
| Rompel et al. 1997, Germanyb,19 | 20 | – | – | – | 155 MM | Range: <0.75–>1.50 mm | Range: <0.75–>1.50 mm | Spearman |
All: 0.89 0.76 mm–1.50 mm: 0.70 >1.50 mm: 0.86 <0.75 mm: 0.46 |
- Abbreviations: MM, malignant melanoma; NM, nodular melanoma; LM, lentigo maligna; LMM, lentigo malignant melanoma; ALM, acral lentiginous melanoma; melanocytic nevi; SMM, superficial spreading melanoma.
- a Andrekute et al.27 included 52 patients in their study, of which 6 had malignant melanomas and the remaining 46 subjects had melanocytic nevi. All lesions were included in the correlation coefficient analysis.
- b Sample size was not provided, however, 115 MM lesions were included in the analysis.
Statistical analysis
While all included studies reported a correlation coefficient between histopathology and HFUS for tumour depth measurements, not all studies recorded a 95% confidence interval (CI).8 Author (S.G.) calculated the 95% CIs from the reported correlations and sample size using the ‘psychometric’ package in R which provides a bias-corrected and accelerated bootstrap method for constructing CIs. Author (H.C.) conducted meta-analyses for the different sonographic frequency groups by estimating fixed and random effects along with correlations and 95% CIs estimated from fixed and random effect models using the ‘meta’ package in R.
RESULTS
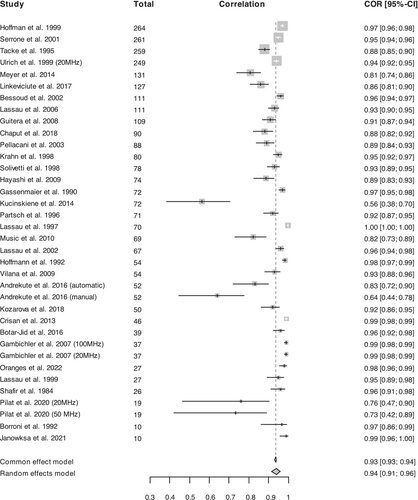
Of the 36 articles included in this systematic review (Table 1), maximum ultrasound frequencies across studies ranged from 13 MHz to 100 MHz (median: 20 MHz and mean 26 MHz). Study populations ranged from 5 to 264. The total lesion count included in the meta-analysis was 2181 and the majority of reported melanoma locations occurring on the trunk (427 lesions), extremities (271 lesions) and head and face (35 lesions). Of the studies that specified melanoma subtype, superficial spreading melanoma (SSM) was the most common (n = 591), followed by nodular melanomas (NM; n = 102), lentigo malignas (LM; n = 51) and lentigo malignant melanomas (LMM; n = 15). Sixty-eight tumours were unclassified. Correlation coefficients between HFUS and histopathology ranged from 0.417 to 0.997 (median: 0.94, mean: 0.89 and SD: 0.13; Figure 2).
Several studies reported that ultrasound frequencies at or below 20 MHz tend to report larger melanoma depths for various reasons including lymphocytic infiltration.9-11 Shafir et al. used 10 MHz HFUS and found the mean melanoma thickness (n = 15) to be 2.03 mm compared to 1.92 mm and 1.71 mm in frozen and paraffin histological sections, respectively.9 Vilana et al. also utilized 10 MHz sonography to assess 54 malignant melanoma (MM) and found a larger melanoma depth (median 1.85 mm) in comparison with histopathology (1.33 mm).12 In addition, Pellacani et al. used the most commonly studied frequency, 20 MHz, and also showed increased HFUS depth across 60 MM, with a mean tumour depth of 1.26 mm compared to 1.14 mm with histopathology.10 Finally, Gambichler et al. reported a mean tumour thickness of 0.38 mm with 20 MHz, which was a larger melanoma depth when compared to the mean of 0.339 mm determined with histopathology.11 Notably, in the same study, 100 MHz also reported an increased depth measurement compared to histopathology (0.365 mm vs. 0.339 mm), but there was a smaller absolute difference compared to results with the 20 MHz probe.11
Nevertheless, other studies demonstrate sonographic underestimation of tumour depth when compared to histopathology. In studies testing probes less than 20 MHz, Kucinskiene et al. found a mean tumour thickness of 1.19 mm versus 1.81 mm from histopathology with a 14 MHz probe.13 Similarly, using 15 MHz to assess 56 lesions, Music et al. also reported a mean tumour measurement value lower than that from histopathology (1.8 mm vs. 1.97 mm, respectively).14 This underestimation is also present in some studies using 20 MHz or higher. Borroni et al. demonstrated a mean melanoma tumour thicknesses of 4.09 mm (n = 10) with 20 MHz compared to 4.4 mm with histopathology.15 In addition, 40 MHz also underestimated tumour depths compared to histopathology (2.53 mm vs. 2.78 mm).16
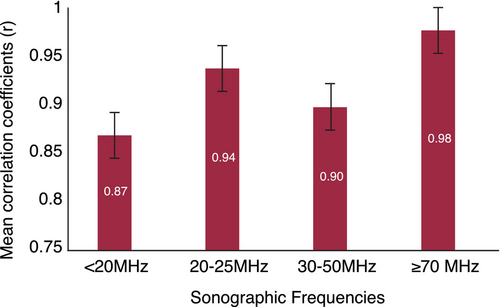
Overall, lower frequency probes (10–20 MHz) were less accurate in assessing tumour thickness, with a cumulative mean correlation coefficient of 0.87 compared to 0.94 (20–25 MHz) and 0.98 (≥70 MHz) (Figure 3). Shafir et al.9 discontinued the use of 5 MHz and 7 MHz ultrasounds in their study as they could only accurately assess lesions >2 mm. In addition with a 10 MHz ultrasound, Viliana et al. reported 9 out of 50 melanomas (18%) were not visible on sonography due to their thin nature and lack of infiltration of the dermis.12
When tumours (n = 50) were stratified by thickness, with a 20 MHz probe Kozarova et al. demonstrated increased correlations between sonography and histopathology for thicker melanoma in comparison to thinner tumours (≤1.0 mm, r = 0.581; 1.01–2 mm, r = 0.736; >2.00 mm, r = 0.857).17 Results from Kucinskiene et al. and Kaikaris et al. also supported these findings with a 14-MHz probe (≤1 mm, r = 0.417; >1 mm, r = 0.783) and (1–2 mm, r = 0.283; >2 mm, r = 0.869), respectively.13, 18 In addition, with a 20-MHz probe assessing 155 MM, Rompel et al. found stronger correlations with thicker melanomas (<0.75 mm, r = 0.46; 0.76–1.50 mm, r = 0.70; >1.50 mm, r = 0.86).19 Serrone et al. also found a high correlation between 20 MHz HFUS and histopathology of 193 malignant melanomas in the preoperative stage, with the highest correlation in melanomas ≥1.51 mm thick and the lowest correlation in melanoma ≤0.75 mm.20 These studies demonstrate a high accuracy of preoperative staging and defining surgical margins of malignant melanomas that are at least >0.75 mm with accuracy limitations in thinner melanomas.
The mean correlation coefficient of frequencies greater than 70 MHz is 0.98 compared to a mean of 0.94 for 20–25 MHz. Guitera et al. reported 75 MHz probes to be very reliable for measuring melanoma thickness (n = 45) even with the presence of lymphocytic infiltration or nevus, with a low-percentage error of 13%.21 In addition, Oranges and Janowksa et al. both utilized 70 MHz in their studies and found high correlations of 0.98 and 0.99, respectively.22, 23
DISCUSSION
The recent literature base provides evidence that ultrasound and HFUS are useful in various aspects of dermatology, including inflammatory skin diseases, vascular lesions and cosmetic procedures.24 In this review, HFUS, particularly, ≥70 MHz can also accurately measure melanoma depth, provide clarity on peripheral tumour extension and prepare surgeons for safe resection. Additionally, this study confirms that HFUS may be most beneficial for thicker melanomas greater than 0.75–1 mm. Of note, the correlation coefficient was slightly lower for 30–50 MHz than the 25–30 MHz but not in a statistically significant fashion. This study did not assess ultrasound evaluation of lymph nodes.
While many studies demonstrate high correlation coefficients between HFUS and histopathology, there are also reports of sonographic overestimation and underestimation. If the precision of tumour assessment is overestimated, this can lead to unnecessary resection of additional margins, possibly leading to increasingly difficult closures and risk of cosmetic disfigurement. Increased sonographic measurements have been linked to factors such as lymphocytic invasion, the presence of a nevus and potential shrinkage during pathology specimen processing.10, 11, 18, 25, 26 Fresh and histological tissue has been reported to shrink by a mean of 11.4% with processing, making it an important factor to consider when HFUS measurements are larger than histopathology results.27 Conversely, underestimated margins can jeopardize complete resection, potentially hazarding tumour recurrence or the need for additional surgeries. It has been proposed that tumour compression from manual ultrasound assessment may be a factor contributing to underestimated depths.25, 28
Tumour assessment accuracy in terms of depth and lateral margins is beneficial for preoperative planning but may also have an indication in reducing fewer surgical re-excisions.29 Determining tumour depth in vivo has been reported to simplify surgical resection and enable single step excision.30 Of 78 melanomas resected in a single step with 20 MHz HFUS informing preoperative surgical margins, 71 did not require wide local re-excision.29 In addition, Lassau et al. reported that in melanoma with a Breslow index greater than 1 mm (n = 11), surgical re-excision was necessary but could have been avoided if surgery had been planned on the basis of HFUS measurements.31
While lentigo malignant melanoma (LMM) and lentigo maligna (LM) were not highly prevalent across the studies in this review, they hold significant importance for Mohs micrographic surgeons where determining not just depth but tumour margins laterally can prove challenging. Across the studies in this review, 15 LMMs and 51 LM were described; however, few articles presented correlation coefficients stratified by tumour type. In the 33 LM included by Chaput et al., an absolute difference of 0.44 mm was found between HFUS (20 MHz) and histopathology, with an increased difference of 0.63 mm for acral lentigo maligna (ALM) and pathology.29 Therefore, conducting more targeted analyses of LMM and LM using HFUS is essential to comprehend its significance within these specific tumour subtypes, though, based on our results, the lower Breslow depth problems of inaccurate measurements with lower frequency ultrasound devices might require sonographic devices greater than 20 MHz. In addition, Tacke et al. reported that in situ melanomas can experience ultrasound-based overestimation due to the presence of numerous melanophages and sebaceous glands beneath the tumour.32 This finding aligns with other results suggesting that thinner tumours are less precisely measured using HFUS in comparison with thicker tumours.
As technology continues to advance within the field of dermatology and cutaneous oncology, tools such as HFUS are emerging as valuable complements to the established gold standard of histopathology. The use of sonographic data can be particularly beneficial in addressing the clinical challenge of accurately assessing the complete extent of melanoma prior to excision, particularly when visible tumour has been distorted following biopsy. Additionally, when a biopsy confirms the presence of melanoma without demonstrating clear margins, there may be sampling bias and skip lesions may be present. HFUS could provide supplementary information for preoperative planning, contributing to safer resection procedures, facilitating comprehensive preoperative discussions with patients and decreasing risk of residual tumour and re-excision.
However, practically speaking, it is worth acknowledging that HFUS might not be universally accessible for all physicians and clinics. Anecdotally, there is comparable pricing across various ultrasound frequencies, however, costs are not publicly available. Additionally, most companies that manufacture and sell HFUS machines have more availability of the 22–38 MHz frequency range. Frequencies exceeding 70 MHz, despite demonstrating higher correlation and accuracy with histopathology, are often less readily available. These results may encourage increased accessibility of higher frequency ultrasounds as the preferred sonographic frequency within the context of cutaneous cancer management. Also, the time required for ultrasound may be less attractive to physicians with straightforward cases. Consequently, it is essential to acknowledge other non-invasive techniques for assessing tumour thickness, particularly in cases where HFUS may not be ideal, such as for thinner lesions. One example includes the combination of both confocal microscopy and OCT, in what is called line-field variant of confocal optical coherence tomography (LC-OCT). As discussed by Jacobsen et al. (2024), LC-OCT provides high-resolution imaging with an optical resolution of approximately 1 μm, enabling detailed visualization of cellular and structural skin components akin to histopathology. The LC-OCT glossary proposed by Jacobsen et al. outlines key image markers for various skin lesions, including actinic keratosis, squamous cell carcinoma in situ, squamous cell carcinoma, basal cell carcinoma, and melanoma, thereby offering a comprehensive framework for lesion characterization.33
As for standard OCT, Varkentin et al. contrasted the Breslow lesion thickness acquired from histopathology with that from OCT. Their findings revealed that OCT exhibits a slightly enhanced precision in determining thickness, whereas HFUS offers superior contrast.34 The findings of this study suggests that non-invasive OCT and HFUS are able to determine the infiltration depth of lesions like melanocytic nevi or melanomas preoperatively and in vivo with a precision comparable to invasive histopathology measurements on skin biopsies.34
One of the primary findings from our analysis revealed a lack of crucial information within a substantial majority of the >70 MHz HFUS studies reviewed. Specifically, less than half (14 out of 36) of these studies provide key details about the fundamental characteristics of the lesion population under investigation, failing to report metrics including interquartile range, mean and standard deviation of lesion depths. Furthermore, many studies do not offer a comprehensive breakdown of correlation coefficients stratified by lesion depth. In light of these limitations, future HFUS research should prioritize the inclusion of comprehensive data on patient cohorts, lesion characteristics and accuracy metrics at various depths to enhance the overall quality and reliability of HFUS studies.
While this study demonstrates a potential place for HFUS within the preoperative management of melanoma, it is not intended to replace the gold standard for histopathology. Instead, HFUS can enrich clinical information and decision making through immediate and safe tumour assessment including tumour depth and lateral extension. Timing and cost may be limitations to incorporating this into standard clinical practice. There was inconsistent data across studies regarding patient demographics, tumour subtypes, tumour locations and correlation coefficients stratified by Breslow depth limiting our results. Correlation coefficients are sensitive to sample size, range (with broader ranges giving artificially high coefficients and homogeneous sample artificially low) and even the ordering of the analysed data.35 Therefore, studies that include wide ranges of tumour depths or do not report tumour depth range risk inaccurate correlation coefficients.
A limitation is that most studies included in this review do not report a limits of agreement analysis recommended by Bland and Altman. As Bland and Altman underscored in their classic 1986 Lancet paper (now with over 50,000 citations), the correlation procedures that studies report have a significant weakness in comparing two clinical measurements.36 Although correlation coefficients indicate the strength of the relationship between variables, they do not assess agreement, and are largely a reflection of the sample size. Consequently, a high correlation may persist despite substantial bias between methods, failing to capture the true magnitude of measurement differences essential for precise tumour thickness determination.
CONCLUSIONS
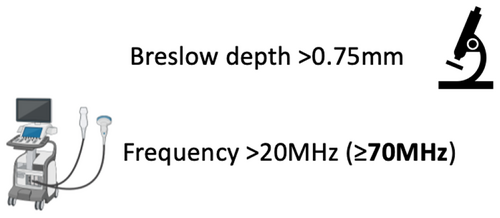
High-frequency ultrasound is a valuable tool to supplement preoperative assessment of cutaneous melanomas, with increased accuracy in thicker tumours. Sonographic frequencies lower than 20 MHz are less reliable in assessing tumour depth, and frequencies greater than 70 MHz tend to have higher correlations with histopathology, particularly when the Breslow depth >0.75 mm (Figure 4). Additional studies are needed to assess how high-frequency ultrasound may be complement melanoma management and how to overcome practical barriers to use.
AUTHOR CONTRIBUTIONS
Concept and design: Powers, Sellyn and Tkaczyk. Acquisition, analysis or interpretation of data: Sellyn, Lopez, Chen, Ghosh and Tkaczyk. Drafting manuscript and critical revision: Sellyn, Lopez, Ghosh, Chen, Topf, Tkaczyk and Powers. Statistical analysis: Chen, Ghosh and Tkaczyk. Final approval of the version to be published: Sellyn, Lopez, Gosh, Chen, Powers, Tkaczyk and Topf.
FUNDING INFORMATION
This work was supported by a Career Development Award to Eric Tkaczyk from the United States Department of Veterans Affairs Clinical Sciences R&D Service (IK2 CX001785) and VA MERIT I01 CX002721. Heather E. Laferriere, MLIS, Health Sciences Informationist, Vanderbilt University Medical University.
CONFLICT OF INTEREST STATEMENT
The authors declare no conflict of interest.
Open Research
DATA AVAILABILITY STATEMENT
The data that support the findings of this study are available from the corresponding author upon reasonable request.


