Method for the estimation of genetic merit of animals with uncertain paternity under Bayesian inference
Summary
The use of controlled mating or artificial insemination is impracticable in the case of large herds, mainly because of labour costs and the need to delimit areas during the breeding period. However, the exclusion of information from animals with uncertain paternity reduces genetic progress. The objectives of this study were as follows: (i) propose an iterative empirical Bayesian procedure to implement the hierarchical animal model (ITER); (ii) calculate the posterior probabilities of paternity by the maximum likelihood method following the concepts; (iii) compare an average numerator relationship matrix (ANRM), Bayesian hierarchical (HIER) models and ITER. Records of Nellore animals born between 1984 and 2006 from the zootechnical archive of Agropecuária Jacarezinho Ltda were used. For data consistency, records of contemporary groups (CGs) with fewer than three animals and animals whose records were 3.5 standard deviations above or below the mean of their CG were eliminated. After editing the data, 62,212 animals in the file and 12,876 animals in pedigree file were maintained, respectively. Spearman and Pearson correlations between the posterior mean of the genetic effects of animals were calculated to compare the ranking of animals for selection. Simulated data were used to confirm the veracity of the model. The correlations between ITER and HIER and between ITER and ANRM were similar evaluating different files, which decreased at the same proportion when only high-ranked animals were evaluated. In conclusion, the model proposed herein is a suitable computational alternative to improve the prediction of breeding values of animals in genetic evaluations using large databases, including animals with uncertain paternity.
1 INTRODUCTION
Multiple-sire mating is a type of reproductive management that exposes a group of cows to several bulls during the same breeding season. This type of mating is used to improve conception rates, but impairs comparisons of reproductive and productive characteristics between sires. The lack of correct identification of paternity is one of the consequences of multiple-sire mating, which can negatively affect the accuracy of genetic evaluations, and hence the genetic progress due to selection.
Many developed countries such as the United States and some countries of the European Union are currently using DNA testing as an accurate alternative for paternity identification (McClure, Sonstegard, Wiggans, & Van Tassell, 2012). However, such technique is not yet financially accessible in developing countries, because of the extensive production and large commercial herds or used in most of these countries.
Some statistical models have been developed to infer on uncertain paternity, such as the use of genetic groups (Westell, Quaas, & Van Vleck, 1988), average numerator relationship matrix (ANRM) (Henderson, 1988) and Bayesian hierarchical (HIER) models. The last method combines prior information and performance data to calculate the posterior probability of the candidate sire to be the true sire to improve the prediction of the genetic merit of animals originating from multiple-sire matings (Cardoso & Tempelman, 2003). The HIER model has been favoured in the literature over the ANRM model to predict the breeding value of animals with uncertain paternity (Cardoso & Tempelman, 2003, 2004; Shiotsuki, Cardoso, Silva, Rosa, & Albuquerque, 2012). On the other hand, the lengthy computational time of the method, which is based on Markov chain Monte Carlo (MCMC) simulations, makes it inappropriate for routine use in genetic evaluations using large databases.
Cardoso and Tempelman (2003) found that the HIER and ANRM methods require almost the same computational time when implemented via MCMC. However, the model choice criteria confirmed that the HIER model better predicts the genetic merit of animals with unknown paternity. Therefore, the objectives of this study were as follows: (i) to propose an iterative empirical Bayesian procedure to implement the hierarchical animal model proposed by Cardoso and Tempelman (2003); (ii) to calculate the posterior probabilities of paternity by the maximum likelihood method following the concepts proposed by Foulley, Gianola, and Planchenault (1987) and; (iii) to compare ANRM model (Henderson, 1988), HIER models (Cardoso & Tempelman, 2003) and Bayesian hierarchical implemented using Bayesian modelling by the MCMC method and to predict the genetic merit of animals with uncertain paternity (ITER).
2 MATERIALS AND METHODS
2.1 Field data
Records of Nellore animals born between 1984 and 2006 from the zootechnical archive of Agropecuária Jacarezinho Ltda, municipality of Valparaíso, São Paulo, Brazil, were used. Postweaning weight gain (PWG) between 205 and 550 days of age was the trait considered in this study. The mean and standard deviation of this trait were 98.4 and 33.33 kg, respectively.
For data consistency, records of contemporary groups (CGs) with fewer than three animals and animals whose records were 3.5 standard deviations above or below the mean of their CG were eliminated. At least the dam was known for all animals. The CGs were formed by combining the effects of sex, management farm at weaning and yearling, year and season of birth, management group at weaning and yearling, and month of weaning and yearling.
After editing the data, 62,212 animals were maintained in the file. The pedigree file contained 75,088 animals, including 12,876 animals of the base population, 39,402 animals with known paternity and 22,810 animals from multiple-sire mating. The multiple-sire groups consisted of 3, 4, 5, 6 and 10 sires.
2.2 Simulation data
Simulated data designed in Cardoso and Tempelman (2003) were used to compare the models prediction under a known for field data. Simulated data consisted of 10 simulated datasets for one trait with medium direct heritability ( = 0.3), as postweaning weight gain. The residual variance
  considered was 60. Each population included 80 sires, 400 dams (480 parents) and 2,000 non-parent animals, all of which descended from 20 base sires and 100 base dams, with overlapping generations. Thirty per cent of the animals were assigned to an uncertain paternity situation with six different group sizes: 2, 3, 4, 6, 8 or 10 candidate sire. Once the group was chosen, one of the males in the group was selected to be the true sire, used in the simulation process and later available model evaluation. Additional details on the design of the simulations study can be founded in Cardoso and Tempelman (2003).
2.3 Model
2.3.1 Bayesian hierarchical model with unknown paternity
The following single-trait animal model for one PWG record was considered:
 (1)
(1)where yi is the PWG observed for animal i; β is the vector of fixed effects (effect of the animal's age at yearling and linear and quadratic effect of cow age, 2–16 years); u is the vector of direct genetic effects; ei is the residual associated with the record of animal i, and  and
and  are incidence matrices relating the effects of β and u, respectively, to the record of animal i.
The data-generating process (for yi = 1, 2,…,, n) was based on the following conditional normal distribution, and the given parameters β, u and  can be written as:
 (2)
(2)where  and
and  are incidence matrices and I is an identity matrix. Unlike the sire model of Foulley et al. (1987), the specification of the first stage of the hierarchical model in Equation 2 does not depend on the knowledge of the true sire of animal i as it is based on an animal model, even when some animals have uncertainty in the assignments of paternity. All elements of Z are known as they relate the effects of animals u (and not of their sires) to their records.
Thus, the likelihood of the data according to Equation 2 can be written as:
 (3)
(3)The second stage of the model is defined by the prior distributions of the location parameters. For the fixed effects, the absence of prior knowledge is represented by:
 (4)
(4)The prior specification of u for the animal model depends on the knowledge of the numerator relationship matrix (A). As certain individuals in the dataset analysed have uncertain paternity, the true sire of progeny i is unknown and this situation is represented by the random variable  (Cardoso & Tempelman, 2003). If si* = sij is the situation in which sire j is the true sire of animal i, we have the following specification:
 (5)
(5)where s* = sj corresponds to the set of all paternity assignments and As is the conditional numerator relationship matrix in these assignments.
The density of this prior is represented by:
 (6)
(6)where p is the total number of animals and dij is the fraction of genetic variance due to Mendelian segregation, calculated by the variance of 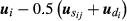 , assuming that sire j is the true sire of animal i. Here,
  and
and  are the breeding values of the sire and dam of animal i, respectively, and are equal to zero for animals with unknown sires. In addition, the inverse
  corresponds to the ith element of matrix D−1 in A−1 = TD−1T, the decomposition used to compute A−1 (Henderson, 1976; Quaas, 1976). The value of
  can be calculated by the inverse of
  , where akk is an element of the diagonal A corresponding to the sires of animal i and defined as zero for animals of the base generation with unknown sires.
Finally, in the third stage, multinomial distributions are specified for the prior probabilities of the paternity assignments:
 (7)
(7)If  is the set of all of these probabilities including vi sires for each animal p, we can marginalize a priori in Equation 6 regarding the possible parentage assignments using the prior probabilities defined in Equation 7. The following result is thus obtained:
 (8)
(8)In Equation 8, the contribution of all candidate sires is weighted based on their prior probabilities, instead of conditioning the knowledge of paternity assignment.
Assuming that the dispersion parameters are known and that 2, 4, 6 and 7 are conditionally independent and using the marginalization in 8, the posterior distribution of β and u is given by:
 (9)
(9)2.3.2 Consideration of paternity assignments
 (10)
(10) is based on qij’s (posterior probabilities) and not on fixed priors (πij) as originally proposed by Henderson (1988). However, as the posterior probabilities depend on the values of u, even when the variances are known, the resulting system is non-linear and needs to be solved using an iterative method as follows:
 (11)
(11) indicates that the posterior probabilities used for computation were obtained from the additive breeding values of the previous cycle
  .
.2.3.3 Implementation of the iterative process
The values  of necessary to compute
  (Henderson, 1988; Perez-Enciso & Fernando, 1992) were obtained directly without the need to first calculate
  using the efficient algorithm developed by Famula (1992).
The following iterative process was used:
- a) To start the process, before we have a solution for u, the paternity probabilities are initialized from their priors, that is, at t = 0, qij = πij for all i and j.
- b)
 is computed from the values of
  using the algorithm of Famula (1992), and solutions
  and
and  are obtained with the Equations in 11.
 - c)
 is computed with the Equations in 10 using
  .
. - d) Convergence is tested by verifying whether
 . If true,
  ,
,  and
and  are saved and the algorithm is ended. On the other hand, if the criterion has not been reached, the process returns to step b.
2.4 Data analysis
Three approaches were adopted for the treatment of unknown paternity of animals born to multiple sires:
- ITER: iterative empirical Bayesian model to calculate the posterior probabilities of paternity via maximum likelihood according to the concepts proposed by Foulley et al. (1987), as outlined in item 2.2;
- HIER: Bayesian hierarchical model proposed by Cardoso and Tempelman (2003) to infer on uncertain paternity;
- ANRM: model based on the average relationship matrix proposed by Henderson (1988), in which equal probabilities are assigned to each possible sire of animals with uncertain paternity.
The ITER model was compared to the ANRM and HIER models for the estimation of the genetic effect of the animal with unknown paternity. Spearman and Pearson correlations between the posterior mean of the genetic effects of animals were calculated to compare the ranking of animals for selection. The correlations were obtained with the ANRM and HIER models using the Intergen software (Cardoso, 2008). For the estimation of modal values using the ITER model, the software Intersires developed for this purpose was used. These correlations were obtained for all animals of the pedigree and for animals ranked as the top 10%, 30% and 50% based on their breeding value. The computational time of the statistical procedures was determined.
3 RESULTS AND DISCUSSION
The Spearman and Pearson correlations between the ITER model and the other two models (ANRM, HIER) were similar for all files (Table 1). When all animals of the pedigree were considered, the highest correlations were observed between the genetic effects of the animal, indicating that the choice of the model does not interfere with breeding value prediction. However, the correlations decreased when the files with the best animals were considered. When only best-ranked animals (animals ranked as the top 10% based on their breeding values) were taken into consideration, the correlations decreased to about 80% for field data. In the simulated data, the correlations also decreased when smaller percentages were considered, although none were <85%. These results suggest that the breeding values of the animals estimated with the models studied are relatively similar, but the choice of the model (ITER versus ANRM or ITER versus HIER) will imply reranking of moderate biological importance; that is, some changes occurred in the rank of the animals to be selected.
| Correlations | ||
|---|---|---|
| Correlations between Files | Spearman | Pearson |
| Field data | ||
| ITER versus HIER | ||
| Complete | 0.973 | 0.970 |
| 50% | 0.905 | 0.922 |
| 30% | 0.804 | 0.886 |
| 10% | 0.768 | 0.821 |
| ITER versus ANRM | ||
| Complete | 0.972 | 0.969 |
| 50% | 0.901 | 0.918 |
| 30% | 0.842 | 0.881 |
| 10% | 0.763 | 0.817 |
| Simulated data | ||
| ITER versus HIER | ||
| Complete | 0.983 | 0.984 |
| 50% | 0.946 | 0.960 |
| 30% | 0.917 | 0.944 |
| 10% | 0.859 | 0.909 |
| ITER versus ANRM | ||
| Complete | 0.985 | 0.985 |
| 50% | 0.949 | 0.962 |
| 30% | 0.919 | 0.947 |
| 10% | 0.867 | 0.913 |
| ITER versus TRUE | ||
| Complete | 0.758 | 0.771 |
| 50% | 0.565 | 0.594 |
| 30% | 0.481 | 0.525 |
| 10% | 0.382 | 0.428 |
| HIER versus TRUE | ||
| Complete | 0.766 | 0.779 |
| 50% | 0.572 | 0.602 |
| 30% | 0.493 | 0.538 |
| 10% | 0.423 | 0.460 |
| ANRM versus TRUE | ||
| Complete | 0.765 | 0.779 |
| 50% | 0.567 | 0.600 |
| 30% | 0.495 | 0.538 |
| 10% | 0.412 | 0.448 |
Spearman and Pearson correlations, estimated for the different files, were very close. Furthermore, the correlations between ITER and HIER and between ITER and ANRM were similar evaluating different files, which decreased at the same proportion when only high-ranked animals were evaluated. This trend was expected and corroborates the high correlations (> 0.94) between HIER and ANRM reported by Cardoso and Tempelman (2004), even when only the 5% of animals with the best breeding values were selected.
The mean and standard deviation of the breeding values estimated with the model proposed (1.18 ± 5.74 kg) were slightly higher than those estimated with the HIER model (0.99 ± 3.81). In addition, the 95% confidence interval for the breeding values was slightly larger for the ITER model (−10.27 to 12.72) compared to HIER (−6.45 to 8.87). This result is not necessarily expected as the ITER model assumes the variance components to be known. In the present study, the variance components were assumed to be the posterior means obtained with HIER in the present population (Shiotsuki et al., 2012) and similar dispersions would, therefore, be more plausible. On the other hand, although slightly lower estimates are obtained with the HIER model, these breeding values are within the 95% confidence interval of the estimates provided when the ITER model was adopted.
For the models used in the present study, the mean posterior probabilities of the candidate sires were the same as those attributed a priori (considering a ratio of 1/number of candidates, respective size of the multiple-sire group). The HIER model concentrated higher probabilities for one or two candidates, while the ITER model more evenly distributed these posterior probabilities across all candidates (Figure 1). For the HIER model, the higher posterior probabilities of the candidates indicate a trend to infer towards the correct sire (Cardoso & Tempelman, 2003).

The range of the modal value of posterior probabilities of candidate sires estimated with the ITER model was higher than those obtained with HIER (Table 2). The modal value of the posterior probability estimated with the ITER model was 60%–296% higher than the respective prior probabilities. The large magnitude of the differences between prior and posterior probabilities suggests that phenotypes are more informative for the ITER model to infer on paternity compared to HIER (Cardoso & Tempelman, 2003), as the modal values of the posterior probabilities obtained with the latter model were only 10%–11% higher than the respective prior probabilities attributed to candidate sires (Table 2). These values are close to those described by Cardoso and Tempelman (2003) applying HIER to a dataset of Hereford animals and by Sapp, Zhang, Bertrand, & Rekaya, 2007 adopting a model that uses phenotypic data without the need to calculate the inverse of the average relationship matrix.
| Size of RM group | Sire probability range | Probability of true sire | Correlation | ||
|---|---|---|---|---|---|
| HIER | ITER | HIER | ITER | HIER versus ITER | |
| Field data | |||||
| 3 | 0.30–0.37 | 0.10–0.63 | NA | NA | 0.84 |
| 4 | 0.22–0.28 | 0.01–0.65 | NA | NA | 0.78 |
| 5 | 0.18–0.23 | 0.02–0.61 | NA | NA | 0.75 |
| 6 | 0.15–0.19 | 0.00–0.66 | NA | NA | 0.76 |
| 10 | 0.09–0.10 | 0.04–0.17 | NA | NA | 0.67 |
| Simulated data | |||||
| 3 | 0.23–0.51 | 0.14–0.50 | 0.347 | 0.341 | 0.48 |
| 4 | 0.17–0.34 | 0.15–0.35 | 0.268 | 0.260 | 0.45 |
| 6 | 0.12–0.23 | 0.11–0.21 | 0.180 | 0.172 | 0.31 |
| 10 | 0.07–0.13 | 0.05–0.13 | 0.108 | 0.103 | 0.22 |
- NA, not applicable for field data.
The highest correlations between posterior probabilities estimated with the two models were found in the multiple-sire groups with the smallest number of candidates (Table 2). The positive and moderately high correlations indicate that the posterior probabilities estimated with the HIER model are very similar to those calculated with the ITER model proposed here.
The use of controlled mating or artificial insemination is impracticable in the case of large herds, mainly because of labour costs and the need to delimit areas during the breeding period. However, the exclusion of information from animals with uncertain paternity reduces genetic progress (Cardoso & Tempelman, 2003), in addition to the impossibility of comparing the reproductive and productive performance of different sires (Sullivan, 1995). Consequently, different models that consider animals of the whole database for genetic evaluation, including those with uncertain paternity, have been developed.
Models that consider the uncertainty in paternity have shown increased accuracy in breeding value prediction (Cardoso & Tempelman, 2003; Sapp et al., 2007; Shiotsuki, Cardoso, Silva, & Albuquerque, 2013; Shiotsuki et al., 2012). The model proposed in the present study via iterative solutions (ITER) uses a set of prior information and phenotypic data for assignments of paternity in large-scale breeding programmes. This approach permits to improve the prediction of breeding values of animals in situations of uncertain paternity, providing estimates of the genetic effect of the animal and probabilities of candidate sires close to those obtained with the Bayesian hierarchical model (Cardoso & Tempelman, 2003). However, the shorter computational time of each ITER analysis (approximately 12 hours, while the HIER model required approximately 20 days for the same analysis) makes it a suitable tool for genetic evaluations using large databases without additional costs.
In conclusion, the model proposed in the present study is a suitable computational alternative to improve the prediction of breeding values of animals in genetic evaluations using large databases, including animals with uncertain paternity.
ACKNOWLEDGEMENTS
The authors acknowledge the financial support from São Paulo Research Foundation (FAPESP, 2006/58896-6), Coordination of Improvement of Higher Education Personnel (CAPES, 4057/08-2) and Agriculture Jacarezinho for providing the data.