
Auditors’ Response to Client Corruption: Evidence From Google Document Frequency
This paper was presented at the 2024 JBFA Capital Markets Conference, University of Bristol, May 2024. The conference was kindly sponsored by the University of Bristol, the KPMG Foundation and the publisher, Wiley.
ABSTRACT
The heated debate on auditors’ responsibility to detect client illegal activity and the related protracted standard-setting implementation underscores an urgent need to understand how auditors respond to client-specific noncompliance with laws and regulations (NOCLAR). Although prior research has examined auditors’ responses to noncompliance risks in the context of foreign bribery and political corruption, these studies’ insights are limited due to a focus on regional corruption proxies or clients with observable acts of foreign corruption. Our study introduces a Google document-frequency measure that captures both the actual and perceived prevalence of illegal acts by firms in each year. A key advantage of our time-varying, client-specific measure is that it provides a holistic proxy of illegality by capitalizing on widely disseminated textual information in decentralized Internet databases. We first demonstrate that our Google-based corruption measure is a leading predictor of client noncompliance risks, offering incremental predictive power beyond regional corruption proxies. We then predict and find that auditors’ input and output behavior is associated with this novel measure. Specifically, in response to client corruption, auditors adjust their production inputs and charge higher audit fees. Related to audit output, we find that financial restatements and auditor decision errors are more prevalent for corrupt clients. This evidence suggests that, although auditors appropriately price for noncompliance risk, their execution of the audit does not fully adjust for the risk identified.
1 Introduction
High-profile cases of public companies’ violations of laws and regulations that do not meet the “direct and material” rule in existing auditing standards have concerned US regulators, lawmakers, and investors about auditors’ efforts and responsibilities to report (publicly) on corporate illegal activity (PCAOB 2018). Internationally, the IAASB addressed similar concerns by issuing new guidance on auditors' considerations of laws and regulations on financial statement audits (ISA 250) for audits effective July 15, 2017 (IAASB 2016). In the US, however, regulation to strengthen auditors' responsibilities around noncompliance with laws and regulations (NOCLAR) has been charged and contentious. This is because the US legal environment is more litigious than similar economies, and because standard setting in complex areas that expand auditors’ responsibilities has had a long passage to adoption.1
During the initial deliberations of the NOCLAR standard-setting project, the PCAOB recognized the complexity of the issue. Former PCAOB Chairman James Doty deemed it “a difficult problem” and noted that getting to a new standard will be “one of the most challenging” endeavors (PCAOB 2017b, 177). Indeed, two PCAOB board members dissented from the June 2023 exposure draft of the revised standard, along with strong opposing views from businesses, auditors, and members of the US Congress. However, ongoing NOCLAR by public companies, coupled with investor frustration over the lack of auditor forewarning (e.g., IAG 2023), continues to provide an opportunity to assess the propriety of auditor behavior given the risk of corporate corruption and illegalities. Our study tackles this issue by examining auditor input and output in response to the potential for client corruption and illegal activity before observable acts are revealed. In doing so, we provide evidence on one aspect considered in the proposed NOCLAR standard—whether auditors can assess the increased risk of a client's NOCLAR before actual violations have been observed (e.g., DesParte 2023; C. Ho 2023; Boland et al. 2024).
Under current standards on financial statement audits, auditors have an overarching responsibility to assess the risk of material misstatement. This assessment includes evaluating the risks inherent to the client without consideration of controls and the risks associated with internal controls that do not prevent or detect material misstatements (AS 1101; PCAOB 2010). The auditor then determines their level of detection risk based on their assessment of the risk of material misstatement in the client's financial statements. In our setting, auditor input and output is the operationalization of detection risk. Our focus on client corruption is forward-looking and consistent with the Securities Exchange Act of 1934 Section 10A that considers auditors’ responsibility for illegal acts broadly to include “an act or omission that violates any law, or any rule or regulation having the force of law” (Section 10a, (f); US Congress 1934). Research finds that organizational corruption typically begins with unethical conduct by few individuals and organizational leaders, which, left unchecked, spreads and becomes embedded in firm culture, ultimately leading to illegal activities (e.g., Ashforth et al. 2008; Anand et al. 2005). This focus on client corruption and the related risks is a subset of the auditor's evaluation of the risk of material misstatement. If the risk assessment process is performed appropriately, the auditor will be able to design and execute audit procedures that incorporate the identified risks. It is our empirical question as to the efficacy of the auditor's response to client corruption risks.
AS 2405, Illegal Acts (AS 2405), adopted as a part of the PCAOB's interim standards in 2003, provides guidance for the auditor's response to illegal acts or other noncompliance with laws and regulations.2 This standard has remained largely unchanged since its adoption in 1989. Critics of AS 2405 assert that the standard does not require specific procedures regarding the auditor's search and evaluation of incidents of noncompliance but that financial statements users expect auditors to identify issues of noncompliance (Palmrose and Wright 1993). Prior empirical work examines the auditor's response to a specific form of noncompliance, foreign corruption, and shows that audit fees are higher for companies that engage in bribery of foreign government officials or are charged with Foreign Corrupt Practices Act (FCPA) violations (Lyon and Maher 2005; Lawson et al. 2019). This evidence indicates that auditors respond to the increased risk attributed to actual corrupt practices by incorporating this risk into audit pricing.
Related studies also show that auditors incorporate the inherent risks of political cronyism and money-related corruption when operating in corrupt regions within and outside of the United States (Gul 2006; Jha et al. 2021; Xu et al. 2019; Mottinger 2024). Similarly, studies show that auditors incorporate risks stemming from corrupt firm cultures, proxied by the country of ancestry of the client's executive directors (Gu 2017) or the client's spending on entertainment and travel costs as an indirect measure of greasing activities (Hu et al. 2023). However, in the absence of a revealed violation or the use of regional location or firm culture proxies as identification strategies, it has been difficult to assess how auditors incorporate firm-specific risks related to client corruption or noncompliance into audit production.
Our research tackles this issue by creating a novel, firm-specific measure of client corruption based on counts of the number of Internet documents (i.e., Google search hits) containing the keyword “corruption” in close textual proximity to the firm's ticker symbol.3 This count-based measure (also referred to as document frequencies) takes advantage of information spread on the Internet and is based on the empirical finding that document frequencies in large decentralized textual databases can serve as useful proxies for the occurrence frequencies of difficult-to-observe economic and social phenomena (Saiz and Simonsohn 2013).4 In our setting, we use the count of Google search hits to infer the relative prevalence of corruption or noncompliance at the firm-year level for US public companies. Similar Internet count measures have been used to proxy for constructs such as illegal arms trading, perceptions of consumer brands, economic policy uncertainty, geopolitical risks, the extent of regulatory oversight, and the political connectedness of firms (DellaVigna and La Ferrara 2010; Netzer et al. 2012; Baker et al. 2016; DellaVigna et al. 2016; Do et al. 2015; Caldara and Iacoviello 2022).
Utilizing a measure based on widely available Internet documentation has several important benefits over measures that are based on the actual occurrence of a corruption event. First, the Google-based measure is easily replicable and provides a broader view of corruption than an FCPA violation or firms’ operation in politically corrupt environments. This ease of replication lends itself to being a tool that can be used in the risk assessment process. Second, the measure uses crowdsourcing to capture unobserved acts of noncompliance that are not (yet) revealed through enforcement or litigation channels but are written about or discussed in public Internet documents. These Internet documents also capture the collective wisdom of the crowd regarding public perceptions about a firm's corrupt or noncompliant behaviors. Third, the use of word searches and document-frequency counts is consistent with forensic accounting practices used in the private sector. Although more sophisticated models of natural language processing have emerged, the simplicity of our novel count-based measure is appropriate in this context. Last, our Google count-based measure alleviates endogeneity concerns that are common to corruption proxies based on a firm's location choice or the choice of its corporate executives. Taken together, our Google-based measure approach provides a broader and more holistic view of corruption that can better contribute to our understanding of auditor risk assessment and response.
We base our analysis on a sample of 14,404 firm-years for all US-domiciled companies with available data in Audit Analytics and Compustat traded on the NYSE, AMEX, or NASDAQ exchanges from 2008 to 2014. We first evaluate the validity of our Google-based corruption measure using both manual and regression-based methods. Our analyses indicate that our document-frequency approach provides a valid corruption construct that is correlated with and predictive of revealed federal litigation actions for noncompliance with a broad array of US laws and regulations. Our construct is also correlated with and predictive of violations of the FCPA and incidents of corporate misconduct that violate national legislations and international standards.
We next examine the auditor's response to corruption using both audit production (i.e., audit fees) and audit quality (i.e., financial restatements and audit decision error) measures. Put differently, our tests capture audit input and output as functions of client-specific corruption risks. We find a significantly positive association between corruption, as defined, and audit fees, which suggests that auditors are responsive to increased client corruption risk. The result remains positive and significant when controlling for clients operating in corrupt localities and when accounting for actual acts of corruption. Further, using unexplained audit fees as a proxy for unobserved audit costs (Hribar et al. 2014; Doogar et al. 2015), we find that our results are driven by increased audit effort rather than simply higher fee premiums charged to corrupt clients. Our evidence is noteworthy because our corruption measure incorporates both actual and perceived corruption (unlike prior studies) and has a broad corruption focus that moves beyond the political or foreign corruption considered in prior work. Those who oppose broadening auditors' responsibility around the risk for client illegal activity have argued that a lack of legal expertise could inhibit auditors’ risk response (e.g., Needles et al. 1991; DesParte 2023; C. Ho 2023). Our evidence, however, indicates that auditors have the capacity to discern and respond to NOCLAR risk and that simple document-frequency measures can serve as a useful tool for auditors’ assessment of noncompliance risk.
Next, due to our finding of increased audit fees in incorporating client corruption risk, one would expect no association between client corruption and our measures of audit quality. That is, auditors should have designed appropriate procedures in response to their risk assessment to mitigate restatements and audit decision errors. However, an alternative view from prior research on audit effectiveness (e.g., Hammersley et al. 2011; Joe et al. 2017) suggests that auditors might have difficulty in adjusting their audit procedures in the presence of increased noncompliance risk. We find a positive and significant association between our Google corruption measure and the likelihood of financial restatement for both the general client population and the highly corrupt client population. Further, that association is not weakened when we include a local corruption control measure or when we control for actual acts of noncompliance. Regarding auditor reporting decisions, we find that the frequency of Type II errors increases with client corruption risk, indicating that auditor's expanded audit inputs might not be as effective in environments with client corruption. These findings highlight the potential for lower audit quality in high-corruption risk settings.
In cross-sectional analyses, we find that auditors appropriately charge higher fees for high-corruption clients that hold large cash balances (a proxy for bribery risk, following Smith 2016) and those with weak takeover pressures as a managerial disciplining mechanism. We however find no evidence of higher quality audit outcomes for these cross-sections of firms. This evidence supports our conjecture that auditors do not effectively adjust for client corruption risks. Last, we find that our inferences are robust to controls for endogeneity and alternative control variables.
Our study is important to auditors and regulators as it indicates a gap in auditor performance that can reduce audit quality. The dissonance between the auditor's pricing for client corruption risk and the execution of audit procedures to address the risk could warrant additional regulatory guidance that helps auditors to adequately address noncompliance risk. Our results provide some caution to auditors when performing risk assessments related to client corruption. Although the pricing might incorporate increased auditor effort, there could be instances where corruption risks are not being linked to effective underlying audit procedures.
We contribute to the client corruption literature by providing more comprehensive and generalizable results, when compared with prior studies that are limited to small samples of actual instances of illegal activity. Notably, our study provides the initial evidence of an association between corruption risk and future financial reporting detrimental outcomes, despite evidence of higher priced audits in the presence of client corruption risk. We encourage future research to disentangle auditor effort from risk compensation when higher fees are charged, and to identify- which types of corruption auditors are most adept in mounting a response. Overall, the study provides evidence suggesting that revisions to AS 2405 could achieve improved auditor performance surrounding their clients’ NOCLAR. This evidence is consistent with the PCAOB Investor Advisory Group's (IAG) emphasis on the necessity of reforming the guidance around NOCLAR due to the changing nature of business and the longstanding expectations gap between the auditor's performance and investor expectations (PCAOB 2017c; IAG 2023).
2 Background and Hypothesis Development
2.1 Escalation of Corruption to Illegal Activity
To understand the genesis of an illegal act that is within the scope of AS 2405, we focus on corruption because prior research finds that corruption is on the continuum of the slippery slope of organizational slide from unethical actions to illegal activity. We also note that corruption without an illegal act is still of interest as a corrupt corporate environment could still lead to wealth extraction from shareholders. In a series of experiments exploring the source of organizational misconduct, Gino and Bazerman (2009) find that there is a gradual erosion of ethical standards in individuals that promotes the acceptance of bad behavior, which over time creates an environment that allows corporate violations of laws and regulations. Consistent with that experimental evidence, research finds that when unethical conduct is not restrained, it becomes embedded to form an organizational culture of corruption that emphasizes and values revenue above everything even if that means illegal activity. For example, former Enron CEO Jeff Skilling stated that money and revenues were the only things that mattered (ColdFusion 2019). The organizational culture of corruption normalizes unethical corporate behaviors and violations of the law (Ashforth et al. 2008; Anand et al. 2005). In some instances, companies rationalize violating laws because they view the law as being as unjust or they see the organization as being above the law (Anand et al. 2005; Zyglidopoulos et al. 2009). Fleming and Zyglidopoulos (2008) use several real cases of corporate crime to illustrate how corrupt behaviors, in their case deception (both providing false information and withholding truthful information), escalate in organizations resulting in illegal acts such as environmental pollution and fraudulent financial reporting. They report that a former Enron executive acknowledged that: “You did it once, it smelled bad,…You did it again, it didn't smell as bad” (Fleming and Zyglidopoulos 2008, 841).
2.2 Client Corruption
Corporate corruption and illegal acts manifest in many ways in organizations ranging from bribery of government and oversight officials (Walmart; Securities and Exchange Commission [SEC] 2019), to securities law violation (Alibaba; Bloomberg 2019), illegal account openings (Wells Fargo; Department of Justice [DOJ] 2020), and violations of federal environmental laws (Volkswagen; DOJ 2017). Even when these violations are not material at the time of detection or revelation to auditors, investors and regulators worry that these acts can have a material impact on the financial statements in the future due to liability and reputation risk exposure. For example, Walmart's $527,000 illegal payment to a Brazilian intermediary and an approximately $27 million payment in Mexico to facilitate construction and store expansions, though insignificant for the company, ultimately led to settlements with US regulators totaling $282 million and an additional $900 million in related costs to address FCPA inquiries and global compliance investigations (Barstow 2012; SEC 2019). Similarly, Wells Fargo's unlawful and unethical sales practices and subsequent coverup resulted in the company making a $3 billion civil and penalty payment in settlement with the US Department of Justice (DOJ; DOJ 2020). Thus, although instances of client corruption can start out as immaterial, they can ultimately rise to a level of having a quantitatively or qualitatively material impact on financial statements. Further, in many cases, corrupt behavior not only includes the illegal activity but can also include management's failure to report or their concealing of illegal activity, which can increase the risk of a material weakness related to the internal control over financial reporting (ICFR) in an integrated audit.
2.3 AS 2405—Auditor's Responsibility for Illegal Acts and NOCLAR
Although auditors have a responsibility to plan the audit to obtain reasonable assurance that the financial statements are free of material misrepresentations related to illegal acts, it is difficult for auditors to plan procedures to detect illegal acts. Some believe it is unreasonable to expect auditors to assume responsibility for detecting and disclosing an entity's violations of laws because (1) auditors lack the legal training to recognize complex circumstances that increase the risk of noncompliance or are indicators of noncompliance, and (2) the amounts associated with violations and noncompliance of laws can be immaterial and therefore not cross the auditor's radar (Needles et al. 1991; Boland et al. 2024). Accordingly, the auditor's responsibility for testing around illegal acts has not changed much since the Cohen Commission report that believed most of the responsibility over NOCLAR should fall to management and its legal counsel (AICPA 1978).
Currently, the auditor is not required to include specific procedures to detect illegal acts during the normal course of an audit (PCAOB 2003, ¶ 08). The only other consideration the auditor has under the current standards is their holistic risk assessment process. Auditing standards support the view that the determination of what constitutes an illegal act can be difficult for auditors and often requires assistance from other technical experts or the courts (PCAOB 2003, ¶ 03). The standards further observe that auditors can experience challenges identifying and detecting illegal acts during the audit, particularly for illegal acts that have indirect but material impact on the financial statements (PCAOB 2003, ¶ 06, 07). Thus, we anticipate that when an auditor assesses an increased noncompliance likelihood at their client, they will expend more effort on the engagement, thereby resulting in increased audit fees on such engagements.
Auditing standards and best practices also provide that when auditors obtain information that the client has engaged in illegal acts, they should consult with legal experts (and other specialists where applicable) and expand the scope of audit procedures to determine the potential impact on the financial statements. The use of specialists (i.e., experts) on audit engagements typically results not only in increased fees but can also extend the length of the audit because coordination between auditors and their specialists is time-consuming and contributes to audit delays (Hux 2017; Boritz et al. 2020; Zimmerman et al. 2023; Barr-Pulliam et al. 2023). Many of the additional audit procedures, however, rely on information that is provided by the client, which can be subject to bias and manipulation, and therefore can increase the auditors’ risk exposure (PCAOB 2003, ¶ 9–11; 17). High-risk areas on the engagement typically require the involvement of higher level engagement team members because they require interaction with upper-level client personnel (e.g., client legal counsel; audit committee members; members of the board of directors). For example, enhanced reporting requirements pertaining to Section 10A of the Securities Act of 1934 in the Private Securities Litigation Reform Act of 1995 require auditors to inform management and the board of directors or audit committee of any illegal acts that have or might have occurred.
Further, it is likely that any increased risk and effort associated with NOCLAR at the client will trigger the auditor's consideration of whether the issue at hand constitutes a critical audit matter (CAM), which requires increased disclosures and coordination of effort with the audit client. Under AS 3101 (PCAOB 2017a, 2017d) auditors are required to discuss key areas of uncertainty in the financial statements detected during the audit and the auditor's procedures to address any CAMs. Because management is likely to provide its own disclosure related to CAMs identified in the audit report, increased audit effort and extended time on the audit is likely to occur due to meetings with senior management and the audit committee (Fuller et al. 2021). Auditors must also notify the SEC if the board fails to take appropriate steps to address and modify financial reporting related to the material impact of illegal acts. These additional procedures and the involvement of more experienced auditors would lead to increased audit fees.
The auditor's increased procedures in response to NOCLAR is one aspect that leads to higher audit fees. Prior literature has established that audit fees are a construct of both increased effort such as expanded audit procedures and a risk premium for future litigation or reputational costs associated with undetected deficiencies (Hay et al. 2006; Pratt and Stice 1994; Simunic 1980; Widmann et al. 2021). In our setting, the increased perception of corruption for audit clients could lead the auditor to charge a fee premium as compensation for accepting a higher level of audit risk. However, we do not expect that any increase in fees will be totally in the form of a risk premium. As documented in Bell et al. (2001), auditors respond to higher client risk by increasing the scope of the audit or the number of hours worked—leading to higher total billable costs, rather than simply raising the hourly billing rate. Such expanded work in our setting would include legal consultations, specialist involvement, board and audit committee communications, evaluation of CAMs, and the involvement of more senior audit personnel. Based on the foregoing, we formally hypothesize:
H 1.Auditors will increase overall audit effort, which will manifest in increased audit fees specifically related to client corruption risk.
Notwithstanding the auditor's recognition and assessment of increased corruption risk, prior research finds that auditors experience difficulty adjusting their outcomes and responses in the presence of increased client risk. That is, auditors increase effort but do not appropriately adjust the nature of testing to address the risks identified. Hammersley et al. (2011) examine fraud risk and find that auditors adjust the extent of testing but make insufficient adjustments to the nature of testing (i.e., their ability to detect misstatements) when fraud risk is high. Joe et al. (2017) document that auditors do not appropriately distinguish their testing in response to client control risk, and Brazel and Agoglia (2007) find a disconnect in auditor testing relative to their risk identification and assessment. Relatedly, Aghazadeh and Joe (2022) document that client-specific factors can mute an auditor's response to client risk. They find that in spite of management exhibiting high confidence, which auditors judged as an attempt to bias their assessment of client evidence, auditors did not appropriately adjust their response to higher versus lower levels of misstatement risk at the client. Similarly, evidence from Hribar et al. (2014) suggests that even if auditors do expand the audit scope when client risk is high, their efforts cannot fully remediate poor accounting quality due to inherent constraints in auditors’ ability and their work capacities. Thus, while increased audit effort could reduce the financial reporting effects of illegal acts, there is likely to be a negative relation between client corruption risk and audit quality.
There are additional considerations relative to the auditors’ response to illegal acts or NOCLAR risks. Academics argue that it is unclear whether auditors “could deal with” these risks due to the volume and complexity of US regulations (Boland et al. 2024, C14). Currently, there is limited guidance and no framework on which auditors could rely to assess and develop an appropriate response to NOCLAR risk. Additionally, ex ante measures of NOCLAR risk could be capturing other aspects of the audit engagement and client risk factors, or auditors could be offsetting other engagement risks. With these compelling factors noting the challenges auditors face in responding to heightened client risk and more specifically corruption risk, we hypothesize:
H 2.Auditors will not appropriately adjust client-specific audit procedures in response to client corruption risk resulting in lower audit quality as measured by financial restatements and audit decision errors.
Auditors’ determination of audit fees is opaque, and there is currently no public data that disaggregate the total audit fees charged to clients into the components associated with auditor effort and any additional risk premium. Thus, appropriately, our hypotheses do not disentangle audit fees associated with auditor effort versus the risk premium component of total audit fees. Notwithstanding the unobservable nature of the components of audit fees, our empirical analysis will shed light on whether auditors’ fee pricing for client corruption risks is more indicative of increased effort or a risk fee premium.
3 Data and Research Method
3.1 Data and Sample Selection
We base our analysis on a comprehensive sample of all firm-years with available data in Audit Analytics and Compustat for the fiscal years, 2008 to 2014. Following prior Google search studies (e.g., Da et al. 2011; Drake et al. 2012; Stice 2020), we restrict our analysis to US-domiciled firms that are publicly traded on the NYSE, AMEX, or NASDAQ. This data restriction allows us to capture economically meaningful firms within the same jurisdiction as well as firms with sizable repositories of decentralized Internet documents as indexed by Google's search engine. As discussed in more detail below, we conduct our Google document search using a firm's ticker symbol. We focus our search on ticker symbols since these are uniquely assigned to each firm and are less ambiguous than company names (e.g., “AAPL” vs. “Apple” for Apple Computer Inc.). In addition, we follow Da et al. (2011) and conjecture that Internet documents containing a firm's ticker symbol are more likely to reflect the financial information available about the firm. This assumption is important for our study since our research objective is to examine the audit and financial reporting risks that are inherent to firm corruption. Last, to reduce noise in our empirical analysis, we exclude ticker symbols with alternative or common meanings such as “A,” “BLUE,” “GAS,” or “ZOOM.” These data criteria result in a final sample of 14,404 firm-years over the 2008 to 2014 fiscal period.
Our Google search data were collected in real time during November 2015. Google updates its search index over time and removes Internet documents or sites from its index when: (1) Google is legally obligated to do so, (2) the document or site does not meet Google's quality guidelines, or (3) the document or site reduces users’ ability to locate relevant information. Internet documents and sites are also removed from the index if the webmaster of the underlying website requests the removal of content from the search index or if Google's crawling process detects changes in the website's content. Given these real-time updates in Google's index, we first test for historical decay in search hits by fiscal year for a random sample of ticker symbols. We find that the number of search hits for each firm ticker in our random sample drops significantly when we search fiscal years prior to 2008 (i.e., 7 years prior to our data collection in November 2015). We therefore begin our sample in fiscal year 2008 and end the sample in fiscal year 2014 (the final fiscal year with complete data in Compustat at the time of our data collection in November 2015).5
3.2 Google Document-Frequency Measure of Corruption
We construct our measure of firm-level corruption using the Internet document-frequency approach developed in Saiz and Simonsohn (2013). This approach uses the aggregate frequency of narratives or text documents in decentralized repositories such as the Internet or digital news archives to proxy for the occurrence of unobservable economic and social phenomena. As Saiz and Simonsohn (2013) argue, “the more a phenomenon occurs the more likely someone is to write [or post] about it,” thus creating an inherent correlation between document-frequency (commonly referred to as “search hits”) and the occurrence-frequency of the phenomenon of interest. Consistent with this argument, studies find that Internet or news document frequencies serve as strong proxies for unobservable behaviors and hard-to-measure constructs such as illegal arms trading by weapon manufacturers (DellaVigna and La Ferrara 2010), consumer brand perceptions (Netzer et al. 2012), economic political uncertainty (Baker et al. 2016), the extent to which an industry is regulated (DellaVigna et al. 2016), state-level activities of politically connected firms (Do et al. 2015), and macro-level perceptions of geopolitical risk (Caldara and Iacoviello 2022).
In the corruption context, Saiz and Simonsohn (2013) demonstrate that the number of Internet documents containing the keyword “corruption” in close textual proximity to a country name or a US state name is highly correlated with common country- or state-level measures of corruption (e.g., Transparency International's Corruption Perception Index) and the number of federal DOJ convictions of local public officials for corrupt acts. Using the same document-frequency approach, Saiz and Simonsohn (2013) create the first city-level measure of corruption and find that the measure varies predictably with urban demographic and socio-economic factors. Several studies corroborate the work of Saiz and Simonsohn and find that Internet document frequencies are robust proxies of corruption within various localities (Campante and Do 2014; Do et al. 2015).
We use an analogous approach to create our Google-based proxy of corruption at the client-year level. Specifically, we use an automated Internet script or web “bot” to count the number of Google search hits for each firm and fiscal year containing the keyword “corruption” in textual proximity to the firm's ticker symbol.6 We follow Saiz and Simonsohn (2013) and use a textual proximity limit of 16 words. This limit increases the probability of capturing documents referencing actual or perceived corruption by the respective firm in a given fiscal year. We then normalize this frequency count by the number of search hits for the firm's ticker symbol in each fiscal year as recorded by the same web bot.
3.3 Empirical Models
3.3.1 Audit Fee Model
We follow the suggestions in Saiz and Simonsohn (2013) and decile-rank transform the Corruption measure to facilitate comparisons of economic significance and to correct for skewness in the distribution of search hits across firm-years. We also use a binary version of the decile-ranked variable denoted HIGH_CORRUPT, which equals one for firm-years where the Corruption measure falls in the seventh decile or higher. We control for the underlying culture of corruption within a firm's headquarter location (LOCALCORRUPT) as a factor that could be correlated with both audit effort and a firm's perceived corruption or their propensity to engage in corrupt practices. We measure LOCALCORRUPT at the US District Court level (90 districts across the United States) using the number of corruption convictions of public officials within each district as reported by the DOJ's Public Integrity Section (PIN). The PIN data are used in several studies to proxy for local corruption culture (e.g., Glaeser and Saks 2006; Smith 2016; Brown et al. 2021; Jha et al. 2021) and captures corrupt practices such as bribery, extortion, unofficial payments, campaign contributions by firms in exchange for political favors, and criminal conflicts of interest by public officials. Our PIN data are not available for calendar years after 2009; thus, we rely on the district-level convictions as of the earliest calendar year in our sample period (2008).7 We standardize the PIN measure by scaling the number of corruption convictions in each district by the district's population (as of 2008) as reported by the US Census Bureau. We then transform the PIN measure into a binary variable to classify those districts with above-median corruption convictions. We set LOCALCORRUPT to one if the per capita corruption convictions as of 2008 are greater than the median per capita convictions across all 90 districts; zero otherwise. We match LOCALCORRUPT to each firm-year using the district location of the firm's headquarters.
We control for several determinants of audit fees as documented in prior research (Hay et al. 2006; Causholli et al. 2010; Hribar et al. 2014; Jha and Chen 2015; DeFond et al. 2018). These variables capture various client, engagement, and audit firm attributes. The first set of control variables captures inherent risk factors and complexity of the audit client. These variables include firm size measured as the natural log of total assets (SIZE), firm age (AGE), the book-to-market ratio (BOOK_MKT), the natural log of the number of business and geographical segments of the firm (SEGMENTS), the square root of the number of employees (SQRT_EMPLOYEE), and the level of complex accounting estimates (COMPLEX_EST), computed as the sum of receivables, inventory, and total fair value assets, scaled by total assets. We control for litigation risk (LITRISK) as defined in J. Francis et al. (1994) to account for fee premiums typically charged to clients in litigious industries. We also control for the level of cash holdings scaled by total assets (CASH_RATIO), the ratio of foreign sales to total sales (FOREIGN), and firm leverage (LEVERAGE) as factors that are correlated with inherent audit risk as well as the propensity to engage in corrupt activities (Smith 2016). To control for inherent risk from volatile or poor financial performance, we include variables capturing the standard deviation of return on assets over at least 3 of the last 5 fiscal years (STD_ROA) and whether the firm generated a loss in the current or prior 2 fiscal years (LOSSHISTORY). We also include indicator variables for the occurrence of restructuring activities (RESTRUCT) and the issuance of debt or equity (ISSUANCE) during the fiscal year since these events can increase auditors’ litigation risk.
We further control for firms’ corporate governance mechanisms using an exogenous treatment factor stemming from the 2008 passage of the Foreign Investment and National Security Act (FINSA), which limits the ability of foreign entities to acquire US-domiciled firms operating in 61 industries classified as national security interests.8 The FINSA treatment captures a reduction in external takeover pressure as a disciplining mechanism against entrenched managers. Godsell (2024) documents that firms operating in national security industries experience greater earnings management following the 2008 passage of FINSA, consistent with a decline in managerial monitoring. As such, we create an indicator variable, NATSECIND, that equals one for firm-years in the 61 national security industries and zero otherwise.9 Prior literature suggests that corporate governance mechanisms can have opposing demand- and supply-side effects on audit inputs and audit quality (Knechel and Willekens 2006; Zaman et al. 2011; Choi et al. 2024). In our context, weaker takeover pressures could lead to higher audit inputs since weak takeover monitoring may induce low-quality financial reporting by managers and in turn increase the need for expanded audit procedures (supply-side effect). On the other hand, weak takeover pressures could lower the demand from management for a wider audit scope, resulting in lower audit fees and lower audit quality (demand-side effect). Given these arguments, the expected association between NATSECIND and our audit variables is an empirical question.
Our controls for audit engagement attributes include audit report lag (AUDITDELAY), measured as the natural log of the number of days between the signature date of the audit opinion and the fiscal year end date. This measure has been used in prior literature to proxy for audit efficiency and effort as well as adjustments to audit procedures that could delay the signing and release of the audit report (Causholli et al. (2010). We also control for the higher cost of audits conducted during busy season using an indicator variable coded as one if the firm's fiscal year ends on December 31 and zero otherwise (BUSYSEASON). The identification of problems during the audit could lead to higher audit risk or greater audit effort and, in turn, higher audit fees. We therefore control for audit problems using the decile rank of firms’ Altman Z-score for bankruptcy risk (ALTMANZ) as well as indicator variables to identify those firm-years in which the auditor issued a modified audit opinion (MODOPINION), a going concern opinion (GCOPINION), or an adverse internal control opinion (ICWEAKNESS). The provision of nonaudit services could lead to lower audit fees due to efficiencies resulting from knowledge spillovers across audit and nonaudit staff. Alternatively, audit fees could increase with nonaudit services since auditors with greater monopoly in the nonaudit service market can extract higher fees from audit clients. We control for these opposing effects using the natural log of nonaudit fees (ln(NONAUDITFEES)).
Our final set of control variables proxy for auditor quality, auditor tenure, regulatory awareness, and auditor incentives with respect to large influential audit clients. We measure auditor quality using two variables: (1) the engagement of a Big 4 audit firm (BIG4) and (2) whether the audit firm is an industry specialist in the city where the client firm is headquartered (CITY_SPECIALIST). We code BIG4 as one if the audit firm is a Big 4 auditor and zero otherwise. We follow J. R. Francis et al. (2005) and measure CITY_SPECIALIST based on the audit firm's share of audit fees in each two-digit SIC industry for each city location. We code CITY_SPECIALIST as one if the audit firm has the highest percentage of fees in each city-specific industry grouping; zero otherwise. Our auditor tenure variables are measured as the square root of the number of years that the audit firm has been with the client (SQRT_TENURE). Consistent with DeFond et al. (2018) and Jha and Chen (2015), we capture the auditor's and client firm's awareness of regulatory enforcement using the client's geographical distance from the closest SEC regional office (SEC_DISTANCE). Last, we proxy for auditor incentives regarding influential clients using the ratio of the client's audit fees to the sum of all audit fees for all clients of the local city office each year (INFLUENCE; J. R. Francis and Yu 2009).
3.3.2 Restatement and Audit Error Models
3.3.3 Controlling for Endogeneity and Correlated Omitted Variables
We address endogeneity concerns by introducing entropy-balanced weights in our regression models. Entropy balancing reweights treatment and control samples to eliminate differences in observable characteristics between both groups (Hainmueller 2012). In our setting, we wish to eliminate differences in observable factors that explain variations in NOCLAR across firms. We follow McMullin and Schonberger (2020) and rely on our HIGH_CORRUPT variable as a sorting mechanism to separate our sample into “synthetic” treated and control groups based on the level of corruption or noncompliance risk. Specifically, we sort the sample by HIGH_CORRUPT and balance the characteristics of the two groups to the third moment (mean, median, and standard deviation) using a parsimonious set of covariates.10 We note that one drawback of entropy balancing is that it does not account for unobservable factors that might co-determine noncompliance risk and the audit process. We therefore include industry and time fixed effects in our models to control for omitted industry- and time-invariant factors.
4 Empirical Results
4.1 Evaluation of Corruption Measure
We assess the validity of our Google-based corruption measure before tackling our research questions. Since our measure is derived from an automated Internet script, we first utilize a research assistant as a third-party human rater to conduct manual checks of the Google search hits for a randomly selected set of firm-years in our sample. This validation method is consistent with the human-rater approach recommended by Bochkay et al. (2023) when evaluating the validity of text-based measures such as simple word counts or the counts of articles containing certain keywords.11 For this randomly selected set of firm-years, our human rater validated that the Google search hits recorded by our web “bot” closely match the document frequencies returned from manual Boolean searches over the same fiscal-year window. The human rater and a member of our research team then independently reviewed the documents listed within the top 10 search hits to evaluate whether the content is related to actual or perceived corruption or unethicality. While there is admittedly some noise in the search hits due to Google's document archival process, our manual checks indicate that the search script recorded an accurate count of document frequencies and provides meaningful sets of documents related to actual or alleged acts of corruption or noncompliance including contract violations, foreign bribery, and misleading marketing practices, among others. Appendix 2 provides specific examples for three firms from our random manual search.
Our next validation method uses data on firms’ NOCLAR to assess the extent to which our corruption measure is correlated with revealed illegal acts and serves as a leading indicator of such acts. We draw our set of noncompliance events from three data sources. Our first data source is the RepRisk Incidents database that tracks negative firm events across a broad set of national legislations and international standards covering business misconduct and ESG risks. These negative events are screened from media, online, and regulatory sources and cover issues such as labor violations, corruption, bribery, lobbying, and employee discrimination, as well as noncompliance with environmental and sustainability standards and laws. We use the RepRisk variables labeled “violation of national legislation” and “violation of international standards” to capture events that can be reasonably classified as illegal activities or acts of NOCLAR.
The second data source is the Audit Analytics Litigation Database that covers federal legal proceedings and federal securities class actions filed over our sample period. This dataset covers cases related to violations of over 100 federal laws and statutes such as anti-trust, commercial, labor, contract, and environmental laws as well as the FCPA and Racketeer Influenced and Corrupt Organizations (RICO) Acts. The dataset also provides coverage of litigation actions related to financial misrepresentations including SEC Accounting and Auditing Enforcement Releases (AAERs) and disclosure-related violations of the Securities Exchange Act. The Audit Analytics Litigation database provides very limited information on the periods over which the illegal acts occurred. Therefore, our analysis for the litigation actions drawn from this dataset is limited to the year in which the charge or action was filed against the firm. Our third data source is the Stanford Law FCPA Clearinghouse (FCPAC) that identifies foreign corruption as a specific illegal activity and provides data on the actual period(s) of the violation. We gather data on foreign corruption violations from the FCPAC and match our sample to the firm-years over which the violations occurred as reported in the enforcement documents.
Using these data sources, we create separate indicator variables to identify the following: (1) those firm-years with at least one compliance violation of national legislation and international standards as reported by RepRisk (ILLEGALACT_RR), (2) firm-years in which at least one federal litigation case is filed against the firm based on Audit Analytics (ILLEGALACT_AA), and (3) those firm-years during which violations of the FCPA occurred as reported in the FCPAC database. In unreported statistics, we find that roughly 8% of our sample firm-years have at least one noncompliance event per the RepRisk database, whereas a federal litigation case is filed in 21% of our firm-years according to Audit Analytics. This difference in noncompliance rates is likely an artifact of differences in firm coverage across the two datasets as RepRisk covers the largest 3000 firms in the United States based on market capitalization, whereas Audit Analytics archives a comprehensive set of litigation actions spanning a vast number of laws regardless of firm size. Our FCPAC dataset has the lowest match to our sample firm-years (1%), which is not surprising given the rarity of FCPA cases (Lawson et al. 2019).
We first conduct tests of the pair-wise correlations between these three indicator variables and our decile-ranked CORRUPT variable as well as the binary HIGH_CORRUPT variable. We also examine the correlations with our local corruption measure (LOCALCORRUPT) for completeness. Panel A of Table 1 reports these results. We find positive and significant correlations between the CORRUPT variable and the ILLEGALACT_RR, ILLEGALACT_AA, and ILLEGALACT_FCPA indicator variables (Pearson correlations = 0.02, 0.06, and 0.05, respectively; all significant at the 5% level or higher). We find similarly positive and significant correlations for the binary HIGH_CORRUPT variable. Interestingly, we note that the correlations are less than 10% indicating that common databases of business misconduct are capturing just the tip of the iceberg of corruption as a difficult-to-observe phenomenon. Moreover, the low correlations suggest that our Google-based measures are more likely to be capturing unobserved acts of corruption along with public perceptions of corporate illegality. We further find that the local corruption measure is negatively correlated with the noncompliance activities captured by RepRisk and Audit Analytics. This evidence suggests that local corruption proxies are likely to capture different aspects of noncompliance risks. We also find significant variation in the correlations between the three indicator variables. This result is not surprising given that each data source captures different events at varying times (e.g., Audit Analytics records the year of the enforcement action, whereas FCPAC records the violation years).
| Panel A: Pairwise correlation statistics | ||||||
|---|---|---|---|---|---|---|
| Variable | (1) | (2) | (3) | (4) | (5) | (6) |
| (1) CORRUPT | 1 | |||||
| (2) HIGH_CORRUPT | 0.95*** | 1 | ||||
| (3) LOCALCORRUPT | 0.03*** | 0.02** | 1 | |||
| (4) ILLEGALACT_RR | 0.02** | 0.02** | −0.01 | 1 | ||
| (5) ILLEGALACT_AA | 0.06*** | 0.07*** | −0.05*** | −0.00 | 1 | |
| (6) ILLEGALACT_FCPA | 0.05*** | 0.05*** | 0.02** | −0.02** | 0.06*** | 1 |
| Panel B: Logit regressions of predicting future illegal acts | |||||||||
|---|---|---|---|---|---|---|---|---|---|
| Dependent variable: ILLEGALACT_RRt+1 | Dependent variable: ILLEGALACT_AAt+1 | Dependent variable: ILLEGALACT_FCPAt+1 | |||||||
| CORRUPT | 0.1361 | 0.1798 | 1.0250 | ||||||
| (1.28) | (2.40)‡‡** | (2.58)‡‡** | |||||||
| HIGH_CORRUPT | 0.1272 | 0.1933 | 0.1879 | −0.0208 | 0.9266 | 0.2716 | |||
| (1.43) ‡ | (2.15) ‡‡** | (3.05)‡‡‡*** | (−0.31) | (2.72)‡‡‡*** | (0.45) | ||||
| Controls | Yes | Yes | Yes | Yes | Yes | Yes | Yes | Yes | Yes |
| Entropy-balanced weights | No | No | Yes | No | No | Yes | No | No | Yes |
| No. of firm-years | 14,404 | 14,404 | 14,404 | 11,238 | 11,238 | 11,238 | 14,404 | 14,404 | 14,404 |
| Pseudo-R2 | 0.001 | 0.002 | 0.002 | 0.011 | 0.012 | 0.007 | 0.118 | 0.120 | 0.098 |
- Note: Table 1 presents empirical evaluations of the Google document frequency variables, CORRUPT and HIGH_CORRUPT. Panel A presents pairwise correlation coefficients for the Google-based corruption measures (CORRUPT and HIGH_CORRUPT), the local corruption measure based on federal political convictions (LOCALCORRUPT), and three indicator variables for revealed illegal acts in the current firm-fiscal-year from three data sources: (1) the Audit Analytics Litigation database (ILLEGALACT_AA), (2) the RepRisk database (ILLEGALACT_RR), and (3) the Stanford Law School's FCPA Clearinghouse (ILLEGALACT_FCPA). Panel B presents logit regressions of predicting future illegal acts using the Google-based corruption measures. Each regression includes the number of business and geographical segments (SEGMENTS), the ratio of foreign sales to total sales (FOREIGN), and the level of cash holdings scaled by total assets (CASH_RATIO) as control variables. Robust standard errors clustered by firm are presented in parentheses. Variable definitions are included in Appendix 1.
- ‡, ‡‡, and ‡‡‡ denote one-tailed significance at the 10%, 5%, and 1% levels, respectively.
- *, **, and *** denote two-tailed significance at the 10%, 5%, and 1% levels, respectively.
Last, our Google corruption measures are two to three times more strongly correlated with the ILLEGALACT_AA and ILLEGALACT_FCPA variables, compared to the ILLEGALACT_RR variable (difference in correlations are significant at the 5% level or higher). These differences likely reflect the fact that the Audit Analytics and FCPAC databases comprise actual federal violations, whereas the RepRisk data cover a broader set of business conduct that might not be illegal despite being financially and reputationally risky for the firm and its stakeholders. Put differently, the RepRisk data carry more measurement error in identifying noncompliance activities. Nonetheless, the strong correlations between our Google measures and all three ILLEGALACT variables indicate that our document-frequency approach performs well in capturing revealed noncompliant behaviors.
Next, we perform logit regressions to determine if our Google-based measures in year t are predictive of NOCLAR in the subsequent year t + 1. We control for common predictors of illegal behaviors such as firm size (SIZE), foreign operations (FOREIGN), the level of cash holdings (CASH_RATIO), the number of business and geographic segments (SEGMENTS), and operating in corrupt environments (LOCALCORRUPT).12 We also present separate results after incorporating our entropy-balanced weights to remove observable differences in firm characteristics. The results reported in Panel B of Table 1 show positive associations between the decile-ranked CORRUPT variable and each of the three ILLEGALACT variables in year t + 1. The coefficients are significant at the 5% level and higher using one-tailed and two-tailed tests for the ILLEGALACT_AA and ILLEGALACT_FCPA variables. We find similar results for the HIGH_CORRUPT indicator variable, with the results being robust to applying entropy-balanced weights when predicting noncompliance events based on the RepRisk database. Taken together, our evaluation methods suggest that our Google document-frequency approach provides a reasonably valid construct of noncompliance at the firm level.
4.2 Descriptive Evidence
We now turn our attention to the primary variables of interest for our regression analyses. Table 2 presents summary statistics for firms that rank high on our Corruption measure (HIGH_CORRUPT = 1) and those that rank lower on the measure (HIGH_CORRUPT = 0). Panel A presents statistics for our primary dependent and independent variables, and Panel B presents statistics for our control variables. In Panel A, we find that firms with high noncompliance risks are charged higher audit fees (AUDITFEES) and are more likely to operate in corrupt regions (LOCALCORRUPT). These results provide preliminary evidence that auditors adjust their audit inputs and price the audit higher when client corruption risks are higher. However, despite this potential audit adjustment, we observe that firms with high corruption risks are more likely to restate their financials in a subsequent period (RESTATE), compared to firms that rank lower on our corruption proxy. Thus, it appears that the execution of the audit does not fully adjust for corruption risks. Our audit error variable (ERROR) is significantly lower for firms with high noncompliance risks, consistent with our preliminary inference that auditors adjust their audit effort and procedures in response to client corruption. However, in unreported tests, we find a higher rate of Type II errors in the high corruption subsample, coupled with a lower rate of Type I errors. Thus, auditors’ adjustments for corruption risks might not be as efficient as at first glance.
| Low corruption (HIGH_CORRUPT = 0) | High corruption (HIGH_CORRUPT = 1) | Tests of differences | |||||||||||
|---|---|---|---|---|---|---|---|---|---|---|---|---|---|
| Variable | Mean | Std. dev. | 25th | Median | 75th | Mean | Std. dev. | 25th | Median | 75th | Difference in means | t-statistic | Wilcoxon z-statistic |
| Panel A: Primary variables | |||||||||||||
| LOCALCORRUPT | 0.420 | 0.494 | 0.000 | 0.000 | 1.000 | 0.440 | 0.496 | 0.000 | 0.000 | 1.000 | 0.020 | (2.40)** | (2.40)** |
| AUDITFEES | 13.229 | 1.308 | 12.336 | 13.353 | 14.123 | 13.939 | 1.203 | 13.159 | 13.972 | 14.734 | 0.710 | (33.50)*** | (30.80)*** |
| RESTATE | 0.087 | 0.282 | 0.000 | 0.000 | 0.000 | 0.102 | 0.302 | 0.000 | 0.000 | 0.000 | 0.015 | (3.05)*** | (3.06)*** |
| ERROR | 0.462 | 0.647 | 0.000 | 0.000 | 1.000 | 0.405 | 0.664 | 0.000 | 0.000 | 1.000 | −0.057 | (−5.14)*** | (−7.38)*** |
| Panel B: Control variables | |||||||||||||
|---|---|---|---|---|---|---|---|---|---|---|---|---|---|
| ASSETS | 5.185 | 2.351 | 3.698 | 5.385 | 6.814 | 6.611 | 2.032 | 5.206 | 6.659 | 8.045 | 1.426 | (37.61)*** | (34.35)*** |
| CASH_RATIO | 0.185 | 0.194 | 0.043 | 0.123 | 0.256 | 0.146 | 0.154 | 0.037 | 0.101 | 0.198 | −0.039 | (−12.88)*** | (−9.99)*** |
| SEC_DISTANCE | 3.861 | 1.550 | 2.879 | 3.680 | 5.384 | 4.009 | 1.575 | 2.939 | 3.867 | 5.452 | 0.148 | (5.58)*** | (5.73)*** |
| NONAUDITFEES | 9.248 | 4.623 | 8.780 | 10.781 | 12.244 | 10.578 | 4.221 | 10.116 | 11.775 | 13.103 | 1.330 | (17.50)*** | (23.08)*** |
| AUDITDELAY | 4.659 | 0.287 | 4.500 | 4.644 | 4.779 | 4.583 | 0.249 | 4.431 | 4.575 | 4.736 | −0.076 | (−16.35)*** | (−17.02)*** |
| GCOPINION | 0.112 | 0.316 | 0.000 | 0.000 | 0.000 | 0.019 | 0.135 | 0.000 | 0.000 | 0.000 | −0.094 | (−21.29)*** | (−20.97)*** |
| MODOPINION | 0.301 | 0.459 | 0.000 | 0.000 | 1.000 | 0.213 | 0.409 | 0.000 | 0.000 | 0.000 | −0.088 | (−11.82)*** | (−11.77)*** |
| ICWEAKNESS | 0.027 | 0.163 | 0.000 | 0.000 | 0.000 | 0.022 | 0.146 | 0.000 | 0.000 | 0.000 | −0.006 | (−2.15)** | (−2.15)** |
| NATSECIND | 0.419 | 0.493 | 0.000 | 0.000 | 1.000 | 0.328 | 0.470 | 0.000 | 0.000 | 1.000 | −0.091 | (−11.03)*** | (−10.98)*** |
| SEGMENTS | 1.710 | 0.521 | 1.099 | 1.609 | 2.079 | 1.902 | 0.531 | 1.609 | 1.946 | 2.303 | 0.192 | (21.47)*** | (21.58)*** |
| BIG4 | 0.574 | 0.495 | 0.000 | 1.000 | 1.000 | 0.752 | 0.432 | 1.000 | 1.000 | 1.000 | 0.178 | (22.29)*** | (21.91)*** |
| CITY_SPECIALIST | 0.264 | 0.441 | 0.000 | 0.000 | 1.000 | 0.345 | 0.475 | 0.000 | 0.000 | 1.000 | 0.081 | (10.45)*** | (10.41)*** |
| INFLUENCE | 0.180 | 0.262 | 0.022 | 0.067 | 0.200 | 0.164 | 0.233 | 0.026 | 0.071 | 0.181 | −0.015 | (−3.61)*** | (−1.29) |
| AGE | 32.512 | 14.893 | 22.000 | 30.000 | 40.000 | 37.421 | 17.361 | 25.000 | 34.000 | 49.000 | 4.909 | (18.12)*** | (16.36)*** |
| BUSYSEASON | 0.674 | 0.469 | 0.000 | 1.000 | 1.000 | 0.667 | 0.471 | 0.000 | 1.000 | 1.000 | −0.007 | (−0.78) | (−0.79) |
| RESTRUCT | 0.285 | 0.452 | 0.000 | 0.000 | 1.000 | 0.355 | 0.478 | 0.000 | 0.000 | 1.000 | 0.069 | (8.79)*** | (8.76)*** |
| FOREIGN | 0.235 | 0.322 | 0.000 | 0.023 | 0.426 | 0.278 | 0.324 | 0.000 | 0.137 | 0.489 | 0.042 | (7.73)*** | (10.56)*** |
| COMPLEX_EST | 0.365 | 0.248 | 0.165 | 0.333 | 0.529 | 0.361 | 0.224 | 0.185 | 0.336 | 0.500 | −0.004 | (−0.97) | (−0.71) |
| ALTMANZ | 0.457 | 0.336 | 0.111 | 0.444 | 0.778 | 0.565 | 0.281 | 0.333 | 0.556 | 0.778 | 0.108 | (20.10)*** | (19.82)*** |
| BOOK_MKT | 0.404 | 1.510 | 0.209 | 0.475 | 0.861 | 0.560 | 0.703 | 0.269 | 0.475 | 0.773 | 0.156 | (7.33)*** | (1.58) |
| LEVERAGE | 0.899 | 3.856 | 0.227 | 0.661 | 1.467 | 1.304 | 3.287 | 0.412 | 0.852 | 1.690 | 0.405 | (6.54)*** | (14.03)*** |
| SQRT_EMPLOYEE | 1.378 | 1.759 | 0.336 | 0.781 | 1.741 | 2.436 | 2.694 | 0.723 | 1.580 | 3.098 | 1.059 | (28.53)*** | (33.76)*** |
| STD_ROA | 0.237 | 0.583 | 0.030 | 0.077 | 0.180 | 0.085 | 0.206 | 0.020 | 0.041 | 0.093 | −0.152 | (−18.95)*** | (−27.01)*** |
| SQRT_TENURE | 2.457 | 0.802 | 1.732 | 2.646 | 3.162 | 2.721 | 0.787 | 2.236 | 3.000 | 3.317 | 0.264 | (19.46)*** | (19.89)*** |
| LOSSHISTORY | 0.622 | 0.485 | 0.000 | 1.000 | 1.000 | 0.419 | 0.493 | 0.000 | 0.000 | 1.000 | −0.203 | (−24.43)*** | (−23.94)*** |
| ISSUANCE | 0.851 | 0.356 | 1.000 | 1.000 | 1.000 | 0.914 | 0.280 | 1.000 | 1.000 | 1.000 | 0.063 | (11.33)*** | (11.28)*** |
| LITRISK | 0.404 | 0.491 | 0.000 | 0.000 | 1.000 | 0.344 | 0.475 | 0.000 | 0.000 | 1.000 | −0.060 | (−7.36)*** | (−7.35)*** |
| OPCYCLE | 0.100 | 0.172 | 0.027 | 0.038 | 0.082 | 0.095 | 0.157 | 0.029 | 0.040 | 0.074 | −0.005 | (−1.61)* | (−3.74)*** |
| CHG_RECV | 0.002 | 0.058 | −0.015 | 0.001 | 0.021 | 0.007 | 0.044 | −0.007 | 0.004 | 0.022 | 0.005 | (6.05)*** | (7.12)*** |
| CHG_INV | 0.001 | 0.039 | −0.004 | 0.000 | 0.010 | 0.005 | 0.034 | −0.002 | 0.000 | 0.013 | 0.004 | (5.44)*** | (6.25)*** |
| SOFT_ASSETS | 0.531 | 0.256 | 0.334 | 0.555 | 0.744 | 0.554 | 0.236 | 0.383 | 0.581 | 0.744 | 0.023 | (5.55)*** | (4.76)*** |
| CHG_CASHSALES | 0.096 | 0.530 | −0.090 | 0.039 | 0.178 | 0.089 | 0.351 | −0.037 | 0.055 | 0.162 | −0.007 | (−0.82) | (−5.50)*** |
| CHG_ROA | −0.010 | 0.324 | −0.060 | −0.003 | 0.041 | −0.001 | 0.146 | −0.030 | 0.000 | 0.025 | 0.009 | (1.85)** | (3.19)*** |
| CHG_EMPLOYEE | −0.030 | 0.345 | −0.120 | −0.011 | 0.101 | −0.036 | 0.267 | −0.102 | −0.022 | 0.058 | 0.006 | (1.05) | (4.62)*** |
| OPLEASE | 0.860 | 0.347 | 1.000 | 1.000 | 1.000 | 0.896 | 0.305 | 1.000 | 1.000 | 1.000 | 0.036 | (6.48)*** | (6.47)*** |
The descriptive statistics for our control variables (see Panel B) indicate that firms with high corruption risks have less cash holdings, consistent with the evidence in Smith (2016). Interestingly, we find that high corruption firms are less likely to receive going concern or modified audit opinions or adverse internal control opinions, despite having higher restatement rates as observed in Panel A. This evidence is further indicative of inefficiencies in auditors’ adjustments for noncompliance risks. A similar conclusion could be drawn from our finding of lower values for AUDITDELAY (a proxy for audit effort) in the high corruption subsample. That is, it appears that auditors are not efficient in adjusting the audit for high-corruption firms.13 Last, Table 3 presents pairwise correlation statistics for our primary variables and several key control variables. Consistent with our evidence in Table 2, we find that audit fees and the likelihood of restatement increase with our Google-based corruption measures.
| Variable | (1) | (2) | (3) | (4) | (5) | (6) | (7) | (8) | (9) | (10) | (11) |
|---|---|---|---|---|---|---|---|---|---|---|---|
| (1) CORRUPT | 1 | ||||||||||
| (2) HIGH_CORRUPT | 0.95*** | 1 | |||||||||
| (3) LOCALCORRUPT | 0.03*** | 0.02** | 1 | ||||||||
| (4) AUDITFEES | 0.28*** | 0.26*** | 0.08*** | 1 | |||||||
| (5) RESTATE | 0.02*** | 0.03*** | 0.00 | 0.01 | 1 | ||||||
| (6) ERROR | −0.05*** | −0.04*** | −0.00 | 0.01 | 0.75*** | 1 | |||||
| (7) CASH_RATIO | −0.11*** | −0.11*** | −0.09*** | −0.23*** | −0.01 | −0.02** | 1 | ||||
| (8) NATSECIND | −0.10*** | −0.09*** | −0.09*** | −0.07*** | −0.03*** | −0.01 | 0.30*** | 1 | |||
| (9) SEC_DISTANCE | −0.05*** | −0.04*** | 0.07*** | 0.03*** | −0.02** | −0.00 | 0.14*** | 0.16*** | 1 | ||
| (10) AUDITDELAY | −0.27*** | −0.26*** | −0.03*** | −0.63*** | 0.02* | 0.08*** | 0.10*** | 0.05*** | 0.06*** | 1 | |
| (11) ICWEAKNESS | −0.02*** | −0.02** | −0.01 | 0.06*** | 0.02** | 0.14*** | −0.01 | −0.00 | 0.01 | 0.09*** | 1 |
4.3 Regression Results
4.3.1 Effect of Client Corruption Risk on Audit Inputs
If auditors appropriately assess perceived and actual corruption or noncompliance risk in their overall risk assessment for their client, we expect that auditors would increase audit inputs resulting in a positive association between corruption and audit fees. Table 4 reports the ordinary least squares (OLS) regression results for Equation (2). Column 1 presents results using the decile-ranked CORRUPT measure, while Columns 2 and 3 present results for the binary HIGH_CORRUPT measure before and after incorporating the entropy balancing weights. Columns 4 through 6 present re-estimated results while controlling for regional corruption culture (LOCALCORRUPT). The dependent variable, AUDITFEES, is the natural log of audit fees. Following Picconi and Reynolds (2013), we estimate the regressions by year and size deciles to adjust for biased estimates when using logarithmic transformations for both the dependent variable and the control variable for firm size (SIZE).
| Dependent variable = AUDITFEES | ||||||
|---|---|---|---|---|---|---|
| Variable | (1) | (2) | (3) | (4) | (5) | (6) |
| CORRUPT | 0.0278 | 0.0293 | ||||
| (1.87)* | (1.92)* | |||||
| HIGH_CORRUPT | 0.0220 | 0.0240 | 0.0245 | 0.0254 | ||
| (2.00)** | (1.70)* | (2.10)** | (1.79)* | |||
| LOCALCORRUPT | 0.0645 | 0.0639 | 0.0674 | |||
| (4.43)*** | (4.39)*** | (4.22)*** | ||||
| SIZE | 0.3633 | 0.3631 | 0.3776 | 0.3626 | 0.3625 | 0.3759 |
| (18.49)*** | (18.50)*** | (17.92)*** | (17.34)*** | (17.34)*** | (16.78)*** | |
| CASH_RATIO | 0.2882 | 0.2877 | 0.2716 | 0.2993 | 0.2990 | 0.2813 |
| (6.29)*** | (6.27)*** | (5.38)*** | (5.88)*** | (5.87)*** | (5.02)*** | |
| SEC_DISTANCE | 0.1317 | 0.1321 | 0.1400 | 0.1167 | 0.1172 | 0.1255 |
| (8.13)*** | (8.17)*** | (7.51)*** | (5.42)*** | (5.45)*** | (6.12)*** | |
| NATSECIND | 0.0047 | 0.0048 | −0.0026 | −0.0067 | −0.0066 | −0.0089 |
| (0.30) | (0.31) | (−0.13) | (−0.37) | (−0.36) | (−0.41) | |
| NONAUDITFEES | 0.0097 | 0.0097 | 0.0105 | 0.0086 | 0.0086 | 0.0094 |
| (4.56)*** | (4.56)*** | (4.90)*** | (4.05)*** | (4.05)*** | (4.37)*** | |
| AUDITDELAY | 0.1143 | 0.1163 | 0.1179 | 0.1173 | 0.1193 | 0.1273 |
| (3.94)*** | (4.03)*** | (3.94)*** | (3.65)*** | (3.74)*** | (3.49)*** | |
| GCOPINION | 0.0487 | 0.0510 | 0.0485 | 0.0676 | 0.0701 | 0.0637 |
| (0.89) | (0.93) | (0.82) | (0.99) | (1.03) | (0.90) | |
| MODOPINION | 0.0444 | 0.0446 | 0.0418 | 0.0414 | 0.0412 | 0.0431 |
| (1.55) | (1.56) | (1.21) | (1.12) | (1.11) | (1.02) | |
| ICWEAKNESS | 0.2611 | 0.2610 | 0.2396 | 0.2215 | 0.2217 | 0.2946 |
| (6.79)*** | (6.80)*** | (7.77)*** | (7.21)*** | (7.24)*** | (4.03)*** | |
| SEGMENTS | 0.1698 | 0.1696 | 0.1723 | 0.1589 | 0.1588 | 0.1621 |
| (6.14)*** | (6.12)*** | (6.02)*** | (4.70)*** | (4.69)*** | (4.98)*** | |
| BIG4 | 0.3910 | 0.3907 | 0.4345 | 0.3908 | 0.3900 | 0.4072 |
| (7.32)*** | (7.32)*** | (8.20)*** | (7.39)*** | (7.39)*** | (8.60)*** | |
| CITY_SPECIALIST | 0.0587 | 0.0588 | 0.0550 | 0.0525 | 0.0524 | 0.0502 |
| (2.34)** | (2.34)** | (2.03)** | (1.79)* | (1.79)* | (1.64) | |
| INFLUENCE | 0.1809 | 0.1815 | 0.1910 | 0.1904 | 0.1910 | 0.2021 |
| (5.69)*** | (5.72)*** | (5.89)*** | (5.35)*** | (5.38)*** | (5.76)*** | |
| AGE | 0.0008 | 0.0008 | 0.0010 | 0.0008 | 0.0008 | 0.0011 |
| (1.22) | (1.25) | (1.45) | (1.20) | (1.22) | (1.49) | |
| BUSYSEASON | 0.0340 | 0.0345 | 0.0200 | 0.0259 | 0.0265 | 0.0142 |
| (2.96)*** | (3.02)*** | (1.50) | (2.27)** | (2.33)** | (1.10) | |
| RESTRUCT | 0.1300 | 0.1288 | 0.1414 | 0.2032 | 0.2022 | 0.1436 |
| (3.28)*** | (3.27)*** | (3.71)*** | (2.45)** | (2.44)** | (3.61)*** | |
| FOREIGN | 0.1310 | 0.1306 | 0.1403 | 0.1438 | 0.1432 | 0.1534 |
| (3.54)*** | (3.54)*** | (3.76)*** | (3.54)*** | (3.53)*** | (3.94)*** | |
| COMPLEX_EST | 0.0992 | 0.1000 | 0.0797 | 0.0985 | 0.0992 | 0.0759 |
| (3.09)*** | (3.12)*** | (2.25)** | (2.81)*** | (2.84)*** | (1.89)* | |
| ALTMANZ | −0.4290 | −0.4289 | −0.3261 | −0.4642 | −0.4637 | −0.3896 |
| (−3.90)*** | (−3.90)*** | (−3.82)*** | (−2.70)*** | (−2.70)*** | (−3.04)*** | |
| BOOK_MKT | −0.0119 | −0.0113 | −0.0182 | −0.0113 | −0.0108 | −0.0179 |
| (−1.81)* | (−1.71)* | (−2.76)*** | (−1.60) | (−1.51) | (−2.55)** | |
| LEVERAGE | −0.0001 | −0.0001 | 0.0003 | −0.0006 | −0.0006 | −0.0000 |
| (−0.04) | (−0.05) | (0.14) | (−0.25) | (−0.26) | (−0.01) | |
| SQRT_EMPLOYEE | 0.5847 | 0.5828 | 0.5747 | 0.6391 | 0.6382 | 0.6382 |
| (2.81)*** | (2.80)*** | (2.74)*** | (2.48)** | (2.48)** | (2.56)** | |
| STD_ROA | −0.0525 | −0.0494 | −0.0714 | −0.0632 | −0.0600 | −0.0798 |
| (−1.10) | (−1.06) | (−1.43) | (−1.29) | (−1.26) | (−1.59) | |
| SQRT_TENURE | 0.0118 | 0.0124 | 0.0006 | 0.0114 | 0.0121 | 0.0025 |
| (1.24) | (1.30) | (0.06) | (1.16) | (1.22) | (0.25) | |
| LOSSHISTORY | 0.0895 | 0.0893 | 0.0888 | 0.0917 | 0.0917 | 0.0931 |
| (3.41)*** | (3.40)*** | (3.12)*** | (3.04)*** | (3.04)*** | (2.91)*** | |
| ISSUANCE | 0.0437 | 0.0437 | 0.0494 | 0.0487 | 0.0485 | 0.0555 |
| (2.44)** | (2.43)** | (2.33)** | (2.60)** | (2.59)** | (2.56)** | |
| LITRISK | −0.0299 | −0.0293 | −0.0215 | −0.0208 | −0.0203 | −0.0121 |
| (−1.40) | (−1.38) | (−1.04) | (−0.87) | (−0.85) | (−0.52) | |
| Constant | 9.4926 | 9.4985 | 9.4220 | 9.4996 | 9.5145 | 9.3491 |
| (56.00)*** | (55.82)*** | (52.43)*** | (49.42)*** | (50.23)*** | (43.39)*** | |
| Industry fixed effects | Yes | Yes | Yes | Yes | Yes | Yes |
| Entropy-balanced weights | No | No | Yes | No | No | Yes |
| No. of firm-years | 14,404 | 14,404 | 14,404 | 14,404 | 14,404 | 14,404 |
| Average R2 | 0.53 | 0.53 | 0.56 | 0.53 | 0.53 | 0.57 |
- Note: Table 4 presents annual size-decile regressions of the association between client corruption risks and audit fees. Columns 1 and 2 (Columns 4 and 5) present the average coefficient estimates from the year and size decile regressions for our main variables of interest, CORRUPT and HIGH_CORRUPT, before (after) controlling for local corruption risks (LOCALCORRUPT). Column 3 (Column 6) presents results for HIGH_CORRUPT after incorporating entropy-balanced weights and before (after) controlling for LOCAL CORRUPT. All regressions include industry fixed effects. The t-statistics are in parentheses and are computed based on robust standard errors of the coefficient estimates. Variable definitions are included in Appendix 1.
- *, **, and *** denote two-tailed significance at the 10%, 5%, and 1% levels, respectively.
In Column 1, we observe a positive and significant coefficient on CORRUPT (0.0278, p < 0.10), which provides support for the conjecture that auditors adjust their audit inputs in response to client corruption risk. For clients with high corruption risk (HIGH_CORRUPT), the association remains positive and significant in Column 2 (0.0220, p < 0.05) and is robust to controlling for potential endogeneity effects as reported in column 3 (0.0240, p < 0.10). The results in Columns 4 through 6 indicate that the association between audit fees and our firm-specific corruption measure is not attributable to corruption norms in the client's local environment. Specifically, we find that both the CORRUPT (0.0293, p < 0.10) and HIGH_CORRUPT (0.0245, p < 0.05) variables remain positive and significant when accounting for the client's local corruption environment.14 To gauge the economic significance of our results, we note that the coefficient on CORRUPT in Column 1 represents an approximately 3% increase in audit fees when a firm moves from the lowest decile of our Google corruption measure to the highest decile.15 This impact of client corruption risk on audit pricing is non-trivial. The results for our controls variables are consistent with prior literature with SIZE, AUDITDELAY, SEGMENTS, BIG4, CITY_SPECIALIST, BUSYSEASON, RESTRUCT, FOREIGN, and COMPLEX_EST having a positive and significant association with audit fees. We find an insignificant association between NATSECIND and AUDITFEES, indicating that neither the demand- nor supply-side effect of managerial governance dominates our sample.
Overall, our results provide support for our prediction that corruption is associated with higher audit fees. Although this finding is consistent with concurrent research (Lawson et al. 2019), our findings capture corruption risk at a broader level given that our Google document-frequency measures proxies for perceived and actual corruption. As we will show in later tests, our results remain strong when we account for revealed noncompliance events using our ILLEGALACT variables (see Section 4.3.6). Further, our findings provide stronger evidence of ex ante consideration of corruption prior to an actual fine or enforcement actions. That is, our inferences are not restricted to the actual revelation of corrupt behavior in the form of FCPA violations or AAER enforcement actions, which are rare events among public firms (Bao et al. 2020; Brown et al. 2020). Indeed, as reported earlier, foreign corruption violations occur in only 1% of our sample. Last, unlike prior evidence, our results show that client-specific corruption risk is an important audit factor, even after controlling for regional corruption norms.
4.3.2 Unexplained Audit Fees as a Proxy for Audit Effort
As discussed earlier, the fee charged by auditors to their clients comprises of two components: (1) the production costs of the audit process and the effort expended by the auditor for audit testing and other procedures, and (2) a fee premium for accepting a higher level of audit risk. While our results in Table 4 are in line with greater production inputs in the audit process as client corruption risks increase, it is possible that our results primarily reflect increases in the fee premium charged to corrupt clients. To disentangle this alternative explanation, we follow prior research and use the unexplained portion of the audit fee charged to clients as a proxy for unobserved audit effort. As documented in Hribar et al. (2014) and Doogar et al. (2015), the portion of audit fees that is not explained by standard determinants of audit complexity and client risk captures unobserved audit effort that is persistent and idiosyncratic to the audit engagement. Following these studies, we first estimate the residual portion of firms’ audit fees (RESID_AUDITFEES) by estimating year and size decile regressions of Equation (2) while excluding our Google-based and regional corruption measures. Excluding these measures from the model will allow us to observe whether the unexplained portion of audit fees contains information about the unobserved audit costs associated with client corruption risks. To observe this relation, we estimate year and size decile regressions of firms’ residual audit fees on our corruption measures. Consistent with Hribar et al. (2014), we control for firm size (SIZE) and accounting quality as proxied by the absolute value of firms’ discretionary accruals estimated using the Kothari et al. (2005) performance-adjusted abnormal accruals model (ABS_DACC).
Table 5 presents the results for the residual audit fee regressions. Column 1 presents stand-alone results for the decile-ranked CORRUPT variable, while Columns 2 and 3 present results for the binary HIGH_CORRUPT measure before and after incorporating entropy-balanced weights. Columns 4 through 6 present re-estimated results after incorporating the regional corruption measure and our control variables. We find that our Google-based measures of client corruption risks are positive and significantly associated with unexplained audit fees across all the regressions in Table 5. This evidence thus indicates that the audit fee increases in response to client corruption risks are attributable to increased audit effort as opposed to additional fee premiums.
| Dependent variable = RESID_AUDITFEES | ||||||
|---|---|---|---|---|---|---|
| Variable | (1) | (2) | (3) | (4) | (5) | (6) |
| CORRUPT | 0.0279 | 0.0341 | ||||
| (2.14)** | (1.80)* | |||||
| HIGH_CORRUPT | 0.0277 | 0.0328 | 0.0318 | 0.0348 | ||
| (2.14)** | (2.09)** | (1.85)* | (1.80)* | |||
| LOCAL_CORRUPT | 0.0419 | 0.0418 | 0.0572 | |||
| (4.17)*** | (4.14)*** | (4.88)*** | ||||
| ABS_DACC | −0.0143 | −0.0142 | −0.0213 | |||
| (−0.79) | (−0.79) | (−1.13) | ||||
| SIZE | −0.0230 | −0.0231 | −0.0100 | |||
| (−1.18) | (−1.19) | (−0.53) | ||||
| Constant | −0.0436 | −0.0370 | −0.0936 | −0.0791 | −0.1178 | −0.0619 |
| (−0.78) | (−0.64) | (−1.72)* | (−0.60) | (−0.92) | (−0.52) | |
| Industry fixed effects | Yes | Yes | Yes | Yes | Yes | Yes |
| Entropy-balanced weights | No | No | Yes | No | No | Yes |
| No. of firm-years | 14,404 | 14,404 | 14,404 | 14,404 | 14,404 | 14,404 |
| Average R2 | 0.052 | 0.053 | 0.072 | 0.072 | 0.072 | 0.089 |
- Note: Table 5 presents annual size-decile regressions of the association between client corruption risks and unexplained residual audit fees (RESID_AUDITFEES). We compute RESID_AUDITFEES by estimating annual size decile regressions of our audit fee variable (AUDITFEES) on all the determinants in Equation (2) except for our Google-based corruption and local corruption measures. We then generate the residuals from this model for each firm-size-year observation. Columns 1 to 3 present results from the regressions of unexplained audit fees on our Google-based corruption variables. Columns 4 to 6 introduce controls for local political corruption (LOCAL_CORRUPT), firm size (SIZE), and the absolute values of firms’ performance-adjusted discretionary accruals (ABS_DACC) as a proxy for accounting quality. All regressions include industry fixed effects. The regressions in Columns 3 and 6 include entropy balancing weights. The t-statistics are in parentheses and are computed based on robust standard errors of the coefficient estimates. Variable definitions are included in Appendix 1.
- *, **, and *** denote two-tailed significance at the 10%, 5%, and 1% levels, respectively.
4.3.3 Effect of Client Corruption Risk on Audit Quality
The results of the previous sections discuss the auditor's response in incorporating corruption risk into audit inputs and the related pricing. However, to understand the effect of perceived and actual corruption on the auditor performance, we examine the likelihood of financial statement restatements and the likelihood of audit reporting errors. Table 6 summarizes the results of the logistic regression of Equation (3) with RESTATE as the dependent variable. Our estimation sample reduces to 10,945 firm-years due to missing data for our additional financial reporting risk controls. Columns 1 and 2 show a positive and significant coefficient on CORRUPT (0.2538, p < 0.05) and HIGH_CORRUPT (0.2244, p < 0.01). When adding LOCALCORRUPT to the regressions in Columns 4 and 5, the coefficients on CORRUPT and HIGH_CORRUPT are economically similar and remain positive and significant (0.2552, p < 0.05 and 0.2354, p < 0.001, respectively). The coefficients on LOCALCORRUPT in Columns 4 and 5 are not significant. Thus, while the higher audit fees charged to firms with high client-specific corruption risks do not result in audit procedures that adequately mitigate misstatement risk, this seems to be the case for firms operating in corrupt localities. Once again, the entropy-balanced results in Columns 3 and 6 indicate further robustness of our inferences.
| Dependent variable: RESTATE | ||||||
|---|---|---|---|---|---|---|
| Variable | (1) | (2) | (3) | (4) | (5) | (6) |
| CORRUPT | 0.2538 | 0.2552 | ||||
| (2.54)** | (2.55)** | |||||
| HIGH_CORRUPT | 0.2344 | 0.2430 | 0.2354 | 0.2445 | ||
| (2.85)*** | (2.84)*** | (2.86)*** | (2.85)*** | |||
| LOCALCORRUPT | 0.1066 | 0.1065 | 0.1353 | |||
| (1.21) | (1.21) | (1.37) | ||||
| SIZE | −0.0032 | −0.0038 | −0.0406 | −0.0022 | −0.0028 | −0.0386 |
| (−0.06) | (−0.07) | (−0.64) | (−0.04) | (−0.06) | (−0.62) | |
| CASH_RATIO | 0.2227 | 0.2242 | 0.1155 | 0.2375 | 0.2389 | 0.1427 |
| (0.67) | (0.68) | (0.31) | (0.72) | (0.72) | (0.38) | |
| SEC_DISTANCE | −0.1645 | −0.1667 | −0.0975 | −0.1776 | −0.1796 | −0.1144 |
| (−1.73)* | (−1.75)* | (−0.92) | (−1.83)* | (−1.86)* | (−1.05) | |
| NATSECIND | −0.2458 | −0.2468 | −0.2822 | −0.2489 | −0.2499 | −0.2861 |
| (−1.77)* | (−1.78)* | (−1.74)* | (−1.80)* | (−1.80)* | (−1.77)* | |
| ICWEAKNESS | 0.3183 | 0.3149 | 0.3229 | 0.3219 | 0.3185 | 0.3246 |
| (1.70)* | (1.68)* | (1.63) | (1.73)* | (1.70)* | (1.64) | |
| SEGMENTS | 0.2074 | 0.2083 | 0.2439 | 0.2057 | 0.2066 | 0.2419 |
| (2.10)** | (2.12)** | (2.28)** | (2.08)** | (2.10)** | (2.26)** | |
| BIG4 | 0.0524 | 0.0531 | 0.1035 | 0.0539 | 0.0546 | 0.1076 |
| (0.36) | (0.37) | (0.64) | (0.37) | (0.38) | (0.66) | |
| CITY_SPECIALIST | 0.0012 | 0.0034 | 0.0107 | 0.0053 | 0.0075 | 0.0163 |
| (0.01) | (0.04) | (0.10) | (0.06) | (0.08) | (0.16) | |
| INFLUENCE | −0.3057 | −0.3041 | −0.2827 | −0.3046 | −0.3029 | −0.2805 |
| (−1.86)* | (−1.85)* | (−1.54) | (−1.86)* | (−1.85)* | (−1.53) | |
| AGE | 0.0028 | 0.0029 | 0.0015 | 0.0027 | 0.0027 | 0.0014 |
| (0.90) | (0.91) | (0.45) | (0.84) | (0.85) | (0.40) | |
| BUSYSEASON | 0.0878 | 0.0904 | 0.1114 | 0.0800 | 0.0826 | 0.1020 |
| (0.94) | (0.97) | (1.08) | (0.86) | (0.89) | (1.00) | |
| RESTRUCT | −0.0940 | −0.0933 | −0.0972 | −0.0941 | −0.0933 | −0.0970 |
| (−0.98) | (−0.97) | (−0.96) | (−0.98) | (−0.97) | (−0.96) | |
| FOREIGN | 0.0606 | 0.0616 | 0.1827 | 0.0716 | 0.0726 | 0.1929 |
| (0.39) | (0.40) | (1.09) | (0.46) | (0.47) | (1.14) | |
| COMPLEX_EST | 0.2115 | 0.2105 | 0.3601 | 0.2302 | 0.2292 | 0.3926 |
| (0.93) | (0.93) | (1.41) | (1.02) | (1.01) | (1.53) | |
| ALTMANZ | −0.1348 | −0.1361 | −0.2676 | −0.1464 | −0.1477 | −0.2873 |
| (−0.84) | (−0.85) | (−1.49) | (−0.91) | (−0.92) | (−1.59) | |
| BOOK_MKT | 0.0506 | 0.0501 | 0.0588 | 0.0508 | 0.0503 | 0.0600 |
| (1.49) | (1.48) | (1.42) | (1.50) | (1.48) | (1.45) | |
| LEVERAGE | 0.0012 | 0.0011 | −0.0030 | 0.0009 | 0.0008 | −0.0035 |
| (0.12) | (0.10) | (−0.25) | (0.08) | (0.07) | (−0.30) | |
| SQRT_EMPLOYEE | −0.0174 | −0.0182 | −0.0088 | −0.0186 | −0.0193 | −0.0103 |
| (−0.33) | (−0.35) | (−0.16) | (−0.36) | (−0.37) | (−0.19) | |
| STD_ROA | −0.0588 | −0.0595 | −0.2241 | −0.0578 | −0.0587 | −0.2253 |
| (−0.45) | (−0.46) | (−1.29) | (−0.45) | (−0.45) | (−1.30) | |
| SQRT_TENURE | −0.1083 | −0.1082 | −0.0975 | −0.1131 | −0.1129 | −0.1057 |
| (−1.80)* | (−1.80)* | (−1.48) | (−1.88)* | (−1.88)* | (−1.61) | |
| LOSSHISTORY | 0.0894 | 0.0909 | 0.0538 | 0.0918 | 0.0934 | 0.0568 |
| (0.95) | (0.97) | (0.53) | (0.98) | (0.99) | (0.57) | |
| ISSUANCE | 0.0800 | 0.0807 | −0.0247 | 0.0870 | 0.0878 | −0.0155 |
| (0.63) | (0.64) | (−0.18) | (0.68) | (0.69) | (−0.11) | |
| LITRISK | −0.0396 | −0.0399 | −0.0276 | −0.0259 | −0.0261 | −0.0051 |
| (−0.26) | (−0.26) | (−0.16) | (−0.17) | (−0.17) | (−0.03) | |
| OPCYCLE | 0.1736 | 0.1700 | −0.0343 | 0.1748 | 0.1715 | −0.0289 |
| (0.66) | (0.64) | (−0.11) | (0.66) | (0.65) | (−0.09) | |
| CHG_RECV | 0.6484 | 0.6460 | 0.3001 | 0.6548 | 0.6526 | 0.3014 |
| (0.86) | (0.86) | (0.38) | (0.87) | (0.87) | (0.38) | |
| CHG_INV | −0.6029 | −0.5954 | −1.0508 | −0.6034 | −0.5961 | −1.0610 |
| (−0.71) | (−0.70) | (−1.09) | (−0.71) | (−0.71) | (−1.10) | |
| SOFT_ASSETS | 0.4041 | 0.4003 | 0.4213 | 0.4063 | 0.4024 | 0.4289 |
| (1.73)* | (1.71)* | (1.63) | (1.73)* | (1.72)* | (1.65)* | |
| CHG_CASHSALES | 0.0005 | 0.0012 | 0.0502 | 0.0026 | 0.0033 | 0.0528 |
| (0.01) | (0.01) | (0.51) | (0.03) | (0.04) | (0.54) | |
| CHG_ROA | 0.0450 | 0.0445 | −0.2235 | 0.0428 | 0.0422 | −0.2261 |
| (0.26) | (0.26) | (−0.97) | (0.25) | (0.24) | (−0.98) | |
| CHG_EMPLOYEE | 0.0734 | 0.0746 | 0.0441 | 0.0740 | 0.0753 | 0.0450 |
| (0.57) | (0.58) | (0.30) | (0.57) | (0.58) | (0.31) | |
| OPLEASE | −0.2810 | −0.2803 | −0.2759 | −0.2847 | −0.2841 | −0.2847 |
| (−2.19)** | (−2.19)** | (−1.82)* | (−2.22)** | (−2.21)** | (−1.87)* | |
| Constant | −2.0200 | −2.0306 | −2.0938 | −2.0357 | −2.0470 | −2.1175 |
| (−2.47)** | (−2.49)** | (−2.38)** | (−2.52)** | (−2.54)** | (−2.45)** | |
| Industry fixed effects | Yes | Yes | Yes | Yes | Yes | Yes |
| Year fixed effects | Yes | Yes | Yes | Yes | Yes | Yes |
| Entropy-balanced weights | No | No | Yes | No | No | Yes |
| No. of firm-years | 10,945 | 10,945 | 10,945 | 10,945 | 10,945 | 10,945 |
| Pseudo-R2 | 0.029 | 0.030 | 0.036 | 0.030 | 0.030 | 0.036 |
- Note: Table 6 presents logistic regressions of the association between client corruption risks and the likelihood that the financial statements for the current fiscal year are restated in a future period. Columns 1 and 2 (Columns 4 and 5) present results for our main variables of interest, CORRUPT and HIGH_CORRUPT, before (after) controlling for local corruption risks (LOCALCORRUPT). Column 3 (Column 6) presents results for HIGH_CORRUPT after incorporating entropy-balanced weights and before (after) controlling for LOCAL CORRUPT. All regressions include industry and year fixed effects. Robust z-statistics adjusted for firm clusters are presented in parentheses. Variable definitions are included in Appendix 1. *, **, and *** denote two-tailed significance at the 10%, 5%, and 1% levels, respectively.
Last, the control variables across the six regressions are largely consistent with prior literature. For instance, we find that the likelihood of restatements is higher for firms with internal control weaknesses (ICWEAKNESS) and those with more complex operations (SEGMENTS) and a larger proportion of soft assets (SOFT_ASSETS). We also find that the likelihood of restatements is lower for firms operating in national security industries with weaker takeover pressures (NATSECIND). Consistent with the supply-side effects of managerial monitoring, the result could reflect stronger audit inputs and in turn greater audit quality when takeover monitoring is weaker.
Taken together, the results in Table 5 suggest that, although auditors appropriately price corruption or noncompliance risk, there remains a disconnect from pricing to executing procedures that mitigate client financial statement impropriety. Moreover, this disconnect is most pervasive when executing procedures to mitigate client-specific corruption risk as opposed to regional-based corruption risk. This evidence stands in sharp contrast to prior research suggesting that auditors adequately adjust for client corruption risks solely based on regional corruption proxies (Jha et al. 2021) and illustrates the importance of using client-specific measures when studying the audit implications of risks associated with NOCLAR.
Table 7 summarizes the multinomial logistic regressions of our categorical variable, ERROR, and the association with client corruption. Panel A presents the estimated results for the model before accounting for local corruption risks (LOCALCORRUPT); Panel B presents results after incorporating the local corruption variable. The coefficients on CORRUPT and HIGH_CORRUPT in Panel A are negative and significant in Columns 1 and 3, indicating a lower likelihood of Type I errors as client corruption risk increases. While the statistical significance of this result is not robust to entropy balancing, the coefficient in Column 5 remains negative. Thus, the evidence provides some inference that audit decision errors improve with client corruption risk. Of note, this evidence is consistent with the inferences from our tests of total and unexplained audit fees and corroborates the argument that auditors expend more effort when client corruption risks increase. That is, the relation between auditors’ Type I errors and client corruption risks is unlikely to be negative if the audit fee increases we observe are due solely to fee premium charges.
| Panel A: Regression results before controlling for local corruption | ||||||
|---|---|---|---|---|---|---|
| Dependent variable = ERROR | ||||||
| (1) | (2) | (3) | (4) | (5) | (6) | |
| Variable | Type I | Type II | Type I | Type II | Type I | Type II |
| CORRUPT | −0.2367 | 0.1891 | ||||
| (−2.91)*** | (1.81)* | |||||
| HIGH_CORRUPT | −0.1522 | 0.1925 | −0.0644 | 0.2235 | ||
| (−2.29)** | (2.25)** | (−0.93) | (2.53)** | |||
| SIZE | −0.0323 | −0.0132 | −0.0334 | −0.0141 | 0.0674 | −0.0229 |
| (−0.92) | (−0.25) | (−0.96) | (−0.27) | (1.77)* | (−0.36) | |
| CASH_RATIO | −0.4118 | 0.0778 | −0.4136 | 0.0783 | 0.1445 | 0.1683 |
| (−1.39) | (0.23) | (−1.40) | (0.23) | (0.42) | (0.44) | |
| SEC_DISTANCE | 0.0131 | −0.1613 | 0.0156 | −0.1631 | 0.0379 | −0.0872 |
| (0.18) | (−1.66)* | (0.21) | (−1.68)* | (0.48) | (−0.81) | |
| NATSECIND | −0.2520 | −0.3068 | −0.2485 | −0.3072 | −0.2707 | −0.3397 |
| (−2.34)** | (−2.19)** | (−2.30)** | (−2.19)** | (−2.23)** | (−2.08)** | |
| SEGMENTS | 0.2082 | 0.2764 | 0.2011 | 0.2754 | 0.2392 | 0.3214 |
| (2.39)** | (2.73)*** | (2.31)** | (2.73)*** | (2.58)*** | (2.94)*** | |
| BIG4 | 0.9199 | 0.2928 | 0.9179 | 0.2932 | 0.7645 | 0.2881 |
| (7.62)*** | (1.95)* | (7.61)*** | (1.96)* | (5.97)*** | (1.74)* | |
| CITY_SPECIALIST | 0.0153 | 0.0018 | 0.0146 | 0.0035 | −0.0438 | −0.0056 |
| (0.22) | (0.02) | (0.21) | (0.04) | (−0.57) | (−0.05) | |
| INFLUENCE | 0.2402 | −0.2147 | 0.2364 | −0.2141 | 0.1482 | −0.2055 |
| (1.84)* | (−1.27) | (1.81)* | (−1.26) | (1.03) | (−1.09) | |
| AGE | −0.0023 | 0.0021 | −0.0023 | 0.0022 | −0.0009 | 0.0011 |
| (−0.96) | (0.66) | (−0.99) | (0.68) | (−0.35) | (0.32) | |
| BUSYSEASON | −0.2252 | 0.0329 | −0.2261 | 0.0351 | −0.2695 | 0.0433 |
| (−2.96)*** | (0.34) | (−2.97)*** | (0.36) | (−3.21)*** | (0.41) | |
| RESTRUCT | 0.0458 | −0.0666 | 0.0457 | −0.0660 | 0.0490 | −0.0658 |
| (0.64) | (−0.68) | (0.64) | (−0.67) | (0.63) | (−0.63) | |
| FOREIGN | 0.1932 | 0.1381 | 0.1954 | 0.1401 | 0.0333 | 0.2056 |
| (1.41) | (0.88) | (1.43) | (0.89) | (0.22) | (1.21) | |
| COMPLEX_EST | −0.5162 | 0.0760 | −0.5124 | 0.0760 | −0.4236 | 0.2498 |
| (−2.57)** | (0.33) | (−2.55)** | (0.33) | (−1.85)* | (0.95) | |
| ALTMANZ | −0.8218 | −0.3215 | −0.8275 | −0.3243 | −0.7186 | −0.4263 |
| (−5.87)*** | (−1.92)* | (−5.91)*** | (−1.93)* | (−4.53)*** | (−2.26)** | |
| BOOK_MKT | −0.1933 | −0.0358 | −0.1934 | −0.0363 | −0.1740 | −0.0139 |
| (−6.39)*** | (−0.92) | (−6.40)*** | (−0.93) | (−5.33)*** | (−0.32) | |
| LEVERAGE | 0.0049 | 0.0015 | 0.0051 | 0.0014 | 0.0113 | −0.0007 |
| (0.60) | (0.14) | (0.62) | (0.13) | (1.22) | (−0.06) | |
| SQRT_EMPLOYEE | 0.0383 | −0.0102 | 0.0377 | −0.0110 | 0.0095 | −0.0075 |
| (1.85)* | (−0.19) | (1.82)* | (−0.21) | (0.41) | (−0.14) | |
| STD_ROA | 0.7200 | 0.3327 | 0.7219 | 0.3330 | 0.3096 | −0.0879 |
| (4.53)*** | (1.88)* | (4.54)*** | (1.87)* | (1.31) | (−0.42) | |
| SQRT_TENURE | −0.1593 | −0.1518 | −0.1603 | −0.1519 | −0.1260 | −0.1357 |
| (−3.15)*** | (−2.43)** | (−3.17)*** | (−2.43)** | (−2.20)** | (−1.99)** | |
| LOSSHISTORY | 0.1210 | 0.1018 | 0.1219 | 0.1037 | 0.1356 | 0.0806 |
| (1.55) | (1.04) | (1.56) | (1.06) | (1.51) | (0.77) | |
| ISSUANCE | 0.0289 | 0.0594 | 0.0270 | 0.0592 | 0.0384 | −0.0451 |
| (0.28) | (0.46) | (0.26) | (0.46) | (0.33) | (−0.33) | |
| LITRISK | 0.2644 | 0.0105 | 0.2645 | 0.0107 | 0.2274 | 0.0128 |
| (2.08)** | (0.07) | (2.08)** | (0.07) | (1.60) | (0.07) | |
| OPCYCLE | −0.2872 | 0.0917 | −0.2914 | 0.0885 | −0.2681 | −0.1068 |
| (−1.17) | (0.33) | (−1.19) | (0.32) | (−0.99) | (−0.34) | |
| CHG_RECV | −0.2811 | 0.4410 | −0.2889 | 0.4334 | 0.4822 | 0.3859 |
| (−0.55) | (0.59) | (−0.56) | (0.58) | (0.73) | (0.48) | |
| CHG_INV | −2.2286 | −1.1289 | −2.2377 | −1.1233 | −0.9469 | −1.0877 |
| (−3.23)*** | (−1.30) | (−3.25)*** | (−1.29) | (−1.15) | (−1.09) | |
| SOFT_ASSETS | 0.4957 | 0.5425 | 0.5009 | 0.5402 | 0.3402 | 0.4956 |
| (2.30)** | (2.24)** | (2.33)** | (2.23)** | (1.41) | (1.87)* | |
| CHG_CASHSALES | −0.0986 | −0.0319 | −0.0977 | −0.0311 | −0.1333 | 0.0173 |
| (−1.30) | (−0.35) | (−1.29) | (−0.34) | (−1.41) | (0.17) | |
| CHG_ROA | −0.5263 | −0.2152 | −0.5273 | −0.2155 | −0.7144 | −0.4994 |
| (−4.68)*** | (−1.22) | (−4.68)*** | (−1.22) | (−3.73)*** | (−2.03)** | |
| CHG_EMPLOYEE | −0.0143 | 0.0899 | −0.0159 | 0.0905 | 0.0496 | 0.0794 |
| (−0.15) | (0.68) | (−0.17) | (0.68) | (0.42) | (0.53) | |
| OPLEASE | −0.2441 | −0.3552 | −0.2440 | −0.3545 | −0.1058 | −0.3101 |
| (−2.10)** | (−2.64)*** | (−2.10)** | (−2.64)*** | (−0.69) | (−2.04)** | |
| Constant | −0.0860 | −1.1684 | −0.0661 | −1.1740 | −0.6420 | −1.2717 |
| (−0.11) | (−1.43) | (−0.09) | (−1.43) | (−0.73) | (−1.47) | |
| Industry fixed effects | Yes | Yes | Yes | Yes | Yes | Yes |
| Year fixed effects | Yes | Yes | Yes | Yes | Yes | Yes |
| Entropy-balanced weights | No | No | No | No | Yes | Yes |
| No. of firm-years | 10,945 | 10,945 | 10,945 | 10,945 | 10,945 | 10,945 |
| Pseudo-R2 | 0.14 | 0.14 | 0.16 | |||
| Panel B: Regression results after controlling for local corruption | ||||||
|---|---|---|---|---|---|---|
| Dependent variable = ERROR | ||||||
| (1) | (2) | (3) | (4) | (5) | (6) | |
| Variable | Type I | Type II | Type I | Type II | Type I | Type II |
| CORRUPT | −0.2380 | 0.1905 | ||||
| (−2.92)*** | (1.83)* | |||||
| HIGH_CORRUPT | −0.1535 | 0.1935 | −0.0655 | 0.2250 | ||
| (−2.31)** | (2.26)** | (−0.95) | (2.55)** | |||
| LOCALCORRUPT | −0.0323 | −0.0123 | −0.0333 | −0.0131 | 0.0674 | −0.0208 |
| (−0.92) | (−0.24) | (−0.95) | (−0.25) | (1.77)* | (−0.33) | |
| SIZE | −0.4138 | 0.0915 | −0.4157 | 0.0920 | 0.1405 | 0.1941 |
| (−1.40) | (0.27) | (−1.41) | (0.27) | (0.41) | (0.50) | |
| CASH_RATIO | 0.0187 | −0.1728 | 0.0212 | −0.1745 | 0.0434 | −0.1026 |
| (0.25) | (−1.75)* | (0.28) | (−1.77)* | (0.54) | (−0.93) | |
| SEC_DISTANCE | −0.0484 | 0.0934 | −0.0482 | 0.0934 | −0.0510 | 0.1225 |
| (−0.67) | (1.03) | (−0.66) | (1.03) | (−0.66) | (1.22) | |
| NATSECIND | −0.2510 | −0.3096 | −0.2473 | −0.3100 | −0.2697 | −0.3436 |
| (−2.33)** | (−2.22)** | (−2.29)** | (−2.22)** | (−2.22)** | (−2.12)** | |
| SEGMENTS | 0.2084 | 0.2748 | 0.2014 | 0.2738 | 0.2391 | 0.3195 |
| (2.39)** | (2.71)*** | (2.31)** | (2.71)*** | (2.57)** | (2.92)*** | |
| BIG4 | 0.9189 | 0.2940 | 0.9170 | 0.2944 | 0.7621 | 0.2917 |
| (7.61)*** | (1.96)** | (7.59)*** | (1.96)** | (5.95)*** | (1.76)* | |
| CITY_SPECIALIST | 0.0136 | 0.0051 | 0.0129 | 0.0069 | −0.0459 | −0.0010 |
| (0.19) | (0.05) | (0.18) | (0.07) | (−0.60) | (−0.01) | |
| INFLUENCE | 0.2392 | −0.2138 | 0.2354 | −0.2132 | 0.1458 | −0.2037 |
| (1.83)* | (−1.27) | (1.80)* | (−1.26) | (1.01) | (−1.09) | |
| AGE | −0.0022 | 0.0020 | −0.0023 | 0.0020 | −0.0008 | 0.0010 |
| (−0.93) | (0.62) | (−0.96) | (0.63) | (−0.32) | (0.28) | |
| BUSYSEASON | −0.2211 | 0.0263 | −0.2221 | 0.0284 | −0.2652 | 0.0351 |
| (−2.91)*** | (0.27) | (−2.92)*** | (0.30) | (−3.16)*** | (0.33) | |
| RESTRUCT | 0.0459 | −0.0667 | 0.0458 | −0.0659 | 0.0490 | −0.0656 |
| (0.65) | (−0.68) | (0.65) | (−0.67) | (0.63) | (−0.63) | |
| FOREIGN | 0.1885 | 0.1476 | 0.1908 | 0.1497 | 0.0309 | 0.2144 |
| (1.38) | (0.93) | (1.39) | (0.94) | (0.21) | (1.26) | |
| COMPLEX_EST | −0.5247 | 0.0927 | −0.5209 | 0.0927 | −0.4363 | 0.2801 |
| (−2.60)*** | (0.40) | (−2.58)*** | (0.40) | (−1.89)* | (1.07) | |
| ALTMANZ | −0.8177 | −0.3317 | −0.8233 | −0.3345 | −0.7145 | −0.4445 |
| (−5.82)*** | (−1.97)** | (−5.86)*** | (−1.99)** | (−4.49)*** | (−2.35)** | |
| BOOK_MKT | −0.1934 | −0.0355 | −0.1935 | −0.0360 | −0.1743 | −0.0128 |
| (−6.39)*** | (−0.91) | (−6.40)*** | (−0.93) | (−5.33)*** | (−0.29) | |
| LEVERAGE | 0.0050 | 0.0012 | 0.0051 | 0.0011 | 0.0113 | −0.0012 |
| (0.61) | (0.11) | (0.62) | (0.10) | (1.22) | (−0.09) | |
| SQRT_EMPLOYEE | 0.0385 | −0.0113 | 0.0379 | −0.0121 | 0.0096 | −0.0089 |
| (1.86)* | (−0.21) | (1.83)* | (−0.23) | (0.41) | (−0.16) | |
| STD_ROA | 0.7201 | 0.3325 | 0.7220 | 0.3327 | 0.3105 | −0.0884 |
| (4.53)*** | (1.88)* | (4.54)*** | (1.87)* | (1.31) | (−0.42) | |
| SQRT_TENURE | −0.1574 | −0.1558 | −0.1583 | −0.1560 | −0.1230 | −0.1431 |
| (−3.10)*** | (−2.50)** | (−3.12)*** | (−2.50)** | (−2.15)** | (−2.10)** | |
| LOSSHISTORY | 0.1201 | 0.1040 | 0.1211 | 0.1060 | 0.1346 | 0.0831 |
| (1.54) | (1.07) | (1.56) | (1.09) | (1.50) | (0.80) | |
| ISSUANCE | 0.0270 | 0.0651 | 0.0251 | 0.0650 | 0.0361 | −0.0376 |
| (0.26) | (0.50) | (0.24) | (0.50) | (0.31) | (−0.27) | |
| LITRISK | 0.2568 | 0.0228 | 0.2569 | 0.0231 | 0.2180 | 0.0338 |
| (2.01)** | (0.15) | (2.01)** | (0.15) | (1.53) | (0.19) | |
| OPCYCLE | −0.2888 | 0.0922 | −0.2929 | 0.0893 | −0.2727 | −0.1023 |
| (−1.17) | (0.34) | (−1.19) | (0.33) | (−1.00) | (−0.32) | |
| CHG_RECV | −0.2828 | 0.4449 | −0.2905 | 0.4376 | 0.4841 | 0.3849 |
| (−0.55) | (0.59) | (−0.57) | (0.58) | (0.73) | (0.48) | |
| CHG_INV | −2.2301 | −1.1287 | −2.2392 | −1.1233 | −0.9410 | −1.0963 |
| (−3.23)*** | (−1.30) | (−3.24)*** | (−1.30) | (−1.14) | (−1.10) | |
| SOFT_ASSETS | 0.4982 | 0.5446 | 0.5033 | 0.5423 | 0.3422 | 0.5030 |
| (2.31)** | (2.24)** | (2.34)** | (2.23)** | (1.42) | (1.89)* | |
| CHG_CASHSALES | −0.0999 | −0.0299 | −0.0990 | −0.0292 | −0.1342 | 0.0196 |
| (−1.31) | (−0.33) | (−1.30) | (−0.32) | (−1.42) | (0.19) | |
| CHG_ROA | −0.5253 | −0.2175 | −0.5263 | −0.2180 | −0.7145 | −0.5025 |
| (−4.66)*** | (−1.23) | (−4.67)*** | (−1.23) | (−3.73)*** | (−2.04)** | |
| CHG_EMPLOYEE | −0.0142 | 0.0905 | −0.0158 | 0.0911 | 0.0494 | 0.0805 |
| (−0.15) | (0.68) | (−0.16) | (0.69) | (0.42) | (0.54) | |
| OPLEASE | −0.2419 | −0.3581 | −0.2419 | −0.3574 | −0.1007 | −0.3177 |
| (−2.08)** | (−2.66)*** | (−2.08)** | (−2.65)*** | (−0.66) | (−2.08)** | |
| Constant | −0.0874 | −1.1817 | −0.0677 | −1.1878 | −0.6425 | −1.2937 |
| (−0.11) | (−1.46) | (−0.09) | (−1.47) | (−0.73) | (−1.51) | |
| Industry fixed effects | Yes | Yes | Yes | Yes | Yes | Yes |
| Year fixed effects | Yes | Yes | Yes | Yes | Yes | Yes |
| Entropy-balanced weights | No | No | No | No | Yes | Yes |
| No. of firm-years | 10,945 | 10,945 | 10,945 | 10,945 | 10,945 | 10,945 |
| Pseudo-R2 | 0.14 | 0.14 | 0.16 | |||
- Note: Table 7 presents the multinomial logistic regressions of the association between client corruption risk and Type I and Type II audit decision errors. Panel A shows regression results before controlling for local corruption risks. Panel A, Columns 1 (Type I) and 2 (Type II) present results for CORRUPT, and Columns 3 (Type I) and 4 (Type II) present results for HIGH_CORRUPT. Panel B shows regression results after controlling for local corruption risks. Panel B, Columns 1 (Type I) and 2 (Type II) present results for CORRUPT, and Columns 3 (Type I) and 4 (Type II) present results for HIGH_CORRUPT. Columns 5 (Type I) and 6 (Type II) in each panel present results for HIGH_CORRUPT when estimated using entropy-balanced weights. All regressions include industry and year fixed effects. Robust z-statistics adjusted for firm clusters are presented in parentheses. Variable definitions are included in Appendix 1.
- *, **, and *** denote two-tailed significance at the 10%, 5%, and 1% levels, respectively.
Alternatively, for Type II errors, Columns 2 and 4 report positive and significant coefficients on CORRUPT (0.1891, p < 0.10) and HIGH_CORRUPT (0.1925, p < 0.05), indicating that, despite the adjustment in audit effort and in turn audit fees, auditors are not effective in identifying material financial reporting and internal control problems for clients with high corruption risks. This result is strongly robust to endogeneity controls as reported in Column 6. Knechel and Vanstraelen (2007) argue that auditor Type II errors can be more costly to capital market participants given the sharp decline in stock valuations when undetected financial reporting problems are publicly revealed. Thus, our results indicate that auditors’ inefficient adjustment for noncompliance risks can lead to significant capital market losses.
In Panel B, we find similar results when we account for local corruption risks. The coefficients on LOCALCORRUPT are all insignificant and again suggest that auditors are at least effective in adjusting their audit inputs for firms operating in corrupt localities. The results for our control variables in both panels are consistent with prior literature and suggest that audit quality improves with audit tenure (SQRT_TENURE) and financial reporting risk factors such as off-balance-sheet financing (OPLEASE) and changes in financial performance (CHG_ROA). However, audit errors are more frequent when firms have complex operations (SEGMENTS), more volatile earnings streams (STD_ROA), and more soft assets (SOFT_ASSETS). Last, the negative coefficient on NATSECIND for both Type I and Type II errors again suggests that supply-side effects are at play as evidenced by higher quality audits for firms with weaker takeover monitoring.
Taken together, our empirical tests of audit quality show that the auditor's initial assessment of noncompliance risk, as proxied by our document-frequency measures, might not be fully reflected in the execution of the audit plan. This is an area that can benefit from enhanced guidance from the PCAOB as they deliberate auditors’ responsibilities regarding client noncompliance with applicable laws and regulations.
4.3.4 The Cross-Sectional Effect of Client Cash Holdings
Prior research suggests that firms alter their cash holdings to deter rent-seeking and expropriation from corrupting influences (Smith 2016). This research also argues that firms that benefit from corrupt practices might maintain higher cash balances to position themselves to take bribing opportunities. Together, these arguments suggest that cash holdings are positively associated with a client's exposure to corruption risks. We therefore assess whether auditors’ response to client corruption risks increases with cash liquidity and whether this response is appropriate in terms of audit quality.
To conduct this analysis, we re-estimate our empirical results after interacting our corruption variables with CASH_RATIO, the level of cash holdings scaled by total assets. Table 8 presents the re-estimated results for our audit fee (Panel A), financial restatement (Panel B), and audit error models (Panel C). We conduct both one-tailed and two-tailed significance tests for the CASH_RATIO interaction term since we expect audit production inputs in response to corrupttion risks to increase with client's cash liquidity. For brevity, we tabulate the re-estimated audit error results for only the models that control for local corruption risks (LOCALCORRUPT; see initial results in Panel B of Table 6). In Panel A, we find a positive and significant coefficient on the CASH_RATIO×CORRUPT interaction term (0.245, two-tailed p < 0.05). This coefficient remains significantly positive after accounting for the client's local corruption environment. These results suggest that auditors adjust their audit inputs and price the audit higher when clients with higher corruption risks hold larger cash balances. The coefficients on the interaction of CASH_RATIO with the HIGH_CORRUPT variable, though weaker, are positive and significant at the one-tailed level (p < 0.09) when controlling for local corruption. In untabulated results, we find that the cross-sectional effect of clients’ cash holdings on audit fees is even stronger when we examine unexplained audit fees as a proxy for unobserved audit costs.16 This result corroborates our inference that auditors adjust their audit production inputs when corrupt clients hold larger cash balances.
| Panel A: Annual size-decile regressions of audit fees | ||||||
|---|---|---|---|---|---|---|
| Dependent variable = AUDITFEES | ||||||
| Variable | (1) | (2) | (3) | (4) | (5) | (6) |
| CORRUPT | 0.0162 | 0.0201 | ||||
| (0.46) | (0.57) | |||||
| HIGH_CORRUPT | 0.0410 | 0.0354 | 0.0351 | 0.0416 | ||
| (0.89) | (0.95) | (0.92) | (0.98) | |||
| CASH_RATIO×CORRUPT | 0.2175 | 0.2103 | ||||
| (2.34)‡‡‡** | (2.27)‡‡‡** | |||||
| CASH_RATIO×HIGH_CORRUPT | 0.0997 | 0.1042 | 0.1155 | 0.0926 | ||
| (1.00) | (1.17) | (1.34)‡ | (0.97) | |||
| LOCALCORRUPT | 0.0648 | 0.0641 | 0.0682 | |||
| (4.45)*** | (4.42)*** | (4.27)*** | ||||
| CASH_RATIO | 0.1867 | 0.2102 | 0.2047 | 0.2004 | 0.2230 | 0.2167 |
| (3.97)*** | (4.55)*** | (3.88)*** | (3.89)*** | (4.39)*** | (3.75)*** | |
| Constant | 9.4493 | 9.4662 | 9.4158 | 9.4654 | 9.4711 | 9.3477 |
| (54.45)*** | (54.02)*** | (52.73)*** | (48.28)*** | (48.13)*** | (43.49)*** | |
| Industry fixed effects | Yes | Yes | Yes | Yes | Yes | Yes |
| Entropy-balanced weights | No | No | Yes | No | No | Yes |
| No. of firm-years | 14,404 | 14,404 | 14,404 | 14,404 | 14,404 | 14,404 |
| Average R2 | 0.53 | 0.53 | 0.56 | 0.53 | 0.53 | 0.57 |
| Panel B: Logistic regressions of financial restatements | ||||||
|---|---|---|---|---|---|---|
| Dependent variable = RESTATE | ||||||
| (1) | (2) | (3) | (4) | (5) | (6) | |
| CORRUPT | 0.2914 | 0.2935 | ||||
| (2.17)** | (2.19)** | |||||
| HIGH_CORRUPT | 0.2857 | 0.2768 | 0.2870 | 0.2791 | ||
| (2.56)** | (2.35)** | (2.58)*** | (2.37)** | |||
| CASH_RATIO×CORRUPT | −0.2579 | −0.2627 | ||||
| (−0.43) | (−0.44) | |||||
| CASH_RATIO×HIGH_CORRUPT | −0.3597 | −0.2625 | −0.3621 | −0.2678 | ||
| (−0.71) | (−0.49) | (−0.72) | (−0.50) | |||
| LOCALCORRUPT | 0.1068 | 0.1068 | 0.1355 | |||
| (1.21) | (1.21) | (1.37) | ||||
| CASH_RATIO | 0.3008 | 0.3486 | 0.2582 | 0.3172 | 0.3646 | 0.2887 |
| (0.79) | (0.92) | (0.59) | (0.83) | (0.96) | (0.65) | |
| Constant | −2.0341 | −2.0542 | −2.1085 | −2.0502 | −2.0707 | −2.1326 |
| (−2.48)** | (−2.51)** | (−2.40)** | (−2.53)** | (−2.56)** | (−2.46)** | |
| Industry fixed effects | Yes | Yes | Yes | Yes | Yes | Yes |
| Year fixed effects | Yes | Yes | Yes | Yes | Yes | Yes |
| Entropy-balanced weights | No | No | Yes | No | No | Yes |
| No. of firm-years | 14,404 | 14,404 | 14,404 | 14,404 | 14,404 | 14,404 |
| Pseudo-R2 | 0.03 | 0.03 | 0.04 | 0.03 | 0.03 | 0.04 |
| Panel C: Multinomial logistic regressions of audit decision errors controlling for local corruption | ||||||
|---|---|---|---|---|---|---|
| Dependent variable = ERROR | ||||||
| (1) | (2) | (3) | (4) | (5) | (6) | |
| Type I | Type II | Type 1 | Type II | Type I | Type II | |
| CORRUPT | −0.2818 | 0.2027 | ||||
| (−2.62)*** | (1.46) | |||||
| HIGH_CORRUPT | −0.1805 | 0.2286 | −0.1034 | 0.2443 | ||
| (−2.05)** | (1.98)** | (−1.10) | (2.01)** | |||
| CASH_RATIO×CORRUPT | 0.3105 | −0.0874 | ||||
| (0.62) | (−0.14) | |||||
| CASH_RATIO×HIGH_CORRUPT | 0.1974 | −0.2483 | 0.2947 | −0.1541 | ||
| (0.45) | (−0.48) | (0.63) | (−0.28) | |||
| LOCALCORRUPT | −0.0487 | 0.0934 | −0.0483 | 0.0935 | −0.0516 | 0.1225 |
| (−0.67) | (1.03) | (−0.67) | (1.03) | (−0.67) | (1.22) | |
| CASH_RATIO | −0.4841 | 0.1183 | −0.4649 | 0.1785 | 0.0115 | 0.2790 |
| (−1.50) | (0.30) | (−1.45) | (0.46) | (0.03) | (0.62) | |
| Constant | −0.0712 | −1.1874 | −0.0547 | −1.2054 | −0.6251 | −1.3022 |
| (−0.09) | (−1.46) | (−0.07) | (−1.48) | (−0.72) | (−1.52) | |
| Industry fixed effects | Yes | Yes | Yes | Yes | Yes | Yes |
| Year fixed effects | Yes | Yes | Yes | Yes | Yes | Yes |
| Entropy-balanced weights | No | No | No | No | Yes | Yes |
| No. of firm-years | 14,404 | 14,404 | 14,404 | 14,404 | 14,404 | 14,404 |
| Pseudo-R2 | 0.14 | 0.14 | 0.16 | |||
- Note: Table 8 presents cross-sectional results based on firms’ cash holdings as a percentage of total assets (CASH_RATIO). Panels A and B present results for our audit fee and financial restatement regressions, respectively. Column 1 (Column 4) in Panels A and B includes results for the CORRUPT and CASH_RATIO×CORRUPT variables before (after) controlling for LOCALCORRUPT. Column 2 (Column 5) in Panels A and B includes results for the HIGH_CORRUPT and CASH_RATIO×HIGH_CORRUPT variables before (after) controlling for LOCALCORRUPT. Column 3 (Column 6) in Panels A and B present results for the HIGH_CORRUPT and CASH_RATIO×HIGH_CORRUPT variables when estimated using entropy-balanced weights and before (after) controlling for LOCALCORRUPT. Panel C presents the multinomial logistic regression results for audit decision errors. For brevity, Panel C reports results for CORRUPT and HIGH_CORRUPT and the related interaction variables while controlling for local corruption risks (LOCALCORRUPT) for Type I (Columns 1 and 3) and Type II (Columns 2 and 4) errors. Columns 5 and 6 in Panel C present results for the HIGH_CORRUPT and CASH_RATIO×HIGH_CORRUPT variables when estimated using entropy-balanced weights and controlling for LOCALCORRUPT. All regressions include the respective control variables. The audit fee regressions in columns (1) to (3) of Panel A are estimated by year and size decile and include only industry and year fixed effects. All other regressions in Panels A and B include both industry and year fixed effects. Robust z-statistics adjusted for firm clusters are presented in parentheses. Variable definitions are included in Appendix 1.
- ‡, ‡‡, and ‡‡‡ denote one-tailed significance at the 10%, 5%, and 1% levels, and *, ** and *** denote two-tailed significance at the 10%, 5%, and 1% levels, respectively.
Turning to the restatement regressions in Panel B, we find negative coefficients on the interactions between CASH_RATIO and our corruption measures. However, the statistical significance is not within conventional levels at either the one-tailed or two-tailed levels. Thus, it appears that the higher audit fees we observe in Panel A do not affect the restatement likelihood of corrupt firms with larger cash holdings. We find similar insignificant interactions in Panel C, suggesting no change in auditors’ error rates when corrupt firms hold larger cash balances.
4.3.5 The Cross-Sectional Effect of Weak Takeover Pressures
We next examine whether takeover pressures as a form of corporate governance attenuate auditors’ response to client corruption risks. Table 9 repeats our regression results after interacting our Google corruption measures with the NATSECIND variable that identifies firms operating in industries with weaker foreign takeover threats. Our audit fee results in Panel A indicate that auditors charge significantly higher audit fees when clients exhibit higher noncompliance risks and face less takeover monitoring. This inference holds when we examine unexplained audit fees in untabulated tests. In Panels B and C, we find that the interaction terms on NATSECIND and our corruption variables are negative and economically large. The statistical significance is however not within conventional levels. Thus, the higher audit fees charged to firms with higher corruption risks and weak takeover pressures do not seem to significantly improve the efficiency of the audit.
| Panel A: Annual size-decile regressions of audit fees | ||||||
|---|---|---|---|---|---|---|
| Dependent variable = AUDITFEES | ||||||
| Variable | (1) | (2) | (3) | (4) | (5) | (6) |
| CORRUPT | 0.0224 | 0.0266 | ||||
| (0.74) | (0.84) | |||||
| HIGH_CORRUPT | 0.0045 | 0.0123 | 0.0076 | 0.0137 | ||
| (0.32) | (0.77) | (0.53) | (0.86) | |||
| NATSECIND×CORRUPT | 0.0404 | 0.0350 | ||||
| (1.25) | (1.08) | |||||
| NATSECIND×HIGH_CORRUPT | 0.0453 | 0.0407 | 0.0436 | 0.0402 | ||
| (2.29)‡‡** | (1.78)‡‡* | (2.29)‡‡** | (1.78)‡‡* | |||
| LOCALCORRUPT | 0.0634 | 0.0629 | 0.0663 | |||
| (4.36)*** | (4.33)*** | (4.15)*** | ||||
| NATSECIND | −0.0182 | −0.0168 | −0.0254 | −0.0285 | −0.0279 | −0.0313 |
| (−1.01) | (−0.92) | (−1.20) | (−1.41) | (−1.37) | (−1.34) | |
| Constant | 9.5064 | 9.4528 | 9.4232 | 9.4821 | 9.4608 | 9.3318 |
| (55.50)*** | (55.56)*** | (52.70)*** | (48.75)*** | (49.81)*** | (43.36)*** | |
| Industry fixed effects | Yes | Yes | Yes | Yes | Yes | Yes |
| Entropy-balanced weights | No | No | Yes | No | No | Yes |
| No. of firm-years | 14,404 | 14,404 | 14,404 | 14,404 | 14,404 | 14,404 |
| Average R2 | 0.53 | 0.53 | 0.56 | 0.53 | 0.53 | 0.57 |
| Panel B: Logistic regressions of financial restatements | ||||||
|---|---|---|---|---|---|---|
| Dependent variable = RESTATE | ||||||
| (1) | (2) | (3) | (4) | (5) | (6) | |
| CORRUPT | 0.3318 | 0.3366 | ||||
| (2.80)*** | (2.84)*** | |||||
| HIGH_CORRUPT | 0.2902 | 0.2789 | 0.2933 | 0.2836 | ||
| (2.95)*** | (2.72)*** | (2.98)*** | (2.77)*** | |||
| NATSECIND×CORRUPT | −0.2347 | −0.2447 | ||||
| (−1.18) | (−1.23) | |||||
| NATSECIND×HIGH_CORRUPT | −0.1672 | −0.1125 | −0.1735 | −0.1224 | ||
| (−1.01) | (−0.62) | (−1.05) | (−0.68) | |||
| LOCALCORRUPT | 0.1103 | 0.1090 | 0.1374 | |||
| (1.25) | (1.24) | (1.40) | ||||
| NATSECIND | −0.1558 | −0.1726 | −0.2224 | −0.1551 | −0.1729 | −0.2210 |
| (−0.99) | (−1.11) | (−1.16) | (−0.99) | (−1.11) | (−1.15) | |
| Constant | −2.0597 | −2.0664 | −2.1168 | −2.0782 | −2.0848 | −2.1431 |
| (−2.50)** | (−2.52)** | (−2.41)** | (−2.55)** | (−2.58)** | (−2.47)** | |
| Industry fixed effects | Yes | Yes | Yes | Yes | Yes | Yes |
| Year fixed effects | Yes | Yes | Yes | Yes | Yes | Yes |
| Entropy-balanced weights | No | No | Yes | No | No | Yes |
| No. of firm-years | 14,404 | 14,404 | 14,404 | 14,404 | 14,404 | 14,404 |
| Pseudo-R2 | 0.03 | 0.03 | 0.04 | 0.03 | 0.03 | 0.04 |
| Panel C: Multinomial logistic regressions of audit decision errors controlling for local corruption | ||||||
|---|---|---|---|---|---|---|
| Dependent variable = ERROR | ||||||
| (1) | (2) | (3) | (4) | (5) | (6) | |
| Type I | Type II | Type 1 | Type II | Type I | Type II | |
| CORRUPT | −0.2060 | 0.2716 | ||||
| (−2.05)** | (2.19)** | |||||
| HIGH_CORRUPT | −0.1290 | 0.2513 | −0.0512 | 0.2609 | ||
| (−1.58) | (2.45)** | (−0.60) | (2.46)** | |||
| NATSECIND×CORRUPT | −0.0883 | −0.2404 | ||||
| (−0.54) | (−1.18) | |||||
| NATSECIND×HIGH_CORRUPT | −0.0678 | −0.1710 | −0.0403 | −0.1110 | ||
| (−0.50) | (−1.00) | (−0.28) | (−0.60) | |||
| LOCALCORRUPT | −0.0470 | 0.0969 | −0.0471 | 0.0957 | −0.0503 | 0.1243 |
| (−0.65) | (1.07) | (−0.65) | (1.06) | (−0.65) | (1.24) | |
| NATSECIND | −0.2205 | −0.2169 | −0.2207 | −0.2340 | −0.2505 | −0.2845 |
| (−1.82)* | (−1.36) | (−1.84)* | (−1.48) | (−1.83)* | (−1.47) | |
| Constant | −0.0998 | −1.2213 | −0.0795 | −1.2231 | −0.6495 | −1.3166 |
| (−0.13) | (−1.50) | (−0.10) | (−1.50) | (−0.74) | (−1.53) | |
| Industry fixed effects | Yes | Yes | Yes | Yes | Yes | Yes |
| Year fixed effects | Yes | Yes | Yes | Yes | Yes | Yes |
| Entropy-balanced weights | No | No | Yes | No | No | Yes |
| No. of firm-years | 14,404 | 14,404 | 14,404 | 14,404 | 14,404 | 14,404 |
| Pseudo-R2 | 0.14 | 0.14 | 0.16 | |||
- Note: Table 9 presents cross-sectional results based on our national security industry indicator variable for weak takeover pressure (NATSECIND). Column 1 (Column 4) in Panels A and B includes results for the CORRUPT and NATSECIND×CORRUPT variables before (after) controlling for LOCALCORRUPT. Column 2 (Column 5) in Panels A and B include results for the HIGH_CORRUPT and NATSECIND×HIGH_CORRUPT variables before (after) controlling for LOCALCORRUPT. Columns 3 and 6 in Panels A and B present results for the HIGH_CORRUPT and NATSECIND×HIGH_CORRUPT variables when estimated using entropy-balanced weights and controlling for LOCALCORRUPT. Panel C presents the multinomial logistic regression results for audit decision errors. For brevity, Panel C reports results for CORRUPT and HIGH_CORRUPT and the related interaction variables including our control for local corruption risks (LOCALCORRUPT) for Type I (Columns 1 and 3) and Type II (Columns 2 and 4) errors. Columns 5 and 6 in Panel C present results estimated using entropy-balanced weights. All regressions include the respective control variables. The audit fee regressions in columns (1) to (3) of Panel A are estimated by year and size decile and include only industry and year fixed effects. All other regressions in Panels A and B include both industry and year fixed effects. Robust z-statistics adjusted for firm clusters are presented in parentheses. Variable definitions are included in Appendix 1.
- ‡, ‡‡, and ‡‡‡ denote one-tailed significance at the 10%, 5%, and 1% levels, and *, **, and *** denote two-tailed significance at the 10%, 5%, and 1% levels, respectively.
4.3.6 Controlling for Acts of NOCLAR
As noted earlier, our results hold when we account for revealed instances of firm noncompliance in our empirical regressions. Table 10 presents re-estimated results for our regressions after controlling for each of our ILLEGALACT indicator variables. We add the indicator variables individually to each regression to mitigate collinearity due to some overlap in the noncompliance events across the data sources. Panel A presents the re-estimated results for our audit fee and restatement regressions, while Panel B presents our audit error regression results. For brevity, we present results for the entropy-balanced regressions with the HIGH_CORRUPT and LOCALCORRUPT variables (i.e., our most robust specifications). Untabulated results excluding the entropy-balanced weights and those using unexplained audit fees are consistent with the evidence reported in Table 10.
| Panel A: Entropy-balanced regressions of audit fees and financial restatements | ||||||
|---|---|---|---|---|---|---|
| Annual size-decile regressions of audit fees | Logit regressions of financial restatements | |||||
| Dependent variable: AUDITFEES | Dependent variable: RESTATE | |||||
| Variable | (1) | (2) | (3) | (4) | (5) | (6) |
| HIGH_CORRUPT | 0.0237 | 0.0254 | 0.0240 | 0.2444 | 0.2415 | 0.2469 |
| (1.71)* | (1.69)* | (1.68)* | (2.85)*** | (2.82)*** | (2.89)*** | |
| LOCALCORRUPT | 0.0691 | 0.0685 | 0.0671 | 0.1369 | 0.1447 | 0.1366 |
| (4.35)*** | (4.51)*** | (4.21)*** | (1.39) | (1.47) | (1.39) | |
| ILLEGALACT_RR | 0.0507 | −0.1326 | ||||
| (1.69)* | (−0.95) | |||||
| ILLEGALACT_AA | 0.0558 | 0.1754 | ||||
| (3.53)*** | (1.86)* | |||||
| ILLEGALACT_FCPA | 0.1094 | −1.0934 | ||||
| (3.24)*** | (−1.80)* | |||||
| Constant | 9.2737 | 9.4345 | 9.3801 | −2.1183 | −2.0678 | −2.1438 |
| (41.76)*** | (44.65)*** | (43.09)*** | (−2.45)** | (−2.40)** | (−2.47)** | |
| Industry fixed effects | Yes | Yes | Yes | Yes | Yes | Yes |
| Year fixed effects | No | No | No | Yes | Yes | Yes |
| Entropy-balanced weights | Yes | Yes | Yes | Yes | Yes | Yes |
| No. of firm-years | 14,404 | 14,404 | 14,404 | 10,956 | 10,956 | 10,956 |
| Average R2 | 0.52 | 0.52 | 0.56 | 0.04 | 0.04 | 0.04 |
| Panel B: Entropy-balanced multinomial logistic regressions of audit decision errors | ||||||
|---|---|---|---|---|---|---|
| Dependent variable = ERROR | ||||||
| (1) | (2) | (3) | (4) | (5) | (6) | |
| Type I | Type II | Type I | Type II | Type I | Type II | |
| HIGH_CORRUPT | −0.0651 | 0.2252 | −0.0667 | 0.2218 | −0.0668 | 0.2270 |
| (−0.94) | (2.55)** | (−0.96) | (2.51)** | (−0.97) | (2.57)** | |
| LOCALCORRUPT | −0.0505 | 0.1244 | −0.0474 | 0.1318 | −0.0499 | 0.1244 |
| (−0.65) | (1.24) | (−0.61) | (1.31) | (−0.65) | (1.23) | |
| ILLEGALACT_RR | −0.0528 | −0.1659 | ||||
| (−0.44) | (−1.17) | |||||
| ILLEGALACT_AA | 0.6169 | 0.1817 | ||||
| (0.81) | (1.84)* | |||||
| ILLEGALACT_FCPA | 0.3477 | −0.9375 | ||||
| (1.37) | (−1.58) | |||||
| Constant | −0.6425 | −1.2941 | −0.6229 | −1.2421 | −0.6231 | −1.3178 |
| (−0.73) | (−1.51) | (−0.71) | (−1.45) | (−0.71) | (−1.54) | |
| Industry fixed effects | Yes | Yes | Yes | Yes | Yes | Yes |
| Year fixed effects | Yes | Yes | Yes | Yes | Yes | Yes |
| Entropy-balanced weights | No | No | Yes | No | No | Yes |
| No. of firm-years | 10,956 | 10,956 | 10,956 | 10,956 | 10,956 | 10,956 |
| Pseudo-R2 | 0.16 | 0.16 | 0.16 | |||
- Note: Table 10 replicates our primary results after including controls for actual acts of noncompliance based on our three ILLEGALACT indicator variables. For brevity, we report results for our entropy-balanced regressions with HIGH_CORRUPT as our primary variable and including our control for local corruption risks (LOCALCORRUPT). Panel A presents results for our audit fee and financial restatement regressions, while Panel B presents the multinomial logistic regression results for our tests of audit decision errors. All regressions include the respective control variables. The audit fee regressions in Columns 1 to 3 of Panel A are estimated by year and size decile and include only industry fixed effects. All other regressions in Panels A and B include both industry and year fixed effects. The t-statistics for the audit fee regressions are presented in parentheses and are computed based on robust standard errors of the estimated coefficients. Robust z-statistics adjusted for firm clusters are presented in parentheses for all other regressions. Variable definitions are included in Appendix 1. *, **, and *** denote two-tailed significance at the 10%, 5%, and 1% levels, respectively.
In Panel A, we find that the associations between HIGH_CORRUPT and AUDITFEES are economically and statistically similar to those reported in Table 4. We find a similar interpretation for the coefficients on HIGH_CORRUPT in our restatement regressions. In Panel B, we continue to find significantly positive associations between HIGH_CORRUPT and auditors’ Type II errors. The association with Type I decision errors are insignificant but remains negative. In sum, our results in Table 10 suggest that Internet document-frequencies serve as powerful proxies for client noncompliance risks even after accounting for observable incidents. The evidence further shows that unrevealed corruption along with public perceptions of illegality are important audit factors.
5 Conclusion
Motivated by investor concerns over the failure of auditors to provide early warning signals of their clients’ illegal activities and the consideration of new audit standards to increase auditor responsibility and reporting of a client's NOCLAR, we examine the auditor response to a firm's corruption or noncompliance risk. Corruption risk is consistent with the early warning that regulators have chided auditors with failing to communicate to investors and to the SEC (SEC 1999). We therefore examine auditor response to corruption risk signaled by a “collective wisdom” measure of a firm's engagement in corrupt activities using a broader sample of US companies than in prior corruption literature.
Our study exploits a novel firm-specific measure of perceived and actual corruption to assess how auditors respond to client corruption risks. Our new measure of client corruption uses counts of Google search hits (i.e., document frequencies) to infer the relative prevalence of noncompliance at the firm-year level for US public firms. We find that audit firms adjust their production inputs and price the audit higher as client corruption risks increase. We further find that the increase in audit pricing is indicative of increased audit effort and cannot be attributed simply to an increase in audit fee premiums. The audit adjustment is, however, incomplete as our proxy for client corruption is positively associated with future financial restatements and auditor Type II decision errors. Together, these results suggest that while auditors appropriately price for noncompliance risk, their execution of the audit does not fully adjust for the identified risk. Our evidence shows that auditors can assess corruption risk but that there is a gap in linking this risk to the auditor's response in conducting the audit. This meaningful result contributes to our knowledge of the linkage between corruption risk and potential future financial reporting issues. Our research also suggests that auditors could benefit from expanded guidance on NOCLAR and that lawmaker frustration (e.g., SEC 1999) of few instances of auditor reporting of company NOCLAR behavior to regulators might not be unfounded.
Acknowledgements
We thank Annita Florou (editor), Frank Heflin (discussant), Jeffrey Piao (discussant), David Godsell, an anonymous reviewer, and workshop and conference participants at Baylor University, the Public Company Accounting Oversight Board (PCAOB), Washington State University, the 2021 AAA Auditing Section Midyear Meeting, 2022 Hawaii Accounting Research Conference, and the 2024 Journal of Business, Finance, and Accounting Capital Markets Conference for helpful comments and suggestions. We greatly appreciate insights from Han Stice and Roger White during the early stages of this study. We also thank Mike Drake for sharing the list of noisy or ambiguous ticker symbols; Roger White for sharing district-level federal corruptions convictions data; and the Stanford Law School Foreign Corrupt Practices Act (FCPA) Clearinghouse for sharing data on FCPA violations. We are grateful to Thomas O'Reilly and Keting Jiang for their excellent research assistance.
Endnotes
Appendix 1
Variable definitions
| Primary variables | |
|---|---|
| CORRUPT |
Represents the decile rank of the Corruption document-frequency measure calculated as
where K denotes the number of Google search hits for the term, firm-ticker AROUND(16) corruption, for firm i in fiscal year t, and Q denotes the number of search hits for the term, firm-ticker |
| HIGH_CORRUPT | Equals 1 if the decile rank of the Corruption measure is greater than or equal to 7; 0 otherwise |
| LOCALCORRUPT | Equals 1 if the per capita corruption convictions as of 2008 are greater than the median per capita convictions across all 90 US federal court districts; 0 otherwise. The corruption convictions data are gathered from the US DOJ's annual PIN reports. The PIN reports provide the number of federal convictions of government officials within each US district |
| AUDITFEES | The natural logarithm of audit fees |
| RES_AUDITFEES | Unexplained audit fees estimated using annual size regressions of Equation (2) and excluding the Google-based and regional corruption variables (CORRUPT, HIGH_CORRUPT, and LOCALCORRUPT) |
| RESTATE | Equals 1 if the financial results for any reporting period during the current fiscal year are restated in subsequent years for reasons other than accounting method changes and the adoption of new standards; 0 otherwise |
| ERROR | Categorical variable equal to 0 if the auditor issues a modified audit opinion or an adverse internal control opinion and the company restates its financials in a subsequent period, or the auditor does not issue a modified audit or adverse internal control opinion and the company does not restate; 1 if the auditor issues a modified audit or adverse internal control opinion and the company does not restate its financials (Type I Error); or 2 if the auditor does not issue a modified audit or adverse internal control opinion for a company that subsequently restates its financials (Type II Error) |
| Control variables | |
|---|---|
| SIZE | The natural logarithm of total assets |
| SEC_DISTANCE | The client's geographical distance from the closest SEC regional office |
| NONAUDITFEES | Natural logarithm of nonaudit fees charged for the year |
| AUDITDELAY | Natural logarithm of the number of days between the signature date of the audit opinion and the fiscal year end date |
| GCOPINION | Equals 1 if the auditor issued a going concern opinion for the firm-year; 0 otherwise |
| MODOPINION | Equals 1 if the auditor issued a modified audit opinion for the firm-year; 0 otherwise |
| ICWEAKNESS | Equals 1 if the auditor issued an adverse internal control opinion for the firm-year; 0 otherwise |
| NATSECIND | Equals 1 if the firm operates in a four-digit SIC included among the 61 national security industries listed in Appendix A of CFIUS (2008); 0 otherwise |
| SEGMENTS | The natural logarithm of the number of business and geographical segments of the firm |
| BIG4 | Equals 1 if the audit firm is a Big 4 auditor; 0 otherwise |
| CITY_SPECIALIST | Equals 1 if the audit firm has the highest percentage of fees in a given city-specific industry grouping based on the audit firm's share of audit fees in each two-digit SIC industry for each particular city (J. R. Francis et al. 2005); 0 otherwise |
| INFLUENCE | The client's influence at the city level measured as the decile rank of the ratio of the client's fees for all services to the sum of the fees for all clients of the audit firm within the same city location |
| AGE | The number of fiscal years since the firm's first appearance in Compustat |
| BUSYSEASON | Equals 1 if the firm's fiscal year ends on December 31; 0 otherwise |
| RESTRUCT | Equals 1 if the firm engaged in restructuring activities during the fiscal year; 0 otherwise |
| FOREIGN | The ratio of foreign sales to total sales |
| COMPLEX_EST | The sum of receivables, inventory, and total fair value assets, scaled by total assets |
| CASH_RATIO | The level of cash holdings scaled by total assets |
| ALTMANZ | The decile rank of firms’ Altman Z-score for bankruptcy risk |
| BOOK_MKT | The book-to-market ratio calculated as the ratio of the book value of equity to the market value of equity |
| LEVERAGE | The ratio of total liabilities to total common equity |
| SQRT_EMPLOYEE | The square root of the number of employees |
| STD_ROA | The standard deviation of the firm's return on assets over at least 3 of the last 5 fiscal years |
| SQRT_TENURE | The square root of the number of years that the audit firm has served as the client's auditor |
| LOSSHISTORY | Equals 1 if the firm generated a loss in the current or prior two fiscal years; 0 otherwise. |
| ISSUANCE | Equals 1 if the firm issued debt and/or equity during the fiscal year; 0 otherwise |
| LITRISK | Equals 1 if the firm operates in a highly litigious industry as defined in J. Francis et al. (1994); 0 otherwise |
| OPCYCLE | The client's operating cycle computed as [(Sales/360)/Average Accounts Receivable) + (Cost of Goods Sold/360)/Average Inventory)] |
| CHG_RECV | The change in total receivables, scaled by average total assets |
| CHG_INV | The change in total inventory, scaled by average total assets |
| SOFT_ASSETS | The ratio of soft assets to total assets. Soft assets are computed as total assets minus the sum of net property, plant, and equipment and total cash and cash equivalents |
| CHG_CASHSALES | The change in cash sales, where cash sales are computed as total sales minus the change in account receivables |
| CHG_ROA | The change in return on assets |
| CHG_EMPLOYEE | The abnormal change in the number of employees computed as the percentage change in the number of employees minus the percentage change in total assets |
| OPLEASE | Equals 1 if the firm has nonzero future operating lease obligations; 0 otherwise |
| ABS_DACC | The absolute value of discretionary accruals estimated using the Kothari et al. (2005) performance-matched accruals model |
Appendix 2
1 Examples of Google search documents
|
CACI International Inc. (NYSE: CACI) SIC Industry: 7373 Computer Integrated Systems Design Average number of Google corruption search hits = 2220 |
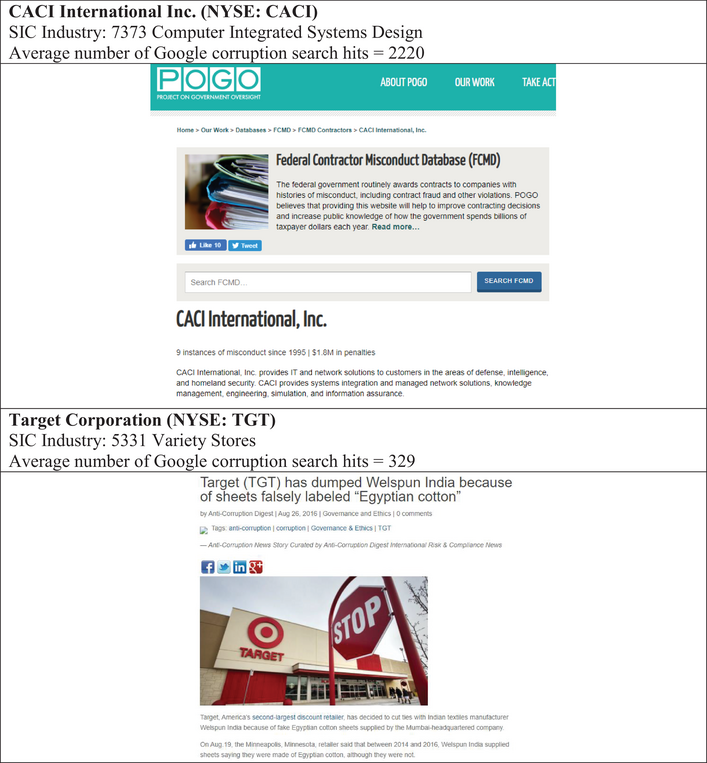 |
|
Target Corporation (NYSE: TGT) SIC Industry: 5331 Variety Stores Average number of Google corruption search hits = 329 |
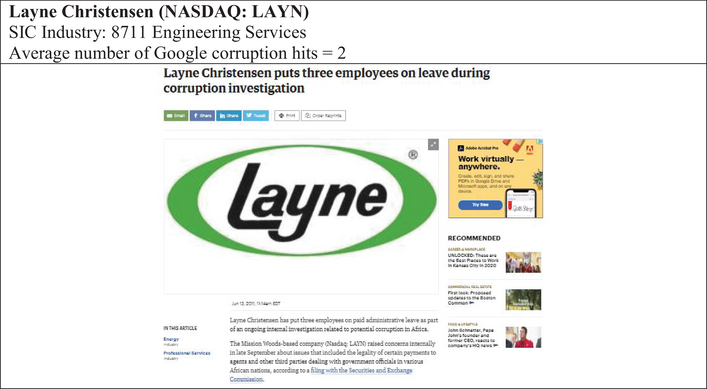 |
- Appendix 2 presents Google document examples drawn from a manual search for a randomly selected set of sample firms. For each randomly selected firm, we replicate the Google search using the search string, firm-ticker AROUND(16) corruption, over the fiscal year period. We present screen clippings of one of the top five documents listed in the search hits. We also provide the average number of Google corruption search hits (i.e., document frequencies) for each firm over our sample period and the SIC industry that the firm operates in.
Open Research
Data Availability Statement
The data that support the findings of this study are available from the corresponding author upon reasonable request. Data from subscription-based data providers are subject to commercial restrictions.