
Variable rate premiums and defined benefit pension funding
Abstract
This study investigates the association between variable rate premiums (VRPs) charged by the Pension Benefit Guaranty Corporation (PBGC) and defined benefit pension funding in the United States. The PBGC requires VRPs from firms that fail to adequately fund their pension plans. Because millions rely on pension income, it is important to understand how government incentives impact pension funding decisions. In the aggregate, VRPs are positively associated with increases in pension funding. However, these premiums are not associated with excess pension contributions (EPCs) for financially distressed firms. These results suggest that financially distressed US firms engage in risk shifting. The lack of association persists even for financially distressed firms with tax benefits associated with pension funding. Finally, the association between VRPs and EPCs holds only for firms with combined lower borrowing costs and higher premiums. This finding suggests that higher premiums are not an effective incentive when firms also face higher borrowing costs and that lower premiums are not an effective incentive for EPCs, regardless of a firm's borrowing cost.
1 INTRODUCTION
US regulators have long been concerned with firms’ ability to pay the defined benefit pension amounts promised to their employees. Statement of Financial Accounting Standards No. 158 (Financial Accounting Standards Board [FASB], 2006) requires firms with underfunded defined benefit plans to report a liability on the balance sheet for the amount of underfunding.1 As of December 31, 2020, the aggregate amount of pension underfunding for the 100 largest US defined benefit plans is $210 billion, or about 3% of the total market capitalization for these firms (Wadia et al., 2021). Furthermore, the US government agrees to pay the pension plan liabilities of any firm that files for bankruptcy. To ensure that it is not left with significantly underfunded plans, the government provides specific incentives for firms to fund their defined benefit plans. Thus, it is important to understand the effectiveness of these incentives on reducing pension plan underfunding.
In this paper, I first establish that the variable rate insurance premiums charged by the Pension Benefit Guarantee Corporation (PBGC) to firms with underfunded plans are associated with higher excess pension contributions (EPCs).2 I then examine whether the association between variable premiums and EPCs exists for financially distressed firms. Next, I examine whether the association between variable rate premiums (VRPs) and EPCs changes for financially distressed firms when those firms have higher tax benefits associated with pension funding. Finally, I examine the association between VRPs and EPCs for firms facing different combinations of premiums and borrowing costs.
The PBGC is the US government agency charged with protecting the retirement income of millions of American workers. This agency provides insurance for defined benefit pension plans sponsored by corporations. Plan sponsors must pay premiums to the PBGC, and in return, the PBGC pays out pension benefits (subject to limitations) to participants or beneficiaries of failed defined benefit plans.3 The PBGC charges two different types of premiums to plan sponsors. First, they charge a per participant flat rate premium to all sponsors of single-employer plans. In addition, the PBGC charges sponsors with underfunded pension plans a VRP. This PBGC VRP serves as a risk adjusted premium that penalizes corporate sponsors who fail to adequately fund their defined benefit plans.
Pension investment is of interest not only to researchers but also to regulators, investors, plan participants and beneficiaries of defined benefit pension plans. The PBGC charges VRPs to incentivize pension investment. Despite rising VRPs, single-employer plans collectively face billions in underfunding and these benefit payments could become the PBGC's responsibility (Bradford, 2020). This paper aims to shed light on the effectiveness of using existing VRPs as an incentive for pension investment. In addition, investors care about firm investment decisions because they desire to maximize their wealth (Jensen & Meckling, 1976). When firms decide to invest additional dollars in defined benefit plans, they may be sacrificing certain growth opportunities. Relatedly, discretionary pension contributions may provide a signal to investors about a lack of such opportunities. If firms lack growth opportunities, defined benefit contributions may be the best use of firm resources. Finally, employees who are plan participants and unions representing these employees care about the effectiveness of government incentives related to defined benefit pension plans, and these groups may lobby for more effective incentives so that plans are fully funded in the future.4
To establish an association between VRPs and EPCs, I obtain VRP data from the PBGC through a Freedom of Information Act request and regress firms’ discretionary pension contributions on VRPs and relevant control variables. The sample period for the main tests includes the years 2014 to 2018. I begin the sample in 2014 because Congress provided pension relief provisions within the Moving Ahead for Progress in the 21st Century Act of 2012, and these relief provisions had the largest impact on pension contributions in 2012 and 2013. To empirically test the first research question, I add to the regression model a measure of financial distress and interaction term between VRPs and the measure of financial distress. To test the second research question, I split the sample based on a firm-year's tax benefits related to pension contributions. I then run separate regressions for firm-years with varying tax benefits. To test the final research question, I create groups within the sample that represent various combinations of borrowing costs and premiums charged. I run a regression separately on each group and examine whether the significance of VRPs changes across the different groups.
This study offers four main findings. First, it establishes that the variable rate insurance premiums charged to sponsors of defined benefit pension plans are positively associated with discretionary pension contributions, providing evidence that VRPs are incentivizing additional pension contributions as intended. This result suggests that firms contribute more to their defined benefit plans in order to lower future risk adjusted premium charges. Next, I find that the association between VRPs and EPCs does not exist for financially distressed firms. This is important because theory predicts that financially distressed firms are the firms most likely to underfund their defined benefit plans or engage in risk shifting. The PBGC's VRPs are designed to combat this moral hazard problem among the US defined benefit sponsors; however, they do not appear to be effective for financially distressed firms. Third, this study finds that the lack of association between VRPs and EPCs persists for financially distressed firms when these firms have high tax benefits associated with pension funding. This finding is important because the government provides strong tax benefits related to defined benefit funding. Even the dual US government incentives of risk adjusted premiums and tax benefits do not seem to incentivize financially distressed firms to increase pension contributions. Finally, I only find evidence of an association between VRPs and EPCs for firms with combined lower borrowing costs and higher premium costs. This finding suggests that higher premiums are not an effective incentive when firms also face higher borrowing costs and may imply that these firms prioritize paying off balance sheet debt over reducing pension obligations. It also suggests that lower premiums are not effective at incentivizing EPCs, regardless of a firm's borrowing cost.
This is the first study to examine the full package of US government incentives currently in place to promote increased pension funding. Gaertner et al. (2020) examined the impact of tax incentives on pension contributions by studying how firms reacted to the Tax Cuts and Jobs Act (TCJA). The TCJA reduced the corporate tax rate, which decreased the tax benefits associated with making pension contributions. Gaertner et al. (2020) provided evidence that firms responded to the TCJA by increasing their unexpected pension contributions before the lower corporate tax rate went into effect. The authors acknowledge that pension insurance premiums may also impact decisions regarding discretionary pension contributions. My study shows that although both tax incentives and risk adjusted insurance premiums are significant determinants of EPCs, even the dual effect of these incentives fails to motivate financially distressed firms to contribute to their defined benefit plans. Sharpe (1976) and Treynor (1977) predicted that firms facing financial distress will engage in risk shifting by underfunding their pension plans, and the results of this study show that this risk shifting behavior persists in the presence of both risk adjusted insurance premiums and tax benefits associated with pension funding. The analysis also addresses the lack of empirical evidence on the interaction of tax and nontax factors that impact deferred compensation noted by Shackelford and Shevlin (2001).
This study also contributes to the debate regarding PBGC reform and general pension funding. The US Government Accountability Office (GAO) released a report in 2012 suggesting that Congress revise the PBGC's premium structure (GAO, 2012). At the time this report was released, the PBGC was in danger of becoming insolvent. The report suggested two alternative courses of action regarding PBGC premiums. The first option was to continue assigning VRPs based solely on a plan's underfunding but to increase the amount of these premiums. The second option was to expand the basis for assigning premiums to include other risk factors, such as the financial strength of the corporate sponsor or the risk of investment allocation within plan assets. Congress passed legislation in line with the first option. As a result, the PBGC VRP amount increased each year from 2014 to 2024. This study provides evidence that these VRPs, based solely on a plan's underfunding, are effective in the aggregate but fail to incentivize financially distressed or high cost of debt (COD) firms to make discretionary contributions to defined benefit plans. These findings contrast the findings of Guan and Lui (2016) who find that risk-adjusted premiums implemented by the United Kingdom helped to curb risk shifting behavior among financially distressed firms. The results of this paper suggest that countries without mandatory full pension funding requirements should carefully consider the most appropriate premium structure to target risk shifting behavior by financially distressed firms.
2 BACKGROUND, PRIOR LITERATURE AND HYPOTHESIS DEVELOPMENT
2.1 Background
Defined benefit plans are a type of retirement plan offered by firms across the world. Firms that sponsor defined benefit plans pledge retirement benefits to their employees. These benefits are typically based upon the employee's age, tenure with the company and earnings history. Sponsors of defined benefit plans (US corporations, in this study) bear the investment risk of contributing financial assets to the retirement plan and hiring a third party to invest and manage these dedicated pension assets. Internal Revenue Code Section 430 (a) specifies the minimum amount of annual pension contributions that US firms are required to make. However, the US government also institutes specific incentives to encourage EPCs.
Tax savings incentivize pension contributions because contributions made to defined benefit plans in the United States are tax deductible, and pension asset growth remains untaxed.5 Prior to the TCJA of 2017, the corporate tax rate was 35%, meaning every $1 million in pension contributions resulted in $350,000 of tax savings. However, the TCJA lowers the corporate tax rate to 21%, meaning a $1 million pension contribution now results in only $210,000 in tax savings. Although the TCJA went into effect on January 1, 2018, firms were able to make pension contributions at the higher corporate tax rate of 35% through September 15, 2018. Although tax benefits provide positive reinforcement for pension contributions, other government incentives serve as negative reinforcement for firms that fail to fund their defined benefit plans.
In 1974, Congress passed the Employee Retirement Income Security Act (ERISA) in order to protect defined benefit plan participants and their beneficiaries. ERISA established the PBGC. The PBGC insures defined benefit pension plans and charges premiums to sponsors of these plans. The PBGC charges a per participant flat rate premium to all sponsors of single-employer plans. In 1988, the PBGC introduced VRPs, which are in addition to the flat rate premium. Only sponsors with unfunded vested benefits (UVBs) pay a VRP, and the premium is subject to a per participant cap.6
The VRP has historically been low, with the PBGC charging nine dollars per $1000 of UVB since 1991. However, the Bipartisan Budget Act of 2013 increased the VRPs beginning in 2014. In 2014, the VRP increased 56% to $14 per $1000 of UVBs. Each year from 2014 to 2018, the PBGC hiked its VRP so that in 2018 the PBGC charged a VRP of $38 per $1000 of UVBs, a 171% increase over the 2014 premium.7 See Appendix B for an example of premium calculations.
2.2 Prior literature and hypothesis development
Prior literature proposes several theories to explain pension funding and investment decisions. One stream of literature focuses on how defined benefit plan sponsors make funding decisions while facing risk. Sharpe (1976) and Treynor (1977) theorize that the contract between defined benefit plan sponsors and the PBGC results in the creation of a put option. Corporate sponsors of defined benefit plans may exercise this option by filing for bankruptcy and allowing the PBGC to take responsibility for the payment of pension benefits. Theory predicts that in order to maximize the value of this option, firms engage in risk shifting (moral hazard) by minimizing defined benefit contributions and maximizing the risk of pension assets.
Some empirical evidence supports risk shifting. Bodie et al. (1987) find that firms facing higher risk are less likely to fully fund their pension plans. Hsieh et al. (1994) examined 176 firms in 1989 and found that sponsors with underfunded plans are severely undercharged by the PBGC, whereas sponsors with overfunded plans pay fair premiums. This study highlights that firms being undercharged by the PBGC have incentives to engage in risk shifting. The PBGC's heavy historic reliance on a flat rate premium, which fails to adjust for pension underfunding, exacerbates this moral hazard problem (Niehaus, 1990). More recently, Guan and Lui (2016) document that financially distressed US sponsors with severely underfunded defined benefit plans engage in risk shifting. They also find that risk-adjusted premiums implemented by the United Kingdom helped to curb this type of risk shifting behavior. Chaudhry et al. (2017) provide additional evidence that the flexibility that US firms have in making pension contributions results in risk shifting and that managers use funds that could be used for pension funding for overinvestment and empire building.
Although theoretical predictions and empirical evidence support risk shifting, a constraint to risk shifting does exist. When pension plan sponsors have engaged in risk shifting and avoid bankruptcy, they must continue to make required minimum annual pension contributions using the corporation's resources. These required pension contributions limit opportunities to invest in positive net present value projects or engage in shareholder payouts. As a result, firms may be incentivized to engage in risk management, rather than risk shifting. Francis and Reiter (1987) regress a firm's pension funding ratio on a measure of firm risk. They predict the association between firm risk and a firm's funding status to be negative, consistent with the pension put theory and risk shifting behavior by firms. However, they actually find that firms with more risk have more fully funded pension plans, which is inconsistent with risk shifting. Rauh (2009) provides evidence that firms facing potential bankruptcy engage in risk management rather than risk shifting, investing in safer pension assets in order to avoid future financial constraints.
An et al. (2013) also find that sponsors invest in safer pension assets when their plans are underfunded and when they face bankruptcy risk. However, they do find that defined benefit sponsors who ultimately freeze, terminate or convert their plans to defined contribution plans engage in risk shifting behavior. Anantharaman and Lee (2014) help to reconcile the mixed evidence on risk shifting and risk management by examining how compensation structures impact pension investment. They find that risk shifting is stronger when management compensation structures include incentives for risk taking.8 Cheng and Swenson (2018) also provide evidence of risk shifting in the presence of higher executive compensation.
Prior literature provides support for firms engaging in both risk shifting and risk management behavior when facing financial distress. Guan and Lui (2016) provide evidence that a country's premium structure has the ability to combat risk shifting behavior. The risk-adjusted premiums implemented by the United Kingdom helped to curb risk shifting within that country (Guan & Lui, 2016). These results suggest that countries may introduce risk-adjusted premiums that incentivize defined benefit sponsors to contribute to their pension plans. The US Congress also recognized this opportunity and passed the Bipartisan Budget Act of 2013 in order to combat risk shifting among defined benefit sponsors. This act increased the risk-adjusted (variable rate) premiums charged by the PBGC beginning in 2014 in an effort to extract higher pension contributions from sponsors with underfunded plans. When considering how to revise the risk-adjusted premiums, Congress contemplated expanding the basis for assigning premiums to include factors such as the financial strength of the plan sponsor.9 However, Congress ultimately decided to continue assigning premiums based solely on a plan's underfunding level. It remains an empirical question as to whether the revised premium structure effectively combats risk shifting among plan sponsors lacking financial strength.
- H1. Excess pension contributions are not associated with variable rate premiums for firms facing financial distress.
Another stream of literature focuses on how tax incentives motivate pension investment. Theory work in this area predicts that firms will fully fund their defined benefit plans and invest pension assets entirely in debt in order to take advantage of the tax benefits associated with these plans (Black, 1980; Tepper, 1981). Frank (2002) tests the asset allocation portion of the tax benefit hypothesis and found that firms with higher marginal tax rates invest more heavily in bonds, providing evidence that explicit taxes impact decision making for defined benefit plans. Early work examining how firms fund their defined benefit plans provides evidence that tax incentives are associated with funding decisions. Bodie et al. (1987) provide evidence that firms with lower tax liabilities have significantly lower pension funding ratios. Francis and Reiter (1987) test several theories of pension funding, including the tax benefit hypothesis. Using a tax benefit indicator variable equal to one if a firm has a tax loss carryforward and zero otherwise, they find that a firm's pension funding ratio is positively associated with a firm's tax benefit. Thomas (1988) offers additional support for the tax benefit hypothesis using a more sophisticated measure of a firm's tax status. Thomas (1988) provides evidence that tax status is an important determinant of pension funding.
More recently, Gaertner et al. (2020) provide evidence that firms increased pension contributions in 2017 in order to take advantage of tax deductions associated with pension contributions before the lower US corporate tax rate implemented by the TCJA made these contributions less valuable. Campbell et al. (2010) examine the market reaction to the Pension Protection Act (PPA) of 2006, which accelerated funding requirements and increased the tax deduction available for defined benefit plans. The authors find that firms with higher marginal tax rates achieved higher cumulative abnormal returns following the PPA 2006. The positive market reaction indicates the increased level of pension contributions qualifying for tax deductibility most benefits firms with the highest marginal tax rates.
- H2. The association between variable rate premiums and excess pension contributions is significantly positive for firms lacking financial strength when these firms have tax benefits related to pension funding.
Bodie et al. (1987) examine two broad theories on pension funding. The first theory is the traditional perspective which states that pension funds are completely separate from the corporation and its shareholders and that these funds are managed without regard to a firm's corporate financial policy or the interests of its shareholders. The second theory, the corporate financial perspective, holds the opposite view. This theory states that pension funding decisions are an important aspect of a firm's overall corporate financial policy and that firms do consider the interests of shareholders in making pension funding decisions. Bodie et al. (1987) provide evidence that pension decisions are integrated with a firm's overall corporate financial policy. Li and Zhao (2020) provide evidence consistent with the traditional perspective in a United Kingdom setting. They find that exogenous shocks resulting in decreases to defined benefit usage among firm executives do not result in changes to a firm's overall risk or to its cash holdings, research and development spending, or level of capital expenditures.
Consistent with the corporate financial perspective, Landsman (1986) provides evidence that securities markets value pension assets and liabilities as corporate assets and liabilities as firm sponsors have full responsibility over them. Further, Peterson (1994) finds that firms with greater cash flow volatility prefer to adopt defined contribution plans rather than defined benefit plans due to differences in funding requirements. As pension liabilities are firm liabilities (Landsman, 1986), firms may lower overall leverage by utilizing defined contribution plans (Peterson, 1994). Other studies examine the association between the COD and pension funding. Campbell et al. (2012) provide evidence that mandatory pension contributions increase the COD for firms lacking financial strength. Almaghrabi et al. (2020) provide evidence that higher compliance with pension related disclosure requirements mitigates the negative association between pension underfunding and a plan sponsor's COD.
- H3. The relative cost of a firm's variable rate premium to its cost of debt does not change the association between excess pension contributions and variable rate premiums.
3 SAMPLE SELECTION AND RESEARCH DESIGN
3.1 Sample selection
In the United States, every sponsor of an employee benefit plan with 100 or more participants at the beginning of the plan year must file a Form 5500 with the Department of Labor (DOL). Schedule SB of Form 5500 also includes actuarial information regarding the defined benefit plan. I begin the sample selection process by identifying all plans that filed a Form 5500 Schedule SB for plan years 2014 through 2018.10 Next, I match these plans with data for the corporate plan sponsors available via Compustat using Employer Identification Number, which is the primary identifier collected by the DOL. I obtain 4783 unique plan year observations from 2014 to 2018. Table 1 outlines the sample selection procedures.
| Panel A: Sample selection | |
|---|---|
| Defined Benefit Plans from 2014 to 2018 with data available from Compustat | 4783 |
| Less: | |
| Missing MTR variable | 249 |
| Missing VRP variable | 95 |
| Missing some necessary Compustat variable | 1496 |
| Elimination of utilities (SIC 4811, 4911, 4922, 4923, 4924, 4931, 4932 and 4940) | 510 |
| Elimination of defense contractors (SIC 3720, 3721, 3728, 2730 and 3760) | 189 |
| Total plan year observations | 2244 |
| Defined benefit firm-years for H1 and H2 | 1506 |
| Less: | |
| Missing Compustat variable necessary to compute cost of debt | 223 |
| Defined benefit firm-years for H3 | 1283 |
| Panel B: Sample by year | |
|---|---|
| 2014 | 323 |
| 2015 | 310 |
| 2016 | 305 |
| 2017 | 290 |
| 2018 | 278 |
| Total | 1506 |
- Abbreviation: VRP, variable rate premium.
I eliminate 249 observations lacking a marginal tax rate. I eliminate 95 plan-year observations that lack the relevant VRP data. I eliminate 1496 observations that are missing relevant Compustat variables. Following Thomas (1988) and Frank (2002), I eliminate defense contractors and public utilities because these firms have nontax incentives to overfund.11 Removing observations in these industries eliminates 699 plan years from the sample. This results in 2244 plan-year observations.
Some firms included in the sample sponsor multiple defined benefit plans over the same time period. For example, the sample includes American Telephone and Telegraph, Inc. (AT&T). AT&T sponsors two separate defined benefit plans and files a Form 5500 for each of its defined benefit plans. As a result, the final sample of 2244 plan-year observations includes two plan-year observations for AT&T for each year of the sample or 10 total AT&T observations over 5 years. In order to obtain a sample consisting of firm-year observations, I aggregate the total annual VRPs and EPCs made by plans that are sponsored by the same firm to obtain a final sample of 1506 firm-year observations for H1 and H2. The final sample includes one observation for AT&T for each year 2014–2018. For H3, I eliminate an additional 223 firm-year observations without available Compustat data to calculate COD. The sample used to test H3 contains a total of 1283 firm-year observations.
Panel B of Table 1 shows the sample selection by year. The first year of the sample has the highest number of observations at 323 firm years, and the last year of the sample has the lowest number of observations at 278 firm years. Regressions include year fixed effects to control for any impact that yearly variations in the sample might have on the results.
3.2 Research design for H1—variable rate premiums and excess pension contributions for financially distressed firms
The dependent variable, EPCs, comprises contributions made by plan sponsors in excess of minimum required contributions to defined benefit plans scaled by lagged total assets.12 VRP is a firm's VRP charged by the PBGC. Plans owe a VRP if the vested benefits (or obligations) of the plan exceed the fair value of the plan's assets at the beginning of the year. As the amounts of VRPs owed are determined at the beginning of the plan year, the regression model used VRP from year t and EPC from year t. The PBGC provides data on VRPs, and I scale a plan's VRP (in millions) by lagged total firm assets. VRPs are designed to incentivize pension funding, so I expect VRP to be positively associated with EPC and predict β1 > 0. Firms will increase their discretionary pension contributions as their VRPs increase.
The FinDistress variable in the model captures firms facing financial distress. I first use a measure of a firm's probability of default based on Merton's model (Merton, 1974). I then rank the firm-years in the sample into quartiles based on their probability of default. Finally, I classify firm-years in the highest quartile (firm-years with the highest probability of default) as financially distressed. FinDistress has a value of one for firm-years that fall into the highest quartile of probability of default and zero otherwise. I do not make a prediction about the association between FinDistress and EPC (β2) as prior literature provides evidence of both risk shifting (β2 < 0) and risk management (β2 > 0) among financially distressed firms (An et al., 2013; Anantharaman & Lee, 2014; Bodie et al., 1987; Francis & Reiter, 1987; Guan & Lui, 2016; Hsieh et al., 1994; Niehaus, 1990; Rauh, 2009).
I include the interaction term VRP × FinDistress (β3) to see whether the association between VRP and EPC is incrementally different for financially distressed firms. I expect that, on average, VRPs are positively associated with EPC. However, FinDistress may moderate the association between VRP and EPC as theory predicts that financially distressed firms engage in risk shifting (Sharpe, 1976; Treynor, 1977). If VRPs successfully incentivize the firms most likely to engage in risk shifting, financially distressed firms, to make EPCs, FinDistress × VRP will be significantly positive (β3 > 0). Alternatively, as the VRPs charged by the PBGC do not consider the financial strength of the plan sponsor, these premiums may fail to incentivize financially distressed firms. In this case, FinDistress × VRP may be zero or negative (β3 ≤ 0). The sum of the variables VRP + VRP × FinDistress (β1 + β3) represents the association between VRP and EPC for financially distressed firms and is the variable of interest for the first hypothesis. Consistent with the first hypothesis, I do not provide a directional prediction on β1 + β3.
The control variables included in the model capture characteristics of each pension plan's corporate sponsor that may be associated with EPCs. US sponsors of pension plans receive a tax deduction for pension contributions. The model, therefore, includes a sponsoring firm's marginal tax rate (MTR). MTR is based on taxable income after deducting interest expense as computed by Graham (1996). I expect β4 > 0 since firms with higher marginal tax rates are more likely to make pension contributions in order to lower their tax liabilities. Controlling for a sponsoring firm's profitability and leverage help to control for the financial health of the pension sponsor as unhealthy firms have a higher likelihood of exercising the put option associated with their defined benefit plans. Profitability is measured as a firm's average return on lagged assets, and I expect β5 > 0. Leverage is measured as total long-term debt scaled by total lagged assets, and I expect β6 < 0.
The model controls for a firm's growth opportunities using a firm's market to book ratio (MTB). MTB, measures as a firm's market value scaled by its book value. I expect firms with larger growth opportunities to contribute less to their defined benefit plans and expect β7 < 0. Free cash flow (FCF) is a firm's operating cash flow before pension contributions and less capital expenditures scaled by total lagged assets. Firms with higher FCF have a greater ability to invest in high net present value opportunities. However, these firms should also have a greater ability to make EPCs. I do not make a prediction for β9. Volatility and FundedStatus are controls for a firm's likelihood to exercise its put option. Volatility is the standard deviation of a firm's operating cash flows less pension contributions for the prior 5 years, and I expect β8 < 0. FundedStatus is the fair value of a firm's pension assets less its projected benefit obligation scaled by the projected benefit obligation.13 I expect β10 > 0.
The model controls for a firm's overall defined benefit plan size (PlanSize), which is measured as the natural logarithm of plan assets. I predict β11 > 0 indicating that larger defined benefit plans make larger excess contributions to these plans. The model also controls for firm size with the variable Assets, measured as the natural log of total assets held by the firm sponsoring the defined benefit plan. I predict β12 > 0 indicating that larger firms make larger excess contributions to their defined benefit plans.
Finally, the model controls for several plan characteristics that may be associated with EPC. It controls for a firm's discount rate (DiscountRate), measured as a firm's defined benefit plan discount rate actuarial assumption. Prior literature provides evidence that distressed firms choose a higher discount rate, which positively impacts FundedStatus (Amir & Gordon, 1996; Asthana, 1999). I predict β13 < 0 as firms that manipulate actuarial assumptions in order to improve FundedStatus are unlikely to make discretionary contributions (EPC). Plan duration (Duration) is a crude measure of the length of time that a pension plan will be paying out benefits. Duration is annual pension service cost divided by the sum of pension service and interest costs. I expect plans with younger participants and a longer duration to make higher EPC (β14 > 0).
Investment risk (InvRisk) captures the proportion of pension assets invested in equity securities. Equity securities are riskier than alternatives, such as bonds. The pension put theory predicts that firms making lower pension contributions will invest in riskier securities (Sharpe, 1976; Treynor, 1977). I predict InvRisk will be negatively associated with EPC (β15 < 0). Finally, the model includes an indicator variable equal to one if a firm's reported service cost is zero and zero otherwise. This indicator variable identifies pension plans that are frozen (Frozen). Following Guan and Lui (2016), I predict that Frozen will be negatively associated with EPC since firms with frozen plans are more likely to fund conservatively (β16 < 0).
The model includes year and industry fixed effects and uses robust standard errors with clustering by firm. I winsorize all continuous variables at the 1st and 99th percentile. Finally, it is possible that the treatment firms, those that pay VRPs, may have different characteristics than firms that do not pay VRPs. For example, firms that pay VRPs should have a lower funded status than firms that are not subject to these premiums. As such, the covariates in the model may be imbalanced between the treatment and control firms or more specifically between firms that pay VRPs and firms that do not. I employ entropy balancing in order to correct any existing covariate imbalance. Entropy balancing is a statistical technique that weights the covariates of the model so that the reweighted datasets are balanced between the control and treatment groups. In applying entropy balancing to the sample, I choose to reweight each control group observation across three moments: mean, variance and skewness (Hainmueller, 2012).
3.3 Research design for H2—risk shifting in the presence of tax benefits
I do not include the MTR variable in this model and instead run Equation (2) on samples that have varying levels of tax incentives related to defined benefit contributions. First, I divide the sample based on industry and year adjusted median MTR. Firm-years greater than the median MTR comprise the HighMTR sample. All other firm-years comprise the LowMTR sample. I run Equation (2) on the HighMTR and LowMTR samples separately. The variable of interest is the sum of VRP + VRP × FinDistress (β1 + β3), and I predict that the sum of these variables will be significantly positively associated with EPC in the HighMTR sample.
MTR incorporates worldwide net operating losses and may not fully align with a sponsoring firm's US tax incentive for defined benefit contributions (Thomas, 1988). Therefore, I supplement MTR with another measure for a sponsoring firm's tax incentives. Following Gaertner et al. (2020), I create an indicator variable that captures a sponsoring firm's pre-contribution tax incentive for defined benefit payments. Defined benefit contributions directly lower federal tax expense, so this variable adjusts the sponsoring firm's total federal income taxes by adding back the tax deduction that a sponsoring firm receives for current year contributions to its defined benefit plan. Taxpayer equals one if a firm's federal income tax expense plus the tax effect of pension contributions is greater than zero and zero otherwise. I run Equation (2) on firm-years with Taxpayer equal to one. I expect the sum of VRP + VRP × FinDistress (β1 + β3) to be significantly positive, suggesting that the tax benefits associated with defined benefit contributions help to curb risk shifting behavior among financially distressed firms.
3.4 Research design for H3—impact of borrowing cost on association between variable rate premiums and excess pension contributions
To test the third hypothesis, I create four groups within the sample of 1283 firm-year observations and run Equation (3) separately on each group. In order to create the four groups, I first split the sample into high and low COD observations. High COD observations are those firms with industry and year adjusted interest expense divided by average debt that fall within the highest half of the sample.14 I then split the sample into high and low VRP observations using the same methodology. Using these COD and VRP splits, I create four groups. The first group is HighHigh and represents observations with both a high COD and a high VRP. The next group is LowLow and represents observations with both a low COD and a low VRP. The third group is HighLow and represents firms with a high COD and a low VRP. The final group is LowHigh and represents firms with a low COD and a high VRP. The variable of interest for each group is VRP (β1). If β1 is consistently positive across all groups, this is evidence that the varying levels of COD relative to VRPs do not change a firm's decision to make EPCs. If β1 changes across the groups, this provides evidence that a firm's COD relative to its VRPs is relevant to a firm's pension funding decision, consistent with the corporate financial perspective.
4 DESCRIPTIVE STATISTICS AND RESULTS
4.1 Descriptive statistics and correlations
Table 2 (Panel A) reports non-entropy balanced descriptive statistics for the full sample. Continuous variables are winsorized at 1% and 99%. The average plan sponsor in the sample reports an underfunded pension plan on its balance sheet, meaning that its projected benefit obligation is larger than the fair value of its pension assets. The average marginal tax rate for the sample is 16.4%. This is reasonable as the tax rates are based on income after interest expense has already been deducted. The average firm in the sample incurs a VRP charged by the PBGC and contributes to its plan in excess of the required amount.
| Panel A: Non-entropy balanced sample | ||||||
|---|---|---|---|---|---|---|
| N | Mean | Std Dev | Q1 | Median | Q3 | |
| EPC (unscaled) | 1506 | 44.687 | 210.074 | 0.000 | 0.005 | 9.101 |
| VRP (unscaled) | 1506 | 2.461 | 13.265 | 0.000 | 0.587 | 0.751 |
| FinDistress (raw) | 1506 | 0.002 | 0.007 | 0.000 | 0.000 | 0.000 |
| MTR | 1506 | 0.164 | 0.142 | 0.022 | 0.210 | 0.350 |
| Profitability | 1506 | 0.096 | 0.102 | 0.026 | 0.093 | 0.152 |
| Leverage | 1506 | 0.239 | 0.195 | 0.086 | 0.216 | 0.340 |
| MTB | 1506 | 3.227 | 4.414 | 1.432 | 2.377 | 3.941 |
| Volatility | 1506 | 0.026 | 0.021 | 0.011 | 0.021 | 0.036 |
| FCF | 1506 | 0.058 | 0.055 | 0.017 | 0.054 | 0.091 |
| FundedStatus | 1506 | −0.171 | 0.173 | −0.265 | −0.181 | −0.091 |
| PlanSize | 1506 | 6.148 | 2.008 | 4.764 | 6.114 | 7.640 |
| Assets | 1506 | 8.674 | 1.839 | 7.442 | 8.583 | 9.849 |
| DiscountRate | 1506 | 4.011 | 0.390 | 3.750 | 4.060 | 4.280 |
| Duration | 1506 | 0.413 | 0.444 | 0.069 | 0.311 | 0.598 |
| InvRisk | 1506 | 46.845 | 19.712 | 34.000 | 50.000 | 61.000 |
| Frozen | 1506 | 0.138 | 0.345 | 0.000 | 0.000 | 0.000 |
| RD | 1506 | 0.012 | 0.020 | 0.000 | 0.001 | 0.019 |
| Z-Score | 1199 | 3.375 | 1.898 | 2.149 | 3.156 | 4.274 |
| O-Score | 1211 | 0.086 | 1.527 | 2.149 | −0.033 | 0.977 |
| COD | 1283 | 0.047 | 0.021 | 0.033 | 0.044 | 0.055 |
| Panel B: Non-entropy balanced subsamples: VRP > 0 and VRP = 0 | ||||||||
|---|---|---|---|---|---|---|---|---|
| Firm-years with VRP > 0 | Firm-years with VRP = 0 | |||||||
| N | Mean | Median | Std Dev | N | Mean | Median | Std Dev | |
| EPC (unscaled) | 819 | 47.655 | 0.074 | 253.029 | 687 | 41.149 | 0.000 | 143.012 |
| VRP (unscaled) | 819 | 4.374 | 0.510 | 17.686 | 687 | 0.179 | 0.000 | 1.861 |
| FinDistress (raw) | 819 | 0.003 | 0.000 | 0.009 | 687 | 0.001 | 0.000 | 0.005 |
| MTR | 819 | 0.139 | 0.043 | 0.141 | 687 | 0.195 | 0.210 | 0.138 |
| Profitability | 819 | 0.086 | 0.089 | 0.102 | 687 | 0.108 | 0.098 | 0.101 |
| Leverage | 819 | 0.267 | 0.235 | 0.205 | 687 | 0.206 | 0.179 | 0.177 |
| MTB | 819 | 2.984 | 2.430 | 4.619 | 687 | 3.519 | 2.338 | 4.142 |
| Volatility | 819 | 0.029 | 0.024 | 0.219 | 687 | 0.023 | 0.017 | 0.020 |
| FCF | 819 | 0.055 | 0.055 | 0.054 | 687 | 0.061 | 0.053 | 0.057 |
| FundedStatus | 819 | −0.241 | −0.233 | 0.117 | 687 | −0.088 | −0.105 | 0.191 |
| PlanSize | 819 | 5.842 | 5.839 | 1.961 | 687 | 6.513 | 6.469 | 2.004 |
| Assets | 819 | 8.250 | 8.220 | 1.751 | 687 | 9.179 | 9.105 | 1.815 |
| DiscountRate | 819 | 3.984 | 4.020 | 0.388 | 687 | 4.043 | 4.100 | 0.391 |
| Duration | 819 | 0.297 | 0.183 | 0.386 | 687 | 0.551 | 0.486 | 0.468 |
| InvRisk | 819 | 47.548 | 49.917 | 17.608 | 687 | 46.006 | 50.000 | 21.942 |
| Frozen | 819 | 0.179 | 0.000 | 0.384 | 687 | 0.089 | 0.000 | 0.285 |
| RD | 819 | 0.011 | 0.002 | 0.015 | 687 | 0.014 | 0.000 | 0.024 |
| Z-Score | 709 | 2.982 | 2.899 | 1.700 | 490 | 3.942 | 3.515 | 2.023 |
| O-Score | 717 | 0.430 | 0.237 | 1.499 | 494 | −0.414 | −0.340 | 1.427 |
| COD | 750 | 0.049 | 0.047 | 0.021 | 533 | 0.044 | 0.040 | 0.020 |
| Panel C: Entropy balanced sample | ||||||
|---|---|---|---|---|---|---|
| N | Mean | Std Dev | Q1 | Median | Q3 | |
| EPC (unscaled) | 1506 | 44.687 | 210.074 | 0.000 | 0.005 | 9.101 |
| VRP (unscaled) | 1506 | 2.461 | 13.265 | 0.000 | 0.586 | 0.751 |
| FinDistress (raw) | 1506 | 0.002 | 0.007 | 0.000 | 0.000 | 0.000 |
| MTR | 1506 | 0.139 | 0.137 | 0.201 | 0.052 | 0.252 |
| Profitability | 1506 | 0.086 | 0.103 | 0.027 | 0.088 | 0.141 |
| Leverage | 1506 | 0.267 | 0.209 | 0.111 | 0.242 | 0.362 |
| MTB | 1506 | 2.984 | 4.181 | 1.400 | 2.367 | 3.774 |
| Volatility | 1506 | 0.029 | 0.022 | 0.015 | 0.024 | 0.038 |
| FCF | 1506 | 0.055 | 0.566 | 0.018 | 0.054 | 0.088 |
| FundedStatus | 1506 | −0.241 | 0.150 | −0.302 | −0.226 | −0.138 |
| PlanSize | 1506 | 5.842 | 2.054 | 4.578 | 5.894 | 7.228 |
| Assets | 1506 | 8.250 | 1.699 | 7.256 | 8.107 | 9.236 |
| DiscountRate | 1506 | 3.984 | 0.395 | 3.750 | 4.050 | 4.250 |
| Duration | 1506 | 0.298 | 0.343 | 0.038 | 0.194 | 0.432 |
| InvRisk | 1506 | 47.548 | 20.076 | 34.000 | 50.200 | 62.000 |
| Frozen | 1506 | 0.179 | 0.384 | 0.000 | 0.000 | 0.000 |
| RD | 1506 | 0.012 | 0.020 | 0.000 | 0.001 | 0.019 |
| Z-Score | 1199 | 3.375 | 1.898 | 2.149 | 3.156 | 4.274 |
| O-Score | 1211 | 0.086 | 1.527 | 2.149 | −0.033 | 0.977 |
| COD | 1283 | 0.047 | 0.021 | 0.033 | 0.044 | 0.055 |
- Note: Panel A of this table presents the descriptive statistics for the non-entropy balanced sample, Panel B presents descriptive statistics for two non-entropy balanced subsamples, and Panel C presents descriptive statistics for the entropy balanced sample. The first subsample in Panel B includes firm-years that incurred variable rate premiums, and the second subsample includes firm-years that did not incur variable rate premiums. All continuous variables are winsorized at the 1% and 99% level. See Appendix A for variable definitions.
- Abbreviations: COD, cost of debt; EPC, excess pension contributions; FCF, free cash flow; VRP, variable rate premium.
Table 2 (Panel B) reports non-entropy balanced descriptive statistics for two subsamples. This panel reports descriptive statistics for firm-years in the sample that incur a VRP (VRP > 0) and for firm-years that do not incur a VRP (VRP = 0). The difference in means between firm-years that incur VRPs and those that do not is significant across the majority of the control variables. These descriptive statistics indicate the need for entropy balancing based on whether or not a firm-year incurs a VRP. Entropy balancing weights the covariates of the model so that the reweighted datasets are balanced between firms that pay VRPs and firms that do not. I choose to reweight each control group observation across three moments: mean, variance and skewness (Hainmueller, 2012).
Table 2 (Panel C) reports entropy balanced descriptive statistics for the full sample. Entropy balancing applies only to control variables, so the descriptives for the dependent variable (EPC) and for the various variables of interest do not change from the descriptives presented in Panel A. Reweighting the control variables for control group observations across the mean results in the mean for each control variable in the full sample equaling the mean shown for firm-years with VRP > 0 in Panel B.
Table 3 reports the Pearson (Spearman) correlations for the variables used in hypothesis testing. As expected, the correlation matrix shows a positive and significant correlation between the EPC and VRP variables. This is univariate evidence consistent with VRPs incentivizing EPCs as intended. There is a negative and significant correlation between the EPC and FinDistress. This provides univariate evidence that firms facing financial distress continue to engage in risk shifting, even after the PBGC began charging higher VRPs. I fail to find a significant association between the MTR and EPC variables. However, there is a positive and significant correlation between MTR and FundedStatus. It is possible that plans whose sponsors have higher tax benefits have a higher funded status and do not need to make significant EPCs. Consistent with the control variable predictions, EPCs are positively associated with Profitability, PlanSize and Duration and negatively associated with DiscountRate and Frozen. In order to rule out the influence of multicollinearity, I examine the variance inflation factors (VIF). I note that no VIF is greater than 7.44, and these results suggest that multicollinearity is not a concern (O'Brien, 2007; untabulated).
| 1 | 2 | 3 | 4 | 5 | 6 | 7 | 8 | 9 | 10 | 11 | 12 | 13 | 14 | 15 | 16 | ||
|---|---|---|---|---|---|---|---|---|---|---|---|---|---|---|---|---|---|
| 1 | EPC | 0.284 | −0.052 | −0.010 | 0.164 | 0.005 | 0.084 | 0.084 | 0.205 | −0.078 | 0.093 | −0.108 | −0.051 | 0.056 | −0.032 | −0.016 | |
| 2 | VRP | 0.192 | 0.126 | −0.116 | −0.015 | 0.013 | −0.074 | 0.212 | 0.035 | −0.200 | 0.002 | −0.320 | −0.006 | −0.227 | −0.009 | 0.073 | |
| 3 | FinDistress | −0.182 | 0.169 | −0.125 | −0.270 | 0.132 | −0.111 | 0.088 | −0.179 | −0.065 | −0.018 | −0.068 | 0.030 | −0.062 | −0.076 | −0.010 | |
| 4 | MTR | −0.018 | −0.169 | −0.005 | 0.015 | −0.176 | −0.038 | −0.197 | −0.006 | 0.177 | −0.042 | 0.109 | 0.057 | 0.028 | 0.071 | 0.016 | |
| 5 | Profitability | 0.161 | −0.021 | −0.518 | −0.088 | 0.121 | 0.298 | 0.127 | 0.627 | 0.008 | 0.165 | −0.011 | 0.025 | 0.026 | −0.087 | −0.072 | |
| 6 | Leverage | −0.007 | 0.170 | 0.074 | −0.191 | 0.208 | 0.134 | 0.077 | 0.117 | −0.164 | 0.146 | 0.041 | −0.011 | −0.048 | −0.097 | −0.050 | |
| 7 | MTB | 0.111 | 0.012 | −0.473 | −0.130 | 0.528 | 0.325 | 0.045 | 0.303 | 0.020 | 0.125 | 0.032 | −0.016 | 0.034 | −0.089 | −0.100 | |
| 8 | Volatility | 0.107 | 0.254 | 0.062 | −0.185 | 0.202 | 0.156 | 0.083 | 0.112 | −0.194 | −0.168 | −0.361 | −0.017 | −0.036 | −0.042 | 0.066 | |
| 9 | FCF | 0.204 | 0.045 | −0.473 | −0.095 | 0.657 | 0.192 | 0.502 | 0.197 | −0.019 | 0.133 | −0.067 | −0.056 | −0.008 | −0.158 | −0.029 | |
| 10 | FundedStatus | −0.191 | −0.477 | −0.116 | 0.154 | 0.046 | −0.151 | 0.025 | −0.196 | 0.006 | 0.176 | 0.163 | 0.137 | 0.091 | 0.016 | −0.027 | |
| 11 | PlanSize | 0.021 | −0.080 | −0.221 | −0.041 | 0.186 | 0.258 | 0.250 | −0.119 | 0.155 | 0.222 | 0.751 | 0.070 | 0.069 | −0.256 | −0.363 | |
| 12 | Assets | −0.081 | −0.331 | −0.137 | 0.101 | −0.021 | 0.094 | 0.050 | −0.387 | −0.083 | 0.193 | 0.739 | 0.055 | 0.129 | −0.112 | −0.153 | |
| 13 | DiscountRate | −0.050 | −0.041 | 0.055 | 0.052 | 0.000 | −0.011 | −0.043 | −0.044 | −0.063 | 0.076 | 0.072 | 0.050 | 0.003 | 0.052 | −0.063 | |
| 14 | Duration | 0.185 | −0.346 | −0.231 | 0.019 | 0.123 | 0.013 | 0.135 | −0.044 | 0.062 | 0.079 | 0.221 | 0.204 | 0.050 | 0.120 | −0.373 | |
| 15 | InvRisk | −0.031 | −0.015 | 0.000 | 0.074 | −0.110 | −0.161 | −0.133 | −0.062 | −0.160 | −0.025 | −0.295 | −0.133 | 0.019 | 0.062 | 0.145 | |
| 16 | Frozen | −0.068 | 0.102 | 0.136 | 0.002 | −0.120 | −0.122 | −0.161 | 0.009 | −0.055 | −0.045 | −0.363 | −0.151 | −0.071 | −0.597 | 0.163 |
- Note: This table presents the Pearson (Spearman) correlation coefficients above (below) the diagonal. All bold correlations are significant at the 10% level. See Appendix A for variable definitions.
- Abbreviations: EPC, excess pension contributions; FCF, free cash flow; VRP, variable rate premium.
4.2 Multivariate results—tests of H1
Table 4 reports the estimated coefficients from Equation (1) used to test H1. The dependent variable is EPC, and the variables of interest for H1 are VRP and VRP × FinDistress. VRP × FinDistress reveals whether VRPs are incrementally more or less effective in incentivizing EPC for financially distressed firms than for all other firms. The association between VRP and EPC for firms facing financial distress is VRP + VRP × FinDistress. Columns (1) and (2) show non-entropy balanced results, and columns (3) and (4) show the entropy balanced results. Columns (1) and (3) do not include the interaction term, VRP × FinDistress, in order to establish the main effect of VRP on EPC. Columns (1) and (3) show a positive and significant main effect of VRP on EPC. The coefficient on VRP (β1) is positive and significant in column (1) (t-statistic = 2.99, p-value = 0.003) and in column (3) (t-statistic = 3.26, p-value = 0.001). These results provide evidence that plans paying VRPs make higher EPCs. This implies that the premium structure utilized by the PBGC effectively combats the put option outlined by Sharpe (1976) and Treynor (1977) and the resulting moral hazard problem. In addition, Table 4 shows that a firm's tax benefits have a positive association with EPC. The coefficient on MTR (β4) is positive and significant in column (1) (t-statistic = 1.92, p-value = 0.056) and in column (3) (t-statistic = 2.05, p-value = 0.041). This association between MTR and EPC is consistent with the findings of prior literature (Gaertner et al., 2020; Thomas, 1988).
| (1) | (2) | (3) | (4) | |
|---|---|---|---|---|
| Intercept | −0.000 | −0.001 | −0.003 | −0.004 |
| (−0.04) | (−0.29) | (−1.15) | (−1.30) | |
| VRP | 2.2025*** | 3.335*** | 2.139*** | 3.506*** |
| (2.99) | (4.24) | (3.26) | (4.52) | |
| FinDistress | −0.001 | 0.000 | −0.001** | 0.000 |
| (−1.60) | (0.89) | (−2.08) | (0.09) | |
| VRP × FinDistress | −2.978*** | −2.866*** | ||
| (−2.73) | (−2.65) | |||
| MTR | 0.002* | 0.003** | 0.003** | 0.003** |
| (1.92) | (2.09) | (2.05) | (2.08) | |
| Profitability | 0.002 | 0.002 | 0.002 | 0.002 |
| (0.78) | (0.63) | (1.05) | (0.94) | |
| Leverage | −0.001 | −0.001 | 0.000 | −0.000 |
| (−0.76) | (−1.29) | (0.08) | (−0.52) | |
| MTB | 0.000 | 0.000 | 0.000 | 0.000 |
| (1.05) | (0.93) | (1.53) | (1.39) | |
| Volatility | −0.011 | −0.012 | −0.011 | −0.012 |
| (−1.12) | (−1.12) | (−1.06) | (−1.12) | |
| FCF | 0.012*** | 0.013*** | 0.008* | 0.008** |
| (2.98) | (3.41) | (1.86) | (2.09) | |
| FundedStatus | −0.003*** | −0.003*** | −0.002* | −0.002 |
| (−3.48) | (−3.36) | (−1.77) | (−1.53) | |
| PlanSize | 0.001*** | 0.001*** | 0.001*** | 0.001*** |
| (4.19) | (3.93) | (4.18) | (3.82) | |
| Assets | −0.001*** | −0.001*** | −0.001*** | −0.001*** |
| (−3.93) | (−3.59) | (−3.83) | (−3.30) | |
| DiscountRate | 0.000 | 0.000 | 0.001* | 0.001** |
| (0.94) | (1.12) | (1.93) | (2.05) | |
| Duration | 0.002*** | 0.002*** | 0.003*** | 0.003*** |
| (5.09) | (5.08) | (4.66) | (4.60) | |
| InvRisk | −0.000 | −0.000 | −0.000 | −0.000 |
| (−0.55) | (−0.41) | (−0.26) | (−0.24) | |
| Frozen | 0.002*** | 0.002** | 0.002*** | 0.002*** |
| (2.68) | (2.60) | (2.90) | (2.76) | |
| VRP + VRP × FinDistress | 3.335 − 2.978 = 0.357 | 3.506 − 2.866 = 0.640 | ||
| Year FE | Included | Included | Included | Included |
| Industry FE | Included | Included | Included | Included |
| Clustered SE | Yes | Yes | Yes | Yes |
| N | 1506 | 1506 | 1506 | 1506 |
| Adjusted R2 | 0.188 | 0.211 | 0.199 | 0.220 |
In columns (2) and (4), I include the interaction term VRP × FinDistress in order to test whether the association between VRP and EPC is incrementally different for firms facing financial distress. Sharpe (1976) and Treynor (1977) theorize that firms facing financial distress are the firms most likely to engage in risk shifting. The coefficient on VRP × FinDistress (β3) is negative and significant in column (2) (t-statistic = −2.73, p-value = 0.007) and in column (4) (t-statistic = −2.65, p-value = 0.008). These results provide evidence that VRPs are incrementally less effective in incentivizing EPCs for firms facing financial distress. I then run an F test to determine the significance of VRP + VRP × FinDistress on EPC. The F test for column (2) reveals that the sum of VRP and VRP × FinDistress is insignificant: 3.335 + −2.978 = 0.357, p-value = 0.707, and the F test for column (4) also results in an insignificant coefficient: 3.506 + −2.866 = 0.640, p-value = 0.4881.15 There is no association between VRP and EPC for financially distressed firms.
Table 4 fails to reject the null hypothesis (H1). Although I find a significantly positive association between VRP and EPC in columns (1) and (3) (a main effect), I fail to find an association between VRP and EPC for financially distressed firms. These results imply that the current VRP structure in the United States, which does not adjust premiums based on the financial strength of the plan sponsor, fails to fully combat risk shifting behavior among financially distressed firms.
4.3 Multivariate results—tests of H2
The variable of interest for H2 is the sum of VRP + VRP × FinDistress (β1 + β3). In Table 5, columns (1), (2) and (5) do not employ entropy balancing, and columns (3), (4) and (6) do employ entropy balancing. Columns (1), (3), (5) and (6) capture sample firm-years that have tax benefits associated with defined benefit contributions, and columns (2) and (4) capture sample firm-years that have low tax benefits. Using an F test, I find that the sum of coefficients on VRP + VRP × FinDistress (β1 + β3) is insignificant across all columns (p-values across columns range from 0.286 to 0.881).
Overall, these results provide evidence that VRPs continue to be significantly less effective in incentivizing EPCs for firms facing financial distress, even in the presence of tax benefits. Financially distressed firms with high tax benefits related to defined benefit contributions still appear to engage in risk shifting. These results also address the lack of empirical evidence on the interaction of tax and nontax factors impacting deferred compensation noted by Shackelford and Shevlin (2001) by demonstrating that financially distressed firms continue to make significantly lower EPCs than other firms, even in the presence of two incentives for pension funding, tax benefits and risk adjusted premiums.
| (1) | (2) | (3) | (4) | (5) | (6) | |
|---|---|---|---|---|---|---|
| HighMTR | LowMTR | HighMTR | LowMTR | Taxpayer | Taxpayer | |
| Intercept | −0.001 | 0.000 | −0.005 | −0.002 | −0.000 | −0.004 |
| (−0.41) | (0.00) | (−1.54) | (−0.41) | (−0.13) | (−1.10) | |
| VRP | 3.563*** | 3.493*** | 3.589*** | 3.660*** | 3.264*** | 3.338*** |
| (3.84) | (3.01) | (3.96) | (3.20) | (4.01) | (4.12) | |
| FinDistress | 0.000 | −0.000 | 0.001 | −0.000 | 0.000 | −0.000 |
| (1.05) | (−0.02) | (1.21) | (−0.33) | (0.31) | (−0.49) | |
| VRP × FinDistress | −2.141 | −3.622*** | −2.224* | −3.527*** | −2.793** | −2.629** |
| (−1.58) | (−2.83) | (−1.66) | (−2.74) | (−2.27) | (−2.16) | |
| Profitability | 0.006* | −0.002 | 0.006** | −0.001 | 0.002 | 0.002 |
| (1.83) | (−0.51) | (2.07) | (−0.22) | (0.55) | (0.75) | |
| Leverage | −0.002 | 0.000 | −0.001 | −0.000 | −0.001 | −0.000 |
| (−1.32) | (0.01) | (−0.67) | (−0.05) | (−1.13) | (−0.33) | |
| MTB | 0.000 | −0.000 | 0.000 | −0.000 | 0.000 | 0.000 |
| (1.16) | (−0.89) | (1.27) | (−0.00) | (0.92) | (1.54) | |
| Volatility | 0.008 | −0.024* | 0.020 | −0.027** | −0.014 | −0.019 |
| (0.72) | (−1.74) | (1.41) | (−2.23) | (−1.29) | (−1.61) | |
| FCF | 0.012** | 0.013** | 0.010 | 0.011** | 0.014*** | 0.012*** |
| (2.15) | (2.57) | (1.59) | (2.29) | (3.18) | (2.62) | |
| FundedStatus | −0.003** | −0.003** | −0.003** | −0.002 | −0.003*** | −0.003* |
| (−2.48) | (−2.24) | (−2.04) | (−1.11) | (−2.71) | (−1.97) | |
| PlanSize | 0.001*** | 0.001*** | 0.001*** | 0.001*** | 0.001*** | 0.001*** |
| (3.07) | (2.90) | (3.20) | (2.82) | (3.64) | (3.82) | |
| Assets | −0.001** | −0.001*** | −0.001** | −0.001*** | −0.001*** | −0.001*** |
| (−2.52) | (−2.85) | (−2.41) | (−2.93) | (−3.42) | (−3.65) | |
| DiscountRate | 0.000 | 0.001 | 0.001* | 0.001 | 0.001 | 0.001** |
| (0.81) | (0.81) | (1.84) | (0.96) | (0.98) | (2.14) | |
| Duration | 0.002*** | 0.002*** | 0.003*** | 0.003*** | 0.002*** | 0.003*** |
| (4.50) | (3.76) | (4.35) | (3.50) | (4.76) | (4.51) | |
| InvRisk | 0.000 | −0.000 | −0.000 | −0.000 | −0.000 | −0.000 |
| (0.30) | (−0.51) | (−0.51) | (−0.19) | (−0.47) | (−0.69) | |
| Frozen | 0.003*** | 0.002 | 0.003*** | 0.002* | 0.002** | 0.002*** |
| (2.91) | (1.16) | (2.89) | (1.82) | (2.45) | (2.98) | |
| VRP + VRP*FinDistress | 3.563 − 2.141 = 1.422 | 3.492 − 3.622 = −0.129 | 3.589 − 2.224 = 1.365 | 3.660 − 3.527 = 0.133 | 3.264 − 2.793 = 0.471 | 3.338 − 2.629 = 0.709 |
| Year FE | Included | Included | Included | Included | Included | Included |
| Industry FE | Included | Included | Included | Included | Included | Included |
| Clustered SE | Yes | Yes | Yes | Yes | Yes | Yes |
| N | 880 | 626 | 880 | 626 | 1348 | 1348 |
| Adjusted R2 | 0.233 | 0.193 | 0.239 | 0.229 | 0.210 | 0.231 |
4.4 Multivariate results—tests of H3
Entropy balancing is not necessary for the testing of H3 in Table 6 as I run regressions on firm-years grouped by similar VRPs. The variable of interest for H3 is VRP (β1). Column (1) shows results for sample firms with a high COD and a high VRP (HighHigh). There is no association between VRP and EPC for firms with higher borrowing costs that are also paying a higher VRP. This result may suggest that firms facing high borrowing costs prioritize paying down balance sheet debt over making pension contributions, which would be consistent with the corporate financial perspective. Column (2) shows results for sample firms with a low COD and a low VRP (LowLow). Again, the coefficient on β1 is insignificant. Firms with a low COD and low VRPs are not incentivized to make EPCs. Column (3) shows results for sample firms with a high COD and a low VRP (HighLow). The coefficient on VRP (β1) remains insignificant, suggesting that firms with a high COD and low VRPs do not make EPCs. This group of firms has the lowest combined incentive to make EPCs, so these results are somewhat unsurprising. Column (4) provides results for firms with a low COD and a high VRP (LowHigh). The coefficient on VRP (β1) is positive and significant (t-statistic = 2.00, p-value = 0.048) for this group. Firms facing low borrowing costs in conjunction with a high VRP do make EPCs. These results hold when I eliminate firms from the sample who do not pay VRPs. Overall, these results seem to support the corporate financial perspective, which states that pension funding decisions are incorporated into a firm's corporate financial policy. High VRPs do not seem to incentivize firms to make EPCs when firms are also facing high borrowing costs. However, there is a positive association between these premiums and EPCs for firms with lower borrowing costs. There is no association between VRPs and EPCs for firms with lower premiums, regardless of borrowing costs.
| (1) | (2) | (3) | (4) | |
|---|---|---|---|---|
| HighHigh | LowLow | HighLow | LowHigh | |
| Intercept | 0.000 | −0.000 | −0.001 | −0.013* |
| (0.08) | (−0.10) | (−0.29) | (−1.91) | |
| VRP | 0.385 | −5.447 | 0.463 | 2.962** |
| (0.38) | (−1.56) | (0.07) | (2.00) | |
| MTR | 0.002 | 0.001 | 0.000 | 0.001 |
| (0.72) | (0.38) | (0.17) | (0.25) | |
| Profitability | 0.000 | 0.004 | 0.010* | 0.011 |
| (0.07) | (1.34) | (1.91) | (1.45) | |
| Leverage | −0.004** | 0.001 | −0.001 | 0.001 |
| (−2.24) | (1.12) | (−0.65) | (0.58) | |
| MTB | 0.000** | −0.000 | 0.000* | 0.000* |
| (2.17) | (−0.70) | (1.66) | (1.75) | |
| Volatility | −0.057** | −0.003 | 0.009 | 0.042 |
| (−2.41) | (−0.21) | (0.57) | (1.38) | |
| FCF | 0.022** | 0.006 | 0.007 | 0.027*** |
| (2.54) | (0.89) | (1.11) | (2.81) | |
| FundedStatus | −0.009* | −0.002 | −0.003* | 0.004 |
| (−1.86) | (−1.30) | (−1.83) | (0.76) | |
| PlanSize | 0.002*** | 0.001*** | 0.001** | 0.001 |
| (3.59) | (3.45) | (2.38) | (1.08) | |
| Assets | −0.001* | −0.001*** | −0.001** | 0.000 |
| (−1.89) | (−3.05) | (−2.44) | (0.11) | |
| DiscountRate | −0.000 | 0.000 | 0.000 | −0.000 |
| (−0.23) | (0.22) | (0.54) | (−0.09) | |
| Duration | 0.004*** | 0.002*** | 0.002*** | 0.003** |
| (3.20) | (3.78) | (3.15) | (1.99) | |
| InvRisk | 0.000 | −0.000 | 0.000 | −0.000 |
| (0.17) | (−0.55) | (0.52) | (−0.34) | |
| Frozen | 0.005** | 0.002*** | 0.001 | 0.004** |
| (2.43) | (2.43) | (1.48) | (2.35) | |
| Year FE | Included | Included | Included | Included |
| Industry FE | Included | Included | Included | Included |
| Clustered SE | Yes | Yes | Yes | Yes |
| N | 371 | 356 | 294 | 262 |
| Adjusted R2 | 0.159 | 0.154 | 0.225 | 0.269 |
4.5 Additional analysis
I reestimate Equation (1) using two different measures of financial distress. The first measure is the Altman (1968) Z-score calculated following Edwards et al. (2016). I classify firm-years in the lowest quartile of industry adjusted Z-score as financially distressed firm-years. The non-entropy balanced results for Z-score are shown in column (1) of Table 7, and the entropy balanced results are shown in column (3). Column (1) indicates that VRP is significantly positively associated with EPC for firm-years that are not financially distressed (t-statistic = 2.10, p-value = 0.037), and column (3) provides consistent results (t-statistic = 2.43, p-value = 0.016). However, the F test for column (1) reveals that sum of VRP and VRP × VRP × FinDistress is insignificant: 1.763 + −1.631 = 0.132, p-value = 0.892, and the F test for column (3) also results in an insignificant coefficient: 1.984 + 1.561 = 0.423, p-value = 0.650. There is no association between VRP and EPC for firm-years that are financially distressed.
| (1) | (2) | (3) | (4) | |
|---|---|---|---|---|
| Z-Score | O-Score | Z-Score | O-Score | |
| Intercept | −0.003 | −0.002 | −0.007** | −0.005 |
| (−0.97) | (−0.56) | (−2.17) | (−1.64) | |
| VRP | 1.763** | 2.278** | 1.984*** | 2.597*** |
| (2.10) | (2.51) | (2.43) | (2.86) | |
| FinDistress | −0.000 | 0.001 | −0.000 | 0.001 |
| (−0.05) | (0.86) | (0.46) | (0.96) | |
| VRP*FinDistress | −1.631*** | −1.869 | −1.561*** | −1.890 |
| (−1.19) | (−1.42) | (−1.17) | (−1.48) | |
| MTR | 0.001 | 0.002 | 0.002 | 0.002 |
| (0.84) | (1.04) | (1.20) | (1.36) | |
| Profitability | 0.002 | 0.003 | 0.003 | 0.004** |
| (0.61) | (1.06) | (1.29) | (1.97) | |
| Leverage | 0.000 | −0.000 | 0.001 | 0.000 |
| (0.23) | (−0.24) | (0.80) | (0.13) | |
| MTB | 0.000 | 0.000 | 0.000 | 0.000 |
| (1.20) | (0.98) | (1.63) | (1.57) | |
| Volatility | −0.008 | −0.003 | −0.010 | −0.009 |
| (−0.77) | (−0.31) | (−0.85) | (−0.74) | |
| FCF | 0.017*** | 0.016*** | 0.011** | 0.010** |
| (4.00) | (3.66) | (2.51) | (2.23) | |
| FundedStatus | −0.006*** | −0.006*** | −0.004*** | −0.003** |
| (−3.20) | (−3.01) | (2.67) | (−1.99) | |
| PlanSize | 0.002*** | 0.002*** | 0.002*** | 0.001*** |
| (4.94) | (4.73) | (4.88) | (4.41) | |
| Assets | −0.002*** | −0.001*** | −0.001*** | −0.001*** |
| (−4.76) | (−4.72) | (−4.16) | (−3.84) | |
| DiscountRate | 0.001 | 0.000 | 0.001** | 0.001* |
| (1.36) | (1.07) | (2.23) | (1.89) | |
| Duration | 0.003*** | 0.003*** | 0.003*** | 0.003*** |
| (4.91) | (5.06) | (4.92) | (5.07) | |
| InvRisk | 0.000 | −0.000 | −0.000 | 0.000 |
| (0.17) | (−0.04) | (−0.00) | (0.13) | |
| Frozen | 0.003*** | 0.003** | 0.003*** | 0.003*** |
| (2.73) | (2.42) | (3.13) | (2.72) | |
| VRP + VRP × FinDistress | 1.763 + −1.631 = 0.132 | 2.278 + −1.869 = 0.409 | 1.984 + −1.561 = 0.423 | 2.597 + −1.890 = 0.707 |
| Year FE | Included | Included | Included | Included |
| Industry FE | Included | Included | Included | Included |
| Clustered SE | Yes | Yes | Yes | Yes |
| N | 1199 | 1211 | 1199 | 1211 |
| Adjusted R2 | 0.167 | 0.174 | 0.194 | 0.198 |
I also measure financial distress using the Ohlson (1980), O-score. I classify firm-years in the highest quartile of industry adjusted O-score as financially distressed firm-years. The non-entropy balanced results for O-score are shown in column (2) of Table 7, and the entropy balanced results are shown in column (4). Column (2) indicates that VRP is significantly positively associated with EPC for firm-years that are not financially distressed (t-statistic = 2.51, p-value = 0.013), and column (4) provides consistent results (t-statistic = 2.86, p-value = 0.005). However, once again, there is no association between VRP and EPC for firm-years that are financially distressed. The F test shows that the sum of VRP + VRP × FinDistress is insignificant in column (2): 2.278 + −1.869 = 0.409, p-value = 0.648 and in column (4): 2.597 + −1.890 = 0.707, p-value = 0.398. The results of these additional analyses are consistent with the test of H1 in Table 4 and indicate that VRPs do not incentivize financially distressed firms to make EPCs. Financially distressed firms in the United States continue to engage in risk shifting since PBGC's VRPs do not specifically target these firms.
Next, I reestimate Equation (1) separately on each year in the sample. Table 8 Panel A shows the non-entropy balanced regression results, and Panel B shows the entropy balanced regression results.16 The association between VRP and EPC for financially distressed firms is shown by summing VRP and VRP × FinDistress. VRP + VRP × FinDistress is significant in two of the five columns shown in Panel A. It is significantly positive in column 2: 5.304 + −1.321 = 3.983 (F-statistic = 8.56, p-value = 0.004). This result indicates a positive association between VRP and EPC for financially distressed firms in 2015 and provides some evidence that VRPs helped to combat risk shifting by financially distressed firms in 2015. VRPs increased 71% from 2014 to 2015, the largest percentage increase in VRPs in PBGC history. VRP + VRP × FinDistress is significantly negative in column (5): 0.695 + −1.320 = −0.625 (F-statistic = 4.23, p-value = 0.041). This result indicates a negative association between VRPs and EPCs for financially distressed firms in 2018 and is indicative of risk shifting by financially distressed firms. These results provide some evidence that the rising VRPs initially had limited success in incentivizing financially distressed firms to make EPCs.
In Panel B, VRP + VRP × FinDistress continues to be significant in 2015, column 2: 5.084 + −1.497 = 3.587 (F-statistic = 7.36, p-value = 0.007). However, the sum of VRP and VRP × FinDistress is insignificant in column (5) indicating no association between VRPs and EPCs for financially distressed firms in 2018 after controlling for differences between variable premium paying firms and non-variable premium paying firms by employing the entropy balancing technique. Overall, the results in Table 8 fail to provide evidence that the increasing VRPs implemented by Congress have been successful in consistently combating risk shifting behavior among financially distressed firms.
| Panel A: Non-entropy balanced results | |||||
|---|---|---|---|---|---|
| (1) | (2) | (3) | (4) | (5) | |
| 2014 | 2015 | 2016 | 2017 | 2018 | |
| Intercept | 0.001 | −0.005 | −0.007 | −0.001 | 0.006 |
| (0.27) | (−1.08) | (−1.34) | (−0.20) | (1.64) | |
| VRP | 6.898*** | 5.304** | 1.026 | 4.617*** | 0.695 |
| (5.05) | (2.41) | (1.00) | (3.06) | (0.69) | |
| FinDistress | 0.001* | −0.001 | 0.001 | 0.001 | −0.000 |
| (1.96) | (−0.68) | (0.81) | (0.42) | (−0.03) | |
| VRP × FinDistress | −7.887*** | −1.321 | −0.990 | −6.061*** | −1.320 |
| (−4.75) | (−0.57) | (−0.88) | (−3.15) | (−1.23) | |
| MTR | 0.001 | 0.003 | 0.002 | 0.008** | 0.008* |
| (0.34) | (1.60) | (1.01) | (2.17) | (1.91) | |
| VRP + VRP × FinDistress | 6.898 + −7.887 = −0.989 | 5.304 + −1.321 = 3.983*** | 1.026 + −0.990 = 0.036 | 4.617 + 6.061 = −1.444 | 0.695 + −1.320 = −0.625** |
| Year FE | Not included | Not included | Not included | Not included | Not included |
| Industry FE | Included | Included | Included | Included | Included |
| Clustered SE | Yes | Yes | Yes | Yes | Yes |
| N | 323 | 310 | 305 | 290 | 278 |
| Adjusted R2 | 0.288 | 0.218 | 0.146 | 0.276 | 0.084 |
| Panel B: Entropy balanced results | |||||
|---|---|---|---|---|---|
| (1) | (2) | (3) | (4) | (5) | |
| 2014 | 2015 | 2016 | 2017 | 2018 | |
| Intercept | −0.003 | −0.008* | −0.010** | −0.006 | 0.007 |
| (−0.57) | (−1.74) | (−1.98) | (−0.70) | (1.56) | |
| VRP | 6.627*** | 5.084** | 1.206 | 4.637*** | 0.757 |
| (4.25) | (2.47) | (1.14) | (3.12) | (0.69) | |
| FinDistress | 0.000 | −0.001 | 0.000 | −0.000 | 0.000 |
| (0.48) | (−0.74) | (0.21) | (−0.19) | (0.44) | |
| VRP × FinDistress | −7.250*** | −1.497 | −0.838 | −5.913*** | −1.302 |
| (−3.86) | (−0.66) | (−0.73) | (−3.09) | (−1.16) | |
| MTR | 0.003 | 0.002 | 0.002 | 0.005 | 0.007 |
| (1.13) | (1.12) | (0.89) | (1.31) | (1.54) | |
| VRP + VRP × FinDistress | 6.627 + −7.250 = −0.623 | 5.084 + −1.497 = 3.587*** | 1.206 + −0.838 = 0.368 | 4.637 + −5.913 = −1.276 | 0.757 + −1.302 = −0.545 |
| Year FE | Not included | Not included | Not included | Not included | Not included |
| Industry FE | Included | Included | Included | Included | Included |
| Clustered SE | Yes | Yes | Yes | Yes | Yes |
| N | 323 | 310 | 305 | 290 | 278 |
| Adjusted R2 | 0.278 | 0.232 | 0.138 | 0.344 | 0.079 |
Finally, I perform one additional cross-sectional test. I replace FinDistress from Equation (2) with HighRD. HighRD is an indicator variable equal to one if an observation falls within the highest industry and year adjusted quartile of research and development (R&D) expense scaled by lagged assets, zero otherwise. Rauh (2006) did not find an association between required pension contributions and R&D. He suggested that R&D may consist largely of fixed costs, such as salary payments to engineers and scientists. If R&D payments are difficult to adjust, firms with high R&D may not be able to make EPC, even in the face of increasing VRPs. Column (1) of Table 9 shows results for the non-entropy balanced sample, and column (2) shows results for the entropy balanced sample. The sum of VRP and VRP × HighRD represents the association between VRP and EPC for HighRD firm-years. The sum of VRP and VRP × HighRD is insignificant in column (1): 2.108 + −0.645 = 1.463, p-value = 0.246 and in column (2): 2.305 + −0.976 = 1.329, p-value = 0.281. There is no association between VRP and EPC for firms with high R&D costs. These results provide another example of VRPs failing to effectively incentivize EPCs.
| (1) | (2) | |
|---|---|---|
| Intercept | −0.001 | −0.005 |
| (−0.29) | (−1.52) | |
| VRP | 2.108*** | 2.305** |
| (2.94) | (3.32) | |
| HighRD | 0.000 | 0.001 |
| (0.49) | (0.94) | |
| VRP × HighRD | −0.645 | −0.976 |
| (−0.49) | (−0.75) | |
| MTR | 0.002* | 0.003** |
| (1.96) | (2.00) | |
| Profitability | 0.003 | 0.003 |
| (1.08) | (1.46) | |
| Leverage | −0.001 | −0.001 |
| (−1.23) | (−0.68) | |
| MTB | 0.000 | 0.000 |
| (1.08) | (1.57) | |
| Volatility | −0.012 | −0.013 |
| (−1.25) | (−1.24) | |
| FCF | 0.013*** | 0.009** |
| (3.23) | (2.21) | |
| FundedStatus | −0.003*** | −0.002* |
| (−3.55) | (−1.85) | |
| PlanSize | 0.001*** | 0.001*** |
| (4.16) | (4.07) | |
| Assets | −0.001*** | −0.001*** |
| (−3.87) | (−3.68) | |
| DiscountRate | 0.000 | 0.001** |
| (1.09) | (2.21) | |
| Duration | 0.002*** | 0.003*** |
| (5.10) | (4.59) | |
| InvRisk | −0.000 | −0.000 |
| (−0.41) | (−0.24) | |
| Frozen | 0.002*** | 0.002*** |
| (2.66) | (2.87) | |
| VRP + VRP × HighRD | 2.108 + −0.645 = 1.463 | 2.305 + −0.976 = 1.329 |
| Year FE | Included | Included |
| Industry FE | Included | Included |
| Clustered SE | Yes | Yes |
| N | 1283 | 1283 |
| Adjusted R2 | 0.186 | 0.197 |
- Note: This table presents the estimated coefficients from Equation (1) with HighRD replacing FinDistress. See Appendix for variable definitions.
- Abbreviations: FCF, free cash flow; VRP, variable rate premium.
- “*,” “**,” “***” denote significance at the 0.10, 0.05 and 0.01 levels, respectively, in two-tailed tests.
5 CONCLUSION
Prior studies have focused on the tax incentives associated with defined benefit contributions (Gaertner et al., 2020; Thomas, 1988). This is the first study to examine the comprehensive package of US government incentives that promote higher pension funding levels. In addition to tax incentives, which positively reinforce pension contributions, the government also requires sponsors of defined benefit plans to pay insurance premiums to the PBGC. The PBGC charges underfunded plans an additional VRP designed to negatively reinforce pension funding. As millions of employees, beneficiaries and retirees rely or will rely on pension income, it is important to understand whether these current government incentives effectively motivate pension investment.
This study first establishes that VRPs charged by the PBGC are positively associated with defined benefit pension funding, implying that, in the aggregate, plan sponsors contribute more to their pension plans in order to avoid future VRPs. Nonetheless, I find that the association between VRPs and EPCs does not exist for firms facing financial distress. Ideally, VRPs should be targeting financially distressed firms in order to reduce the net amount of pension benefits that are ultimately paid out by the PBGC when the sponsors of defined benefit plans are unable to pay out benefits. However, I find that VRPs do not effectively incentivize pension funding from financially distressed firms. Next, I find that the lack of association between VRPs and EPCs persists for financially distressed firms even when these firms have high tax benefits associated with pension funding. This finding is important because the government provides strong tax benefits related to defined benefit funding, and these results suggest that two significant government incentives, tax benefits and risk adjusted premiums, collectively fail to incentivize pension funding for financially distressed firms. Finally, I find that the association between VRPs and EPCs holds only for firms facing low borrowing costs and high premiums.
This is the first study, to my knowledge, to examine whether both tax incentives and VRPs are significant determinants of EPCs. This study provides evidence that these incentives are effective, in the aggregate, at incentivizing defined benefit contributions. However, finding that these dual incentives fail to prevent risk shifting among financially distressed firms is relevant for several reasons. First, tax incentives for pension contributions decreased under the TCJA, which means that VRPs may be a more important incentive in future years. Second, the GAO released a report in 2012 suggesting that the PBGC was in danger of becoming insolvent. The GAO presented several options for Congress to act in response to this report, and Congress chose not to expand the basis for assigning premiums to include risk factors, such as the financial strength of the firm sponsor. Congress did increase premiums beginning in 2014, but premiums are assigned based solely on a plan's underfunding. The results of this paper show that current PBGC premium policy is not able to curb risk shifting by financially distressed US firms. These findings contrast with the findings of Guan and Lui (2016) who find that risk adjusted premiums implemented by the United Kingdom helped to curb risk shifting behavior among financially distressed firms. The results of this paper suggest that countries without mandatory full pension funding requirements should carefully consider the most appropriate premium structure to target risk shifting behavior by financially distressed firms—the firms most likely to need governmental support in the future.
ACKNOWLEDGMENTS
I appreciate the guidance and support provided by my dissertation committee chair, William C. Schwartz and committee members, Bradley Blaylock, Teresa Lightner and Ramesh Rao. I also appreciate the comments and assistance of my anonymous reviewer, John Campbell, Marshall Geiger, Mollie Mathis, Eric Rapley, John Robinson, Scott White, participants in the 2018 AAA Deloitte Doctoral Consortium, including Anne Christensen and Diana Falsetta, participants in the 2020 ATA Midyear Meeting, including Herita Akama, workshop participants at the University of Richmond, the University of New Hampshire, the University of Alabama at Birmingham and Creighton University.
APPENDIX A: VARIABLE DEFINITIONS
| Assets | Natural log of assets (AT) |
|---|---|
| COD | Interest expense (XINT) divided by average debt for t and t − 1 (DLC + DLTT) |
| DiscountRate | Discount rate actuarial assumption (PBARR) |
| Duration | Annual pension service cost (PPSC) divided by the sum of service and interest costs (PPIC) |
| EPC | Obtained from the DOL (http://www.dol.gov/agencies/ebsa/about-ebsa/our-activities/public-disclosure/foia/form-500-datasets) SB_PRESENT_VAL_EXCES_CONT_AMT scaled by lagged assets (AT) |
| FCF | Operating cash flows (OANCF) before pension contributions (PBEC) and less capital expenditures (CAPX) scaled by lagged assets (AT) |
| FinDistress | An indicator variable equal to one if an observation falls within the highest quartile of probability of default, zero otherwise. Probability of default data based on Merton (1974) model and obtained from https://nuscri.org/en |
| Frozen | An indicator variable equal to one when reported service cost (PPSC) is zero and zero otherwise |
| FundedStatus | Fair value of pension assets (PPLAO + PPLAU) less the projected benefit obligation (PBPRO) scaled by the projected benefit obligation (PBPRO) |
| HighRD | An indicator variable equal to one if an observation falls within the highest industry and year adjusted quartile of research and development expense (XRD) divided by lagged assets (AT), zero otherwise |
| InvRisk | Proportion of plan assets invested in equity securities (PNATE) |
| Leverage | Total long-term debt (DLTT) scaled by lagged assets (AT) |
| MTB | Market value (PRCC_F*CSHO) scaled by book value (CEQ) |
| MTR | Simulated marginal tax rate (after financing) obtained from John Graham's website (https://faculty.fuqua.duke.edu/∼jgraham/taxform.html) |
| O-Score |
Based on Ohlson (1980), calculated as −1.32 −4.07(log(AT/gross national product price index level) + 6.03(LT/AT) − 1.43((ACT − LCT)/AT) + 0.0757(LCT/ACT) − 1.72 × X − 2.37(IB/AT) − 1.83((PI_DP)/LT) − 2.85 × Y − 0.521 × Z where X is equal to one if LT > AT and zero otherwise, Y is equal to one if IB and lagged IB are both negative and zero otherwise, and Z is equal to (IB − lagged IB)/(Abs(IB) + Abs(lagged IB)) |
| PlanSize | The natural log of plan assets (PPLAO + PPLAU) |
| Profitability | Average return on assets (IBt + IBt − 1/2) scaled by lagged assets (AT) |
| Taxpayer | Following Gaertner et al. (2020) precontribution tax incentive: Equal to one if federal income taxes (TXFED) plus pension employer contribution (PBEC) multiplied by the top statutory tax rate for pension contributions during the sample period (35%) is greater than zero, and zero otherwise |
| Volatility | Standard deviation of cash flows from operations (OANCF less PBEC) scaled by lagged assets (AT) for current and previous 4 years |
| VRP | Variable rate premiums charged by the PBGC (in millions) scaled by lagged assets (AT). Obtained via a Freedom of Information Act request to the PBGC. |
| Z-Score | Based on Altman (1968) Z-score and following Edwards et al. (2016), calculated as 1.2((ACT − LCT)/AT) + 1.4(RE/AT) + 3.3((PI + XINT)/AT) + 0.6((CSHO × PRCC_F)/LT) + SALE/AT |
APPENDIX B: PBGC PREMIUM EXAMPLE: DELTA AIRLINES
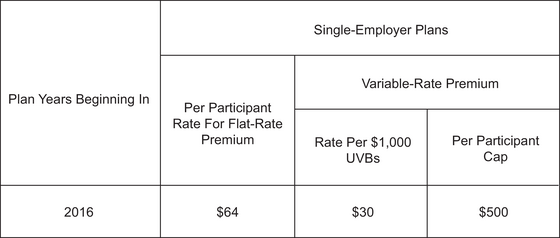
- Delta Airlines has 86,898 plan participants in its defined benefit for its plan-year ending on March 31, 2017.
- Delta's flat rate premium is $5.6 million.17
- Delta has $5.1 billion in unfunded vested benefits.18 Without the per participant cap in place, Delta would owe a variable rate premium of $153 million.19
- Due to the per participant cap, Delta owes an additional variable rate premium of $43.4 million.20
Open Research
DATA AVAILABILITY STATEMENT
The data that support the findings of this study are available from the corresponding author upon reasonable request.
REFERENCES
- 1 Under Generally Accepted Accounting Principles (GAAP), an underfunded plan is a plan with a projected benefit obligation (PBO) that is higher than the fair value of the plan assets (FVPA). If the FVPA are higher than the PBO, the plan is overfunded. The PBO is the present value of the total retirement benefits earned by employees using estimated future compensation levels.
- 2 Section 430 of the Internal Revenue Code outlines the amount of mandatory pension contributions that firms are required to make. Any voluntary contribution made in excess of this required amount is a discretionary or excess contribution.
- 3 During bankruptcy proceedings for United Airlines in 2005, the PBGC agreed to pay out $6.6 billion of United Airline's total $9.8 billion in pension liabilities. The amount that the PBGC pays out when a pension plan terminates depends on retiree age and the amount of pension investment the plan had when it terminated.
- 4 For the remainder of this paper, when I reference fully funded plans (plans with FVPA equal to PBO), I am referring to defined benefit pension plans that are either fully funded or overfunded according to the GAAP definition of funding. See footnote 1 for the GAAP definition of funding.
- 5 The Pension Protection Act of 2006 increased the tax benefits related to defined benefit retirement plans. Under this law, sponsors may deduct pension contributions that contribute to the overfunding of their plans rather than receiving deductions only up to the point where their plans are fully funded.
- 6 The PBGC defines unfunded vested benefits as “the excess, if any, of the premium funding target over the fair market value of the plan assets.” See https://www.pbgc.gov/prac/prem/help/instructions/2012/HowToDetermineUVB.htm). Firms calculate their funding target based on ERISA 303, which stipulates minimum funding requirements for defined benefit plans. The premium funding target refers to vested benefits under the plan rather than all benefits. For financial reporting purposes, a plan is underfunded when the projected benefit obligation (PBO) exceeds the fair market value of plan assets (FVPA). The PBO considers all pension benefits that will be owed to plan participants, rather than just vested benefits.
- 7 The variable rate premium will not be as strong of an incentive for plan sponsors that are subject to the per-participant cap because their variable rate premiums are limited. The per-participant cap in place biases against finding a significantly positive association between variable rate premiums and excess pension contributions.
- 8 Stock options provide an example of compensation that incentivizes risk taking. Stock options are more valuable when stock volatility increases because there is a higher chance of reaching the option price. Therefore, management is more likely to take more risks in order to increase stock volatility.
- 9 The U S Government Accountability Office (GAO) published a 95-page report in November 2012 that outlines two main options to adjust the PBGC's premium structure (GAO, 2012). The first option, and the one ultimately chosen by Congress, was to increase premium rates using the existing premium structure. The second option was to redesign the premium structure to consider additional risk factors beyond underfunding as underfunding by itself is a “poor proxy for the risk of new claims” (GAO, 2012). The report repeatedly references the risk structure incorporated by the Protection Fund (PPF) in the United Kingdom in support of this second option. Related to the report, the GAO's website recommends that Congress implement a premium structure to appropriately “reflect the risk posed by plans,” and it suggests “the incorporation of additional risk factors” (https://www.gao.gov/products/gao-13-58). In addition, members of Congress commented that the GAO's report was “instrumental in their deliberations and influenced the resultant PBGC premium increase” (https://www.gao.gov/products/gao-13-58).
- 10 The DOL compiles the information from Form 5500 filings by year. These datasets are available via the DOL's website at https://www.dol.gov/agencies/ebsa/about-ebsa/our-activities/public-disclosure/foia/form-5500-datasets. Beginning with 2009 plan years, the DOL requires that plan sponsors file the Form 5500 and related schedules electronically. Previously, the DOL accepted paper copies of the Form 5500 and related schedules.
- 11 Under cost-plus or reimbursable contracts, firms are reimbursed for their expenses. Defense contractors and public utilities typically operate under cost-plus or reimbursable contracts. These contracts incentivize firms to overfund their defined benefit plans, regardless of the pension funding incentives in place.
- 12 Appendix A includes all variable definitions.
- 13 We note that Armitage et al. (2023) provided evidence in a United Kingdom setting that plan sponsors use flexibility in allowed discount rates to alter funded status outcomes. They provide evidence that firms use discount rates to reduce both reported deficits and surpluses.
- 14 Bond spreads are often used as a measure of a firm's cost of debt. Within the sample, I was only able to calculate bond spread for 372 firm-year observations. This small size of this subsample does not allow for a meaningful test.
- 15 There are 376 financially distressed firms and 1130 non-financially distressed firms in the sample. If I split the sample into financially distressed firms and non-financially distressed firms, the coefficient on VRP is insignificant and has a t-statistic = −0.44 and a p-value = 0.660 for the sample of financially distressed firms. The coefficient on VRP is significantly positive and has a t-statistic = −4.22 and a p-value = 0.000 for the sample of non-financially distressed firms. Results are consistent for entropy balanced sample splits.
- 16 For brevity, I exclude presentation of most control variable results from Table 8.
- 17 A total of 86,898 participants multiplied by a flat rate premium of $64 per participant.
- 18 Unfunded vested benefits are calculated by taking the vested funding target for all participants ($9.5 billion) less the market value of plan assets ($4.1 billion).
- 19 Divide $5.1 billion in unfunded vested benefits by $1000 and multiply by a variable rate premium of $30 per participant.
- 20 A total of 86,898 participants multiplied by a variable rate premium of $500 per participant.