Patient-based feedback control for erythroid variables obtained using in-house automated hematology analyzers in veterinary medicine
Abstract
Background
Automated in-house diagnostic analyzers, most commonly used for hematologic and biochemical analysis, are typically calibrated, and then control materials are used to confirm the quality of results. Although this approach provides indirect knowledge that the system is performing correctly, it does not provide direct knowledge of system performance between control runs.
Objectives
The objectives of this study were to apply analysis of weighted moving averages to assess performance of hematology analyzers using animal patient samples from dogs, cats, and horses as they were analyzed and apply correction factors to mitigate instrument-driven biases when they developed.
Methods
A set of algorithms was developed and applied to sequential batches of 20 samples. Repeated samples within a batch and large populations of samples with similar abnormalities were excluded. Data for 6 hematologic variables were grouped into batches of weighted moving averages; data were analyzed with control chart rules, a gradient descent algorithm, and fuzzy logic to define and apply adjustments.
Results
A total of 102 hematology analyzers that had developed biases in RBC count, HCT, hemoglobin (HGB) concentration, MCV, MCH, and MCHC were evaluated. Following analysis, all variables except HGB concentration required adjustment, with RBC counts requiring only slight change and MCV requiring the greatest change. Adjustments were validated by comparing PCVs with the original and adjusted HCT values.
Conclusions
The proposed system provides feedback control to minimize system bias for RBC count, HCT, HGB concentration, MCV, MCH, and MCHC. Fundamental assumptions must be met for the approach to assure proper functionality.
Introduction
Several studies about patient-based quality assurance for automated analyzers have been published. Subsets of these studies have demonstrated that patient-based results can provide information regarding analyzer performance.1 The general focus of other investigations was to qualify each patient result as a basis for what is reported, and this was also the reason for discarding the approach.2 There is a fundamental flaw in the latter approach, as a single patient result cannot be used to determine if it is appropriate to report it. If the focus is changed slightly to monitor the system performance of the instrument using population data generated from aggregated patient results, then the approach has power and will provide reliable information regarding overall performance.
Weighted moving averages have been used since 1974 for analysis of human hematology analyzer performance, starting with Bull's moving averages (sometimes referred to as X − B or ).3 Bull modeled many different batch sample sizes and recommended 20, based on experience with state-of-the-art human reference hematology analyzers. Alternative methodology has been introduced and implemented, including exponentially weighted moving averages (sometimes referred to as EWMA, XM, or
 ).4 In automated hematology analyzers used for human samples, fixed-cell controls are commonly used to determine and track instrument performance and confirm calibration settings. One benefit of the analysis of weighted averages that are performed on patient samples run on the analyzer is that it fills the gap between control runs, which are usually performed once per shift, approximately every 8 hours, or more frequently as recommended by organizations, such as the Clinical and Laboratory Standards Institute (CLSI).5 The use of weighted averages can provide an early warning that the system may be drifting out of control prior to the next control run.
Veterinary automated hematology analyzers have been used since the early 1980s.6 Some in-house analyzers, like the IDEXX VetAutoread Hematology Analyzer,7 utilize a fixed optical reference to determine instrument performance. Other analyzers, like the IDEXX LaserCyte Hematology Analyzer,8 incorporate particles with fixed size and index of refraction (qualiBeads; IDEXX Laboratories, Westbrook, ME, USA) to ensure optical performance. Yet other clinical laboratory analyzers, such as the IDEXX ProCyte Dx,9 Heska Hematrue,10 and Abaxis VetScan HM5 Hematology Analyzer,11 utilize a fixed-cell control material to ensure assay performance based on guidelines provided by organizations like CLSI,5 College of American Pathologists,12 and American Society for Veterinary Clinical Pathology.13 The in-house veterinary market is cost-sensitive, and controls are not typically run on the same strict schedule as in human laboratories or veterinary reference laboratories, where fixed-cell controls are run approximately once per 8-hour shift or even more frequently in larger volume reference laboratories. The use of weighted moving averages performed on patient samples is potentially beneficial to veterinary in-house hematology analyzer applications. In addition to providing the quality assurance needed, weighted moving averages have the additional benefit in veterinary applications that cost of this quality assurance is included while performing normal patient runs; costs associated with extra control materials and consumables are not incurred. Even for analyzers with fixed-cell controls, the benefit from patient sample moving averages can be substantial, as fixed-cell control material analysis loses power with increasing number of patient runs and time between control runs.14
Human cells are generally utilized in the formulation of fixed-cell controls. These samples may require a specific (human) algorithm that can be very different from veterinary algorithms. Fundamentally, control runs may be stable and accurate, but specific-species responses may deviate owing to chemical, fluidic, algorithmic, or other reasons. Patient-based methods provide species-specific analyses that can augment performance checks with fixed-cell controls and confirm that the system is performing accurately for each species.
The proposed methods also have potential applications in nonhematology systems. Chemistry analyzers commonly have optical references to verify system control. For laboratory quality results, many methods have been proposed to detect system failures with corresponding result qualification or disqualification. These methods often use analyte-specific control limits.15 One added benefit of patient-based quality assurance is that chemistry control products are generally based on expected performance for human samples, which may be significantly different from expected performance for animal samples. One criticism of patient-based quality assurance for chemistry analyzers is that, unlike many hematologic variables, biochemical analytes can have wide reference intervals and significantly wider variations in clinically ill patients. Analyte-specific changes in rules or batch sizes may be required.
In our study, the focus was on hematologic applications only. The objective of this investigation was to evaluate the use of weighted moving averages as a method of providing bias corrections for RBC variables measured in canine, feline, and equine samples.
Materials and Methods
Methods for using weighted moving averages have been developed for use with automated hematology analyzers in veterinary medicine.16-18 A modification to Bull's algorithm3 was developed at IDEXX Laboratories to generate aggregate results of species-specific batches to support MCV mean and range differences between canine, feline, and equine samples. Initial applications were developed for canine, feline, and equine samples as the basis for this research. Utilization of control chart rules provided a way to determine instrument performance and a method to trigger algorithms to provide bias corrections for RBC count, MCV, and hemoglobin (HGB) concentration, yielding improvements in clinical accuracy of HCT, MCH, and MCHC. In addition, systems that utilize reference particles, such as fixed-size particles (qualiBeads) for the IDEXX LaserCyte Hematology Analyzer,8 as part of every run provided a run-to-run reference for size scaling. A specifically designed software package, Advanced Diagnostic Software,8 embedded in the IDEXX VetLab Station was developed to make optical corrections based on the known reference size of the optical particles, automatically correcting for shifts in MCV. In this study, Advanced Diagnostic Software was used prior to running a calibration analysis to ensure that the laser optical signature was accurate.
Automated analytical instrument performance was monitored and controlled using animal patient results. Results were grouped into batches of 20 for the specified species of animal based on run time. Batches were then analyzed by standard control chart rules.19 Conditions that lead to out of control results were then updated by fuzzy logic algorithms that compared results with reference targets to determine calculated analytes. Gradient descent techniques were incorporated to optimize adjustments for measured and calculated analytes in minimal iterations. If needed, the output was a set of optimized analyte adjustments that returned the analyzer to within control.
Overview of analytic method
The question of interest was how to identify and quantify the impact to fielded hematology analyzers that were no longer operating to desired accuracy for RBC count, HCT, HGB concentration, MCV, MCH, or MCHC without the aid of fixed reference materials. The basis of the approach used Bull's algorithm as a means to gather patient-based results and form the data into smoothed moving averages of 20 samples each that were representative of the general population and not heavily weighted by spread in the data. The general principle followed the central limit theorem,16 which states that mean values converge quickly. Therefore, a good estimate of instrument performance was generated by the mean estimate. After the raw patient data were grouped into moving average batches, rules were required to determine if the system was in control. Control chart rules were used to evaluate the batches, if they violated the basic rules and fell outside of the specified target range or if they showed a consistent bias regarding the target for any analyte. Once the control chart rules identified that a system was out of control, logic was required to determine the actions necessary to bring the system back into control. Fuzzy logic was employed by taking advantage of the mathematical power available, as HCT, MCH, and MCHC are calculated analytes based on RBC count, HGB concentration, and MCV. The relationship between these analytes coupled with the associated species-specific targets and intervals for each analyte provided a set of fuzzy rules that generated a value identifying the cumulative accuracy of all 6 analytes together. Optimization logic was then required to determine the appropriate modifications that drove optimal cumulative accuracy. Gradient descent techniques were used to efficiently converge on the optimal settings. This overall approach used patient data to identify if the system moved out of control and then calculated appropriate adjustments to bring the system back into control, if needed (Figure 1).

A total of 102 IDEXX LaserCyte Hematology Analyzers, from a population of over 12,000 active analyzers in the field, were evaluated between 30 June 2009 and 30 June 2010. These analyzers had developed biases in one or more of the following: RBC count, HCT, HGB concentration, MCV, MCH, and MCHC. We provide details of the entire analytic process for 1 analyzer and then summarize results for the 102 analyzers.
Animal patient data
Results were qualified to be included in the analysis prior to inclusion in the batch logic using rules defined below. Removal of runs that violated the fundamental assumption that results were from a random population helped to ensure that batch calculations were not artificially skewed due to predictable and identifiable causes. Specifically, repeat runs on a particular animal patient within a batch, runs with diagnostic or analyzer flags, and runs with nonsensical results, such as those stemming from gross error from running a short sample, were removed. Batch results provided easily charted values that were not heavily weighted by outlier results owing to individual patient response, sample handling, or analyzer variation. Bull's algorithm logic provided a smoothing effect on the data that minimized the impact of outlier runs.3 Outlier runs were defined as animal patient results that were reported as significantly different from the normally measured population on that analyzer either due to individual patient response or system malfunction. Due to flagging and other internal checks, these results often are not reported to the user.
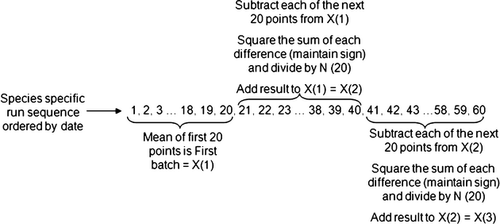
Animal patient samples were individually qualified for inclusion in the analysis prior to further processing as per the rules defined above. Bull's algorithm, which has been used to track patient results in automated hematology analyzers for veterinary applications,17, 18 is written in the following form3:
 (1)
(1)- Determine the average of the first 20 species-specific samples; this is the first batch.
- For each of the next 20 species-specific samples, calculate the absolute difference between each animal patient result and the previous batch, tracking the sign for each difference for later use.
- Take the square root of each absolute value in step 2.
- Apply the sign from step 2 to the corresponding square roots in step 3.
- Sum all values from step 4; store the sign of this sum for later use.
- Divide the sum in step 5 by the batch size (in this case, 20).
- Square the result from step 6.
- Apply the sign from step 5 to the result from step 7.
- Add the result from step 8 to the previous batch to define the current batch.
- Repeat steps 2–9 for all remaining batch calculations.
Control chart rules
Control chart rules were used to provide feedback when batches of results showed a trend or bias that was outside defined limits. Standard Westgard rules have been used in multiple applications of weighted moving averages in chemistry and hematology automated analyzers.20, 21 In addition, Levey–Jennings charts have been used to monitor, typically with Westgard rules, external quality material results.22 Rules implemented for batches of results have been shown to have greater statistical power than the same number of patient results, as each batch corresponds to 20 patient runs. The act of grouping runs into batches that are weighted by prior batch values provides a smoothing effect; therefore, a rule that may otherwise require 10 points was used with fewer points. Two rules were selected for control charts using batches. The first was identified as 2SL, where a control error was generated when 2 consecutive batches exceeded the same specified limit (SL). The second was identified as 4T, where a control error was generated when 4 consecutive batches fell on one side of the target (T).
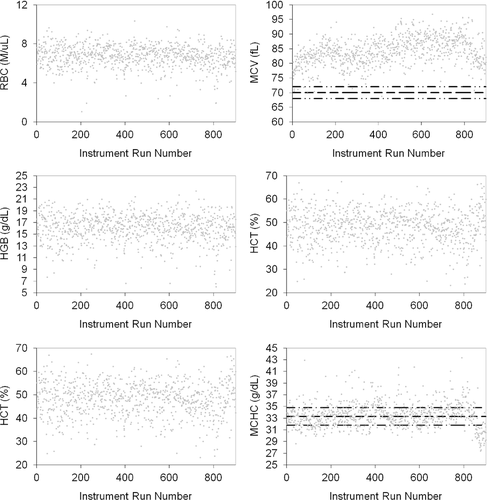
Limits were defined for MCV, MCH, and MCHC based on several references (Table 1),23-25 but they could be set at any appropriate value based on reference intervals established in a particular laboratory or for a given hematology analyzer. Specifically, MCHC was found to be useful for measuring instrument performance, as clinical conditions resulting in low MCHC values are relatively uncommon. In addition, increased MCHC values resulting from intravascular hemolytic disease are relatively uncommon. In vitro hemolysis from poor sample handling may be problematic; therefore proper sample handling techniques must be followed. Lipemia and conditions causing Heinz body formation may also be problematic, resulting in falsely increased HGB concentration, and thus increased MCHC.23-25
Real-time instrument corrections
 (2)
(2) (3)
(3) (4)
(4)As MCV, MCH, and MCHC have targets and ranges, equations 2-4 provide 3 equations with 3 unknowns (RBC count, HGB concentration, and HCT). As MCH and MCHC are not independent equations (MCH is related to MCHC directly by MCV), there are now only 2 equations (equations 2 and 4) with 3 unknowns (RBC, HGB, and HCT). A gradient descent algorithm26 provided optimized RBC and HGB adjustments to pair with MCV adjustments (based on the MCV target) for HCT, MCH, and MCHC with fuzzy logic27 principles. Simply splitting an animal patient sample and measuring PCV for comparison then confirmed results. Once HCT was confirmed, HGB concentration was confirmed by evaluation of MCHC.
Fuzzy logic
Fuzzy logic algorithms were used in addition to the system of equations to incorporate expert human decisions. Fuzzy logic provided an improvement over traditional logic programming in which case statements (if-then) are used to determine if an expression is true or false, with appropriate actions for either condition. Fuzzy logic assigned levels of correctness (for example, a value can be 30% or 70% true) and attempted to incorporate expert knowledge within context. Traditional applications of fuzzy logic include determining if an age of 35 years is old or young, which depends on the point of origin for comparison (a person who is 5 years old might think that 35 years is old, whereas a 75-year-old person might think the 35-year-old is young). To implement fuzzy logic, an expert (JMH) in analysis of hematologic results and comparison with samples split and confirmed on a qualified reference analyzer described each logical input that defined action based on the data. The logical inputs were essentially training sets for the algorithm that were then implemented and compared with new test cases. These logical inputs were ultimately translated into fuzzy relationships that the software tool used.
The fuzzy logic algorithm was based on a series of constraints, so that the system converged on the best adjustment possible based on the input values. A general target for each of the 6 analytes, RBC count, HCT, HGB concentration, MCV, MCH, and MCHC, provided an initial basis for analysis. As it was clear that not every animal patient sample fell directly on any target setting, it was important to provide a means to be approximately correct with respect to the target. Constraining the system so that the combinations of results from all 6 analytes were optimized defined the basis of the fuzzy system. MCHC was defined with a tight target and relatively small interval of acceptable values (the analysis is based on the estimate of system average from Bull's logic). From a fuzzy logic perspective, a value of 33.3 g/dL might be considered the optimal target response, but values of 33.0 or 33.6 g/dL might be considered 90% optimal and values of 30.3 or 36.3 g/dL might only be considered 5% optimal. Combining this with a tight target and interval for MCV and wider intervals for RBC count, HGB concentration, HCT, and MCH, provided a system of constraints that was optimized so that all analytes were adjusted to the optimal reported result. To achieve this system-optimal response, some analytes moved slightly away from their individual target so that other analytes could move closer to their respective target.
Implementing fuzzy logic with targets, interval limits, and equations 2-4 provided a basis for determining system adjustments that would have a positive impact on results. An example of hematologic results from a serviced instrument demonstrates discrepancies for RBC count, HCT, HGB concentration, MCV, MCH, and MCHC discrepancies along with target intervals for MCV, MCH, and MCHC (Figure 3).
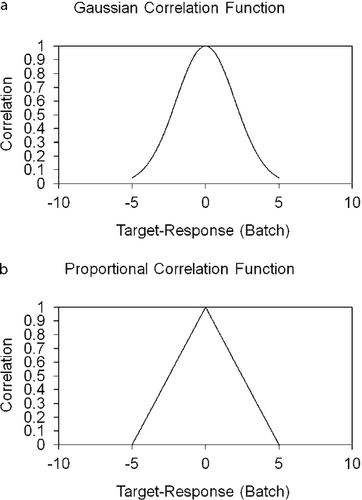
A Gaussian correlation function (Fc) (equation 5, Figure 4a) was evaluated to describe the “correctness” of the impact on response to target of a given set of analytes, based on expert analysis. The variables A and σ from equation 5 represent the variables that were adjusted to manipulate the Gaussian function to the correct amplitude and width for each analyte. The variable X represented the measured and reported value for each individual analyte. The variables were adjusted based on the fuzzy logic confidence of the target and size of the allowable range (Table 1). For this analysis, A was selected as 1 for each of the individual analytes so that perfect correlation would result in a value of 1. The values of σ were determined based on the width of the fuzzy logic confidence of the targets, and was different for each analyte. Initial values of σ were calculated by selecting the acceptable response interval (Table 1) and using that range. The value of σ was then adjusted as testing showed that an analyte proved to be too responsive or not responsive enough. An alternative to a Gaussian function is a proportional function. The proportional function is similar to the Gaussian function, except that it has a linear response with slope m and y-intercept A (Figure 4b, where Fc(X) = 0 if |X| > 5). The relationship for the proportional function (equation 7) is shown assuming the following condition: Fc(X) = 0 if m|X| > A.
 (5)
(5) (6)
(6)Training the fuzzy system provided a means to optimize the analytes so that small changes in an analyte with a wider interval had less impact on the total variation measured. Manipulating values of A had an impact on amplitude of the function and provided higher (> 1) or lower (< 1) relative impact on the remaining analytes. Adjusting slopes had an impact on the width of the curve with larger values providing a basis for larger variation from target, before affecting the result and smaller values having a more rapid impact on the resulting value. In a representation of fuzzy correlation functions for each of the 6 analytes from an out-of-control batch and the associated optimized values (Figure 5), note that the optimized values did not necessarily lie at the apex of the proportional correlation functions for every analyte (the data will not be able to meet this expectation), but instead identified the optimal positions to maximize the overall correlation across all analytes.

Gradient descent
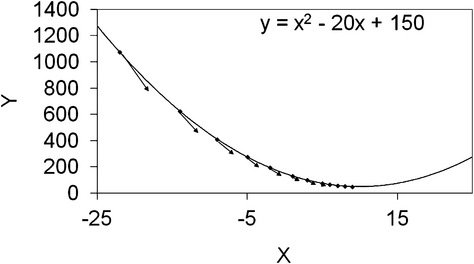
The gradient descent algorithm26 provided a method to find minimum values, defined as minima, of a function while only having knowledge of the function in a region close to the current position. The general approach was to start at a location and calculate the slope of the function at that location. No prior knowledge of the shape of the function was needed for determining a starting point, but the algorithm converged more quickly when starting closer to the minima. The slope was used to determine the direction to travel toward the minima and the magnitude of the step. A scalar multiplier can be applied to the slope magnitude to accelerate or temper the size of the step. Small steps required longer time to converge, whereas large steps were more likely to move too far and could cause oscillations around the minima.
Gradient descent relates to equations 2-4, as there is no closed form solution to find the minima. The idea is that MCHC was increased by increasing HGB concentration or by decreasing RBC count or MCV. Evaluation of MCH provided information unrelated to MCV, whereas evaluation of HCT provided information unrelated to HGB. By moving in the right direction on RBC count, MCV, or HGB concentration, an optimal response was obtained for all measured and calculated relationships.
One common drawback to the gradient descent algorithm can occur if there are local minima in the function where the algorithm could inadvertently converge and never reach the global minima. The benefit of the system of equations is that local minima are not present, as the relationships are all first order and the logic should always converge at the global minima. The Gaussian error function was shown to act in a nonlinear (Gaussian) manner sometimes developing local minima, leaving the linear (proportional error) function preferred in many situations.
In a quadratic function and associated values identified using the gradient descent algorithm (Figure 6), it was clear by the size and direction of the vector arrows that the algorithm made large steps when far from the minima, and less aggressive movements as it moved closer to the minima. This approach provided a way to optimize RBC count, MCV, and HGB concentration with criteria related to HCT, MCH, and MCHC results.
Fuzzy logic was incorporated to provide weighting with respect to the differences between responses and species-specific targets. The functions defined in equations 5 and 6 were used as inputs to the correlation function (FC), shown in equation 7, where N was the number of analytes in question (6 defined as RBC count, HCT, HGB concentration, MCV, MCH, and MCHC) and n was a counting variable used in the summation across the 6 analytes. The value of FC is optimal when maximized. Varying the calibration factors for each of the calibrated analytes (RBC count, HGB concentration, MCV) and then determining the effective FC based on those analytes led to the maximal value of FC and optimized calibration analytes. The correlation function used the result of the N error functions for each analyte as a function of the batch. The outcome was a single value that defined how well correlated the results were based on the adjustments. Optimizing this correlation function output value provided the basis for the gradient descent minimizing algorithm.
 (7)
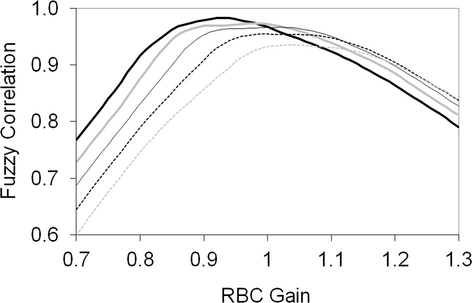
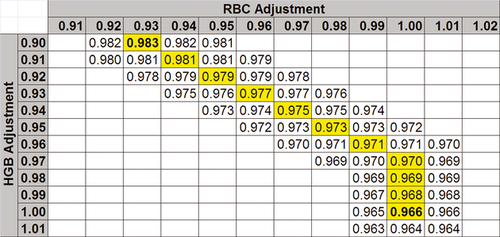
(7)A 2-dimensional gradient descent algorithm was used to optimize RBC count and HGB concentration with respect to HCT, MCH, and MCHC, as MCV already had a target value. Curves (Figure 7) were translated into the model used by gradient descent providing a 2-dimensional map (Figure 8). At every point, the value at all 8 nearest neighbor positions was evaluated and moved to the largest value until the center point was the largest value.
Results
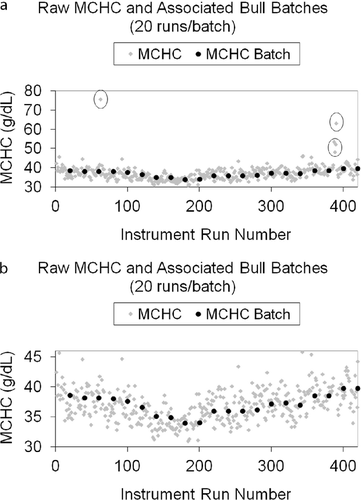
Bull's algorithm performed well in its representation of animal patient results by smoothing data and de-weighting outliers prior to control chart analysis and optimization, when required. The average batch results of 20 samples tracked well with patient population results (Figure 9).
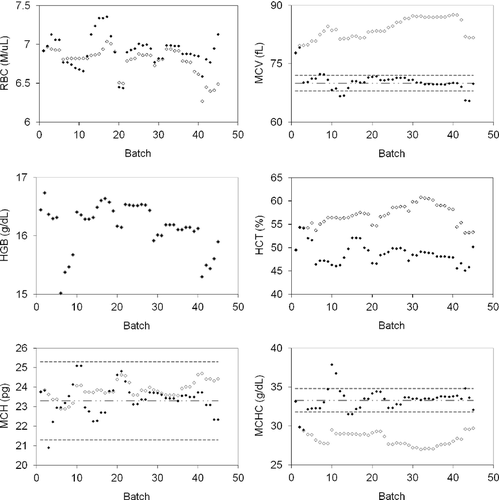
The same dataset was then analyzed with control chart rules, gradient descent algorithm, and fuzzy logic to define adjustments and then calculate updated instrument results and batches, with results before and after adjustment graphically displayed (Figure 10). HGB concentration was not adjusted based on the algorithm and the data points for raw batches and adjusted batches overlapped completely. The system logic made a slight change to RBC count, a more significant change to MCV, and no change to HGB concentration. HCT was stabilized and matched PCV. MCH and MCHC showed marked improvement and matched within targets well (Figure 10).
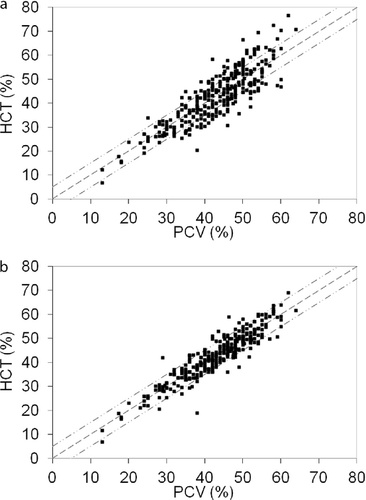
The system logic analyses were performed on a total of 102 nonoptimized hematology analyzers. For validation, 2–4 fresh canine blood samples were run with split PCV measurements. Manual PCV and instrument-reported HCT before and after implementation of batch adjustments were compared (Figure 11). HCT was stabilized and matched PCV in the majority of instrument adjustments. It is clear from regression values where PCV = 1.005HCT (Figure 11a) and PCV = 0.996HCT (Figure 11b) that the population maintained its general accuracy. The impact of optimization is shown in the correlation coefficient prior to (r2 = .74) and after (r2 = .84) adjustment. Overall accuracy of the group of hematology instruments was improved by optimization of adjustment factors.
Discussion
Weighted moving averages analysis was applied to selected canine, feline, and equine hematologic analytes. Such analysis is potentially of high value in ensuring proper instrument performance for both in-house veterinary hematology systems, for which regular quality control processing is limited or not available, and larger analyzers in reference laboratories so that constant checking of instrument performance is possible between quality-control runs. The proposed algorithm can be applied to correction of developing biases for RBC count, HCT, HGB concentration, MCV, MCH, and MCHC for dogs, cats, and horses.
For automated hematology analyzers, stability can be improved and bias reduced by using fundamental knowledge of hematology for RBC analytes with species-specific targets, a gradient descent algorithm, and fuzzy logic. Comparisons of PCV with HCT and review of calculated MCHC can help verify adjustments and ensure accuracy with or without utilizing fixed-cell controls or splitting the sample and sending it to a reference laboratory. Using patient-based results to monitor and control system performance is effective, as species-specific variations can be identified in the same manner used to generate results. Although a result from a single patient will not provide ample power to make decisions and take actions regarding system performance, aggregated patient-based results provide increasing analytical power; as the number of samples for analysis increases, so does the analytical power. Conversely, as the amount of time and number of runs for analysis increase, so does the time before actions can be taken. Owing to the desire to have high analytical power and quick response time, it is critical to balance the sample size with the required power for taking actions.1
The fundamental assumption that must be met in order for batches to be representative of the instrument response, rather than patient results, is that samples included in a batch must be from a random population of patients. As long as the data set is random, samples are not repeated, and large groups of samples from patients with disorders in which similar abnormal results will be present are not run in sequence, statistical analysis will be sufficient to generate batches that are representative of instrument response. These batches can then be used to adjust the system response for accuracy.
There are many benefits to using batches to summarize patient results in a control chart. Bull's logic provides a means to reduce the impact of single sample variations in batch results. Furthermore, use of this analysis for RBC analytes has an additional benefit, as several analytes, including MCV, MCH, and MCHC, have tight normal variations within the species that can provide additional information with respect to accuracy of results. Some concerns have been raised, as the adjustment analysis makes reference to “targets” based on a central reference interval value for the particular analyte. These concerns are generally related to specialty practices analyzing samples from multiple sick patients, but this can be mitigated as there are few clinical conditions that cause significant variation in MCV, MCH, and MCHC for a population of patients. A clinician can recognize that the system is not functioning correctly when the population MCHC is biased near 37 or 29; however, this analysis uses optimizing logic to find and correct biases before they reach this level of bias.
This analysis also addresses species-specific results. Consider a system with a fixed-cell control material based on human cells. The instrument will run the control sequence and algorithm, commonly with an MCV > 80 fL. The system may be functioning correctly for this material, but there may be species-specific biases seen because canine MCV is about 70 fL and feline MCV is < 50 fL. Depending on the technology, algorithm, and performance across this large range, there may be species-specific adjustments required. As the hematology system ages, the response may not be linear with the control material and application of weighted moving average analysis may be required to assure accurate MCV values for different species.
Weighted moving averages analysis provides a means to ensure that an analyzer's system is functioning correctly and provides feedback control to maintain accurate performance. Logic must be included to ensure that preanalytical errors do not prompt adjustments to the analyzer to compensate for poor sample quality. For example, consistent preanalytical errors from in vitro hemolysis will result in high MCHC values, but the instrument should not be adjusted, as this will cause accurate measurements to be biased due to the adjustment. Other preanalytical factors, such as significant lipemia, could also affect automated analysis. Logic can be implemented to reduce the impact of some of these known conditions, but it is up to the clinician to ensure that proper laboratory practices are in place to help ensure correct automated analyses.
Additional benefits are realized when the proposed algorithm is used in conjunction with external quality material, as statistical power is added to the analysis. Further investigation into application of weighted moving averages analysis for other hematologic analytes is needed. In addition, this analytic method should be explored for its potential use in assessing performance of chemistry analyzers. The power of the analysis is derived from the knowledge that mean values converge quickly, even in systems with large normal variation associated with the instrument or the sample population. The proposed approach has been tested with automated veterinary hematology analyzers for selected analytes, but it may be directly generalized to veterinary biochemical analysis. In addition, human hematology and chemistry systems could utilize this approach beyond implementation of Bull's algorithm to optimize use of control materials and automate feedback control.
Disclosure: All authors are employees of IDEXX Laboratories, Inc. Dr. Hammond is a pending patent holder.


