Histopathological differences between human T-lymphotropic virus type 1-positive and human T-lymphotropic virus type 1-negative polymyositis
Abstract
Objectives: Epidemiological studies show that human T-lymphotropic virus type 1 (HTLV-1) is closely associated with polymyositis (PM). However, the pathogenic roles of HTLV-1 in PM remain unknown. The present study aims to assess skeletal muscle morphology in the presence of HTLV-1 infection to compare the histopathological findings of HTLV-1-positive and HTLV-1-negative PM.
Methods: Among the 68 patients with inflammatory myopathy diagnosed through muscle biopsy over the previous 10 years at Kagoshima University Hospital, we retrospectively selected 21 patients with PM not associated with any other disease; we evaluated HTLV-1 positivity through serology, confirmed it by nested polymerase chain reaction using DNA extracted from muscles, and then assessed the tissue viral load. Meticulous histopathological examination was carried out using routine histochemical and immunohistochemical staining, and specimens from selected cases were examined by electron microscopy.
Results: The clinical and histopathological findings of muscle biopsy specimens of HTLV-1-positive (n = 11) and HTLV-1-negative PM cases (n = 10) were compared. Compared with HTLV-1-negative patients, HTLV-1-positive patients showed protracted clinical courses, prominent endomysial infiltrates, infrequent necrotic fibers and prominent regenerative activities. Furthermore, they showed frequent cytochrome c oxidase deficiency and ultrastructural abnormalities in mitochondria.
Conclusions: These differences are significant, but not specific to HTLV-1-positive PM. Therefore, HTLV-1 might induce the clinical and histopathological modifications of PM observed in the present study. (Clin. Exp. Neuroimmunol. doi: 10.1111/j.1759-1961.2011.00017.x, January 2011)
Introduction
Human T-lymphotropic virus type 1 (HTLV-1), the first human retrovirus to be identified, is a causative agent of adult T-cell leukemia (ATL). HTLV-1 has been reported to be associated with a particular type of chronic progressive myelopathy: HTLV-1-associated myelopathy/tropical spastic paresis (HAM/TSP).1 HTLV-1 infection has also been linked to other inflammatory diseases, such as uveitis, arthritis, bronchoalveolitis, Sjögren’s syndrome and myositis.2 Epidemiological studies show a high incidence of seropositivity for HTLV-1 among polymyositis (PM) patients. However, whether HTLV-1 is a direct causative agent or it plays a role in the pathogenesis of PM remains unknown.2,3 In addition, HTLV-1 infection is closely related to inclusion body myositis (IBM).4–6
PM and IBM are two types of inflammatory myopathies. IBM can be distinguished from PM by the presence of rimmed vacuoles, cytoplasmic inclusions and amyloid deposits in addition to inflammatory changes. However, because of the large similarity between PM and early IBM, modified criteria for diagnosis were introduced by Dalakas and Hohlfeld in 2003, in which careful follow up and repeated biopsies are required to avoid misdiagnosing early IBM as PM.7,8
To determine the clinical and histopathological differences between HTLV-1-positive and HTLV-1-negative PM, we retrospectively evaluated patients with PM not associated with any other disease and carried out a comparative study.
Methods
Patients
Of all patients who underwent muscle biopsy during the past 10 years at Kagoshima University Hospital, South Kyushu, Japan, 68 patients were reported to be diagnosed with inflammatory myopathy; of these patients, 21 were carefully selected for the present study, as shown in Fig. 1.
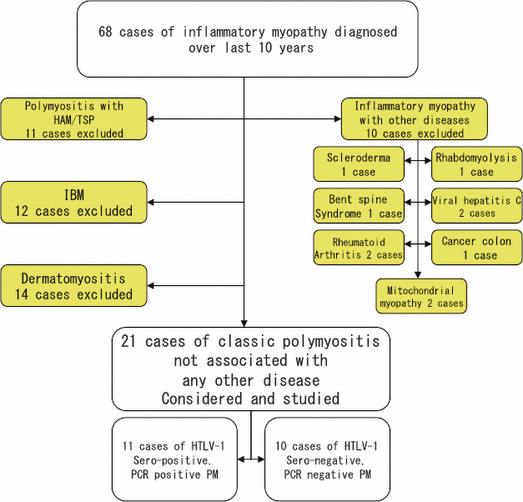
Classification of final diagnoses after the initial diagnosis. The subjects reported with diagnoses other than polymyositis (PM) or PM associated with any other disease were excluded from further analysis. HAM/TSP, human T-lymphotropic virus type 1-; HTLV-1, human T-lymphotropic virus type 1-associated myelopathy/tropical spastic paresis; IBM, inclusion body myositis; PCR, polymerase chain reaction.
The 21 selected patients were re-evaluated using the modified criteria introduced by Dalakas and Hohlfeld,7 which list the following essential requirements for diagnosing PM: (i)elevated serum creatine kinase (CK); (ii) electromyography (EMG) abnormalities; and (iii) muscle biopsy abnormalities. Muscle biopsy abnormalities are crucial and include degeneration, regeneration, necrosis and foci of lymphocytic inflammatory cells with primary inflammation [i.e. CD8+ cells surrounding healthy intact non-necrotic muscle fibers expressing major histocompatibility complex (MHC)-1 without rimmed vacuoles].
Informed consent was obtained from all patients. The institutional review board for regulating clinical research approved the present study.
Muscle biopsy
All muscle biopsies were obtained by open surgical procedures from the biceps brachii or quadriceps femoris. Muscle specimens for histopathological examination were snap-frozen by isopentane chilled in liquid nitrogen; 7-μm-thick sections were routinely stained with hematoxylin and eosin (HE), modified Gomori trichrome, periodic acid-Schiff (PAS), Sudan black, myosin ATPase, NADH-tetrazolium reductase, cytochrome c oxidase (CCO), adenosine monophosphate (AMP) deaminase, acid phosphatase and succinate dehydrogenase (SDH).9 Select sections were immunohistochemically stained (e.g., with dysferlin or dystrophin) to exclude other suspected disorders.
Immunofluorescence double staining for CD8 and MHC-1
Frozen biopsied muscle specimens from all patients were cut into 7-μm-thick sections, placed on aminosilane-coated slides and dried at room temperature. Sections were blocked with 10% normal goat serum in phosphate-buffered saline and then incubated with a mixture of mouse antihuman CD8 monoclonal antibody (diluted 1:50, isotype IgG1; Dako, Glostrup, Denmark) and mouse antihuman HLA-ABC antigen monoclonal antibody (diluted 1:50 isotype IgG2a; Dako) for 12 h at 4°C. Then, an isotype-specific goat antimouse antibody mixture (goat antimouse IgG1 Alexa Fluor 594 and goat antimouse IgG2a Alexa Fluor 488 to detect CD8 and HLA-ABC antigens, respectively; Invitrogen, Carlsbad, CA, USA) was applied for 60 min at room temperature. Sections were counterstained with 4′,6-diamino-2-phenylindole. Signals were collected by a confocal laser scanning microscope (FV500; Olympus, Tokyo, Japan). The fluorescence of individual fluorochromes was captured sequentially.
Polymerase chain reaction
Polymerase chain reaction (PCR) was carried out in a Gene Amp PCR system 9700 (GeneAmp® Applied Biosystems, Singapore) to determine HTLV-1 positivity using 5 μL of DNA (10 μg/mL) extracted from fresh frozen muscle tissue as a template with 20 μL of PCR mixture containing primers specific to the HTLV-1 pX region. Products were analyzed by electrophoresis using agarose gel, as described previously.10
The PCR products of samples that were not proven to be HTLV-1-positive were subjected to a second PCR under the same conditions and re-analyzed by electrophoresis using agarose gel. Samples that proved to be HTLV-1-positive after the second PCR were considered positive; samples that were HTLV-1-negative were subjected to the first PCR again, and the total amount of first PCR products (25 μL) was subjected to a second PCR (5 μL/reaction; i.e., five PCR reactions) to avoid loss of any viral amplicons. The results were reconsidered to be either positive or negative. All experiments were carried out using positive and negative controls, and sensitivity was determined by known titrated pX amplicon solutions from 1–5000 copies·5 μL−1; the detection limit of the pX was one copy/reaction. All results were confirmed three times.
Real-time PCR
All cases that proved to be HTLV-1-positive were tested for tissue proviral load using an ABI PRISM7700 sequence detector (Applied Biosystems, Tokyo, Japan) using 15 μL of DNA (10 μg/mL) extracted from fresh frozen muscle tissue as a template with β-globin as an internal control. Tissue proviral loads were calculated using the following formula: (copy number of HTLV-1 Tax/10 000 cells) = [(tax average × 2)/β-actin average] × 10 000.11 All samples were measured in triplicate, and the average was then determined.
Serology
HTLV-1 seropositivity was examined using a particle agglutinin method (Serodia-HTLV-1; Fujirebio, Tokyo, Japan) and an enzyme-linked immunosorbent assay (Virus-Antibody EIA IgG; Denka-Seiken, Japan).
Immunohistochemistry
Frozen biopsied muscle specimens from all patients were cut into 7-μm-thick sections that were placed on aminosilane-coated slides, dried at room temperature and blocked with a blocking solution. The sections were then incubated with the following antibodies: monoclonal mouse antihuman CD4 (diluted 1:20), CD8 (diluted 1:50), CD20 (diluted 1:200) and CD68 (diluted 1:100; all obtained from Dako); neural cell adhesion molecule (NCAM; diluted 1:10; BD, Franklin Lakes, NJ, USA); myosin heavy chain (neonatal; MHCn; diluted 1:10; Novocastra, Newcastle, UK); perforin (diluted 1:25; PharmaCell, Paris, France); thrombomodulin (TM; diluted 1:50; Dako); and heat shock protein 47 (HSP47; diluted 1:50; Santa Cruz Biotechnology, Santa Cruz, CA, USA). Sections were incubated with each antibody for 12 h at 4°C. Antimouse antibodies were subsequently applied for 30 min at room temperature. Finally, the sections were visualized using the DAB (brown color) or DAKO AEC systems (red color) after setting positive and negative controls using mouse IgG negative control as a first antibody (Dako). Three control muscle biopsies that were HTLV-1-negative and had minimal pathological changes were also investigated.
Quantitative analysis of histopathological findings
Necrotic fibers, as well as all histochemical and immunohistochemical stains, were subjected to quantitative analysis. Samples (at least three sections from each sample) were examined at five fields (×200 magnification) selected randomly in a zigzag manner to avoid overlapping of the fields or recounting the same fibers. More than 200 fibers in each field were counted and all examined fields were averaged.
Each cellular subset and the total number of endomysial and perimysial infiltrating inflammatory cells were counted in at least three sections from each specimen at five different fields (×200 magnification) selected randomly in a zigzag manner; the mean ratio of the total number of infiltrating inflammatory cells and each cellular subset was evaluated in all specimens of both groups.
Electron microscopy
Several epon-embedded tissue blocks from each of the seven HTLV-1-positive patients, five HTLV-1-negative PM patients and three normal control specimens were examined. Tissue blocks were fixed overnight in 3% glutaraldehyde, postfixed in 1% osmium tetroxide in 0.05 mol/L cacodylate buffer (pH 7.3), and dehydrated in graded alcohol. Semi-thin sections were stained with toluidine blue and safranin, and examined by light microscopy. Areas with inflammatory infiltrates and variable-sized fibers that were well fixed and free of preparation artifacts were selected for electron microscopy. Ultrathin sections were stained with uranyl acetate and lead citrate, and examined using an H-7100 electron microscope (Hitachi High-Technologies, Hitachinaka, Ibaraki, Japan). At least three tissue blocks from each specimen were cut, and at least three sections from each block were examined; five adjacent fibers in each field from five fields (×200 magnification) selected randomly in a zigzag manner from each section were examined. More than 100 mitochondria in each fiber were counted, and the percentage was determined.
Statistical analysis
All quantitative data were analyzed for descriptive statistics and by the Mann–Whitney U-test and Spearman’s rank correlation test using StatView software version 5.0.1. (SAS Institute Inc, Cary, NC, USA).
Data are presented as means (SD). P-values <0.05 were considered significant.
Results
Patient selection
Of the 68 patients reported to have inflammatory myopathy who had undergone a biopsy over the past 10 years, we carefully selected 21 patients with myositis not associated with skin lesions or any other diseases. Patients who reported to have dermatomyositis (n = 14), IBM (n = 12), inflammatory myopathy associated with HAM/TSP (n = 11) and inflammatory myopathy associated with other diseases (n = 10) were excluded from analysis on the basis of clinical and pathological criteria. The selection process and diagnoses of the excluded patients are shown in Fig. 1.
The 21 selected patients had the following common features: (i) subacute bilateral symmetrical progressive weakness commencing in adulthood and involving proximal muscles more than distal; (ii) elevated serum CK more than twice the normal level (normal range 26–140 IU/L); (iii) myopathic findings in EMG; and (iv) muscle biopsy findings (Fig. 2a–d,f) with inflammatory cell infiltration, CD8 cells surrounding healthy intact non-necrotic fibers as well as myopathic changes, such as variations in muscle fiber size, necrosis, degeneration and regeneration without rimmed vacuoles. In addition, the clinical course and manifestations of these 21 patients were retrospectively investigated to ensure a satisfactory response to steroid therapy with improvements in their symptoms (e.g., muscle tone, weakness and fatigue while walking, and lowered CK levels) and to confirm the diagnosis of PM.12,13
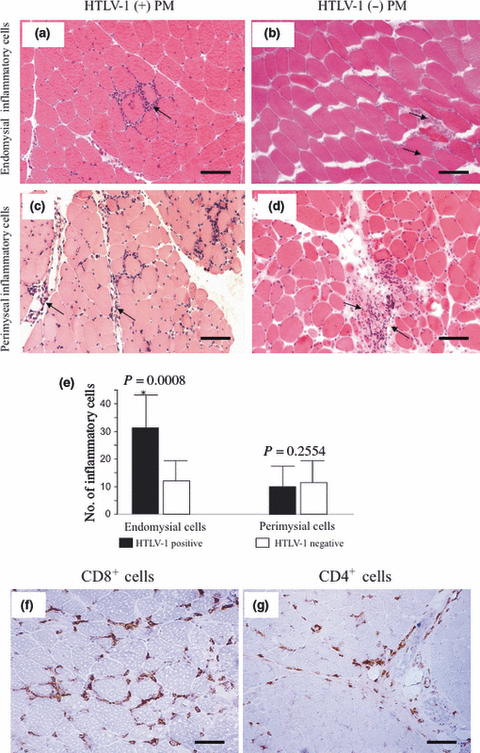
Distribution and subsets of inflammatory cells in cross-sections of muscles biopsied from human T-lymphotropic virus type 1 (HTLV-1)-positive and HTLV-1-negative polymyositis (PM) patients. (a) Abundant endomysial inflammatory cells in HTLV-1-positive PM (arrow). (b) Infrequent endomysial inflammatory cells in HTLV-1-negative PM (arrows). (c,d) Equal numbers of perimysial inflammatory cells in HTLV-1-positive and HTLV-1-negative PM (arrows). Bars (a)–(d) 100 μm. (e) Combined data for all study patients. Significantly greater numbers of endomysial inflammatory cells in HTLV-1-positive PM (P = 0.0008; Mann–Whitney U-test). Immunohistochemistry for (f) CD8+ (bar, 50 μm) and (g) CD4+ (bar, 100 μm) cells shows that they are predominant in the endomysium and perimysium, respectively.
On re-evaluating the 21 selected PM patients using the modified criteria introduced by Dalakas and Hohlfeld,7 the CD8/MHC-1 complex was detected in six patients (29%; Fig. 3a–c) who were diagnosed with definite PM. The remaining 15 patients showed MHC-1 expression and infiltration of CD8+ cells, but the CD8/MHC-1 complex was not detected; these patients were diagnosed with probable PM (Fig. 3d,f).
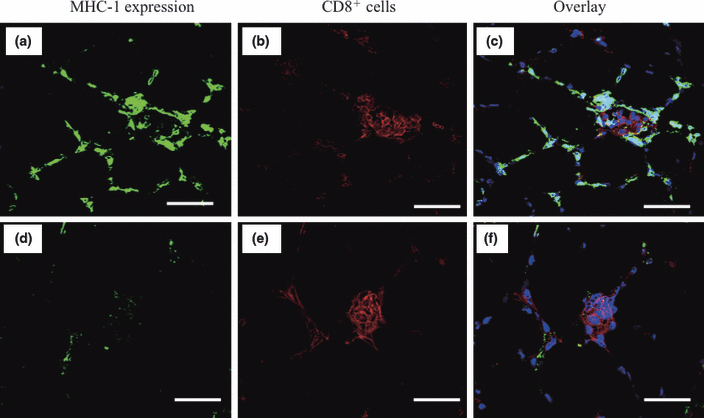
Detection of the CD8/MHC-1 complex by double staining for MHC-1 and CD8 antigens by immunofluorescence. (a) Histologically healthy non-necrotic fibers expressing histocompatibility complex (MHC)-1antigens (green color). (b) CD8+ cells surrounding and invading histologically healthy non-necrotic muscle fibers (red color). (c) Overlay of both histologically healthy non-necrotic fibers expressing MHC-1 antigens (green color) and CD8+ cells invading them (red color). (d) Histologically healthy non-necrotic fibers not expressing MHC-1 antigens (no green color). (e) CD8+ cells surrounding and invading the histologically healthy non-necrotic muscle fibers (red color). (f) Overlay of both histologically healthy non-necrotic fibers not expressing MHC-1 antigens (no green color) and CD8+ cells invading them (red color). Bars, 100 μm.
Confirmation of HTLV-1 positivity by nested PCR and proviral loads of HTLV-1-positive cases
Nested PCR carried out using DNA extracted from fresh frozen muscle biopsies showed that among the 21 patients with PM, 11 and 10 were HTLV-1-positive and HTLV-1-negative, respectively. PCR positivity for HTLV-1 strongly corresponded to seropositivity for HTLV-1. Although tissue proviral loads of HTLV-1 ranged from 1 to 2063 (1 copy/104 cells), the proviral loads were not correlated with any examined clinical or histopathological values using Spearman’s rank correlation test (data not shown).
The six patients expressing the CD8/MHC-1 complex included three from the HTLV-1 positive group (3/11, 27%) and three from the HTLV-1-negative group (3/10, 30%).
Clinical and laboratory differences
Detailed clinical and laboratory data are shown in Table 1. There were no significant differences between groups regarding age, sex or serum CK levels. However, the duration of illness from the onset of symptoms to biopsy was significantly longer in HTLV-1-positive PM patients [range 1–240 months; mean 66 months (73.6)] compared with that in HTLV-1-negative PM patients [range 1–24 months; mean 8 months (6.9); P = 0.0043].
| Case serial number | Age/sex | Duration of illness (months) | Laboratory data | Muscle weakness | Gait | EMG | Response to CS treatment | Site of biopsy | |||||
|---|---|---|---|---|---|---|---|---|---|---|---|---|---|
| Tissue nested PCR | Serum anti HTLV-1 antibodies | Tissue viral preload (copy/104 cells) | CK (IU/L) | Anti jo-1 | ANA | ||||||||
| Po 1 | 50/F | 120 | + | + | 1 | 400 | − | − | Moderate S P > D | D | Myopathic | Effective | Biceps brachii |
| Po 2 | 59/F | 12 | + | + | 1627 | 1390 | − | − | Mild S P > D | N | Myopathic | Effective | Biceps brachii |
| Po 3 | 59/F | 12 | + | + | 1 | 1100 | − | − | Moderate S P > D | D | Myopathic | Effective | Biceps brachii |
| Po 4 | 56/F | 24 | + | + | 4 | 370 | − | − | Moderate S P > D | M | Myopathic | Effective | Biceps brachii |
| Po 5 | 63/F | 24 | + | + | 316 | 1538 | − | − | Mild S P > D | M | Myopathic | Effective | Biceps brachii |
| Po 6 | 62/F | 144 | + | + | 7 | 349 | − | − | Mild S P > D | M | Myopathic | Effective | Biceps brachii |
| Po 7 | 53/M | 1 | + | + | 633 | 4742 | − | − | Mild S P > D | N | Myopathic | Effective | Biceps brachii |
| Po 8 | 66/M | 48 | + | + | 7 | 2924 | + | − | Mild S P > D | M | Myopathic | Effective | Biceps brachii |
| Po 9 | 51/F | 60 | + | + | 1 | 206 | − | − | Moderate S P > D | D | Myopathic | Effective | Biceps brachii |
| Po 10 | 70/M | 240 | + | + | 2063 | 355 | − | − | Mild S P > D | M | Myopathic | Effective | Quadriceps femoris |
| Po 11 | 35/F | 36 | + | + | 13 | 4000 | − | − | Moderate S P > D | D | Myopathic | Effective | Biceps brachii |
| Neg 1 | 53/F | 24 | − | − | NA | 599 | − | − | Moderate S P > D | D | Myopathic | Effective | Biceps brachii |
| Neg 2 | 65/F | 8 | − | − | NA | 2400 | − | − | Moderate S P > D | D | Myopathic | Effective | Biceps brachii |
| Neg 3 | 57/F | 12 | − | − | NA | 4525 | − | − | Mild S P > D | M | Myopathic | Effective | Biceps brachii |
| Neg 4 | 60/F | 12 | − | − | NA | 330 | − | − | Moderate S P > D | D | Myopathic | Effective | Biceps brachii |
| Neg 5 | 50/F | 2 | − | − | NA | 840 | − | − | Mild S P > D | N | Myopathic | Effective | Biceps brachii |
| Neg 6 | 62/M | 10 | − | − | NA | 523 | − | − | Mild S P > D | M | Myopathic | Effective | Biceps brachii |
| Neg 7 | 36/F | 2 | − | − | NA | 7760 | − | − | Mild S P > D | N | Myopathic | Effective | Biceps brachii |
| Neg 8 | 67/F | 6 | − | − | NA | 2895 | − | − | Moderate S P > D | D | Myopathic | Effective | Biceps brachii |
| Neg 9 | 58/F | 1 | − | − | NA | 834 | − | − | Mild S P > D | N | Myopathic | Effective | Biceps brachii |
| Neg 10 | 56/M | 4 | − | − | NA | 561 | − | − | Mild S P > D | M | Myopathic | Effective | Biceps brachii |
- Muscle strength score: 5, normal; 4, good; 3, fair; 2, poor; 1, trace; 0, no muscle contraction. +, positive; –, negative. ANA, anti-nuclear antobody; anti jo-1, antibody antihistidyl t-RNA synthetase antibody; CK, creatine kinase; CS, corticosteroid; D, distal muscle strength; D, disturbed gait; EMG, elecromyography; HTLV-1, human T-lymphotropic virus type 1; N, normal gait; NA, not assessed; M, mildly changed gait; P, proximal muscle strength; PCR, polymerase chain reaction; S, symmetrical muscle strength.
Endomysial inflammatory cells are more frequent in HTLV-1-positive PM
Routine examination showed typical histopathological findings of PM in all patients. However, there were significantly more endomysial inflammatory cells in HTLV-1-positive PM patients [range 5–50 cells/×200 field (F); mean 31 (13.7)/F] compared with HTLV-1-negative PM patients [range 3–27 cells/F; mean 11 (8.6)/F; P = 0.0008; Fig. 2a,b,e]. There was no significant difference between the number of perimysial inflammatory cells in the HTLV-1-positive PM [range 0–27 cells/F; mean 9 (8.2)/F] and HTLV-1-negative PM groups [range 5–25/F; mean 11 (6.4)/F; Fig. 2c–e]. Regarding the subsets of inflammatory infiltrates, CD8+ and CD4+ cells were predominant in the endomysium and perimysium in both groups, respectively (Fig. 2f,g). The subsets of infiltrating CD4+, CD8+, CD68+ and CD20+ cells in the endomysium were 30%, 46%, 21% and 3%, in the HTLV-1-positive PM group, and 31%, 48%, 19% and 2% in the HTLV-1-negative PM group, respectively. The subsets of infiltrating CD4+, CD8+, CD68+ and CD20+ cells in the perimysium were 48%, 37%, 14% and 1% in the HTLV-1-positive PM group, and 44%, 37%, 16% and 3% in the HTLV-1-negative PM group, respectively. There were no apparent differences in the subsets of infiltrating cells between the two groups.
Necrotic fibers are less common in HTLV-1-positive patients
Necrotic fibers, which were counted and averaged out of 200 fibers, were less frequently observed in HTLV-1-positive patients [Fig. 4a; range 0–4/200 fibers; mean 2 (1.75)] than in HTLV-1-negative patients [Fig. 4b; range 1–25/200 fibers; mean 6 (7); P = 0.0201; Fig. 4c].
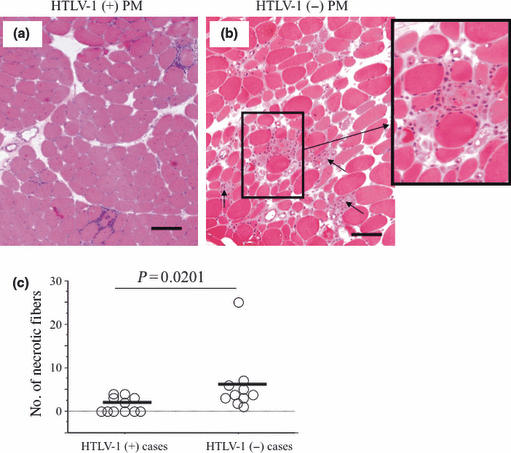
Necrotic fibers in cross-sections of muscles biopsied from human T-lymphotropic virus type 1 (HTLV-1)-positive and HTLV-1-negative PM patients. (a) Very few necrotic fibers are seen in HTLV-1-positive polymyositis (PM); most fibers are histologically viable and healthy. (b) A greater number of necrotic fibers are seen in HTLV-1-negative PM (arrows); inset shows higher magnification of frequently seen necrotic fibers invaded by inflammatory phagocytic cells. (c) Combined data for all study patients. Significantly greater numbers of necrotic fibers are seen in HTLV-1-negative PM than in HTLV-1-positive PM (P = 0.0201; Mann–Whitney U-test). Bars (a)–(b) 100 μm.
Regenerative activity is more common in HTLV-1-positive PM
The number of fibers expressing regenerative activity was determined using anti-NCAM and anti-MHCn antibodies. NCAM-positive fibers tended to be more common in HTLV-1-positive PM [Fig. 5a; range 2–25/200 fibers; mean 10 (8.1)] than in HTLV-1-negative PM [Fig. 5b; range 0–20/200 fibers; mean 6 (5.8)]; P = 0.063; Fig. 5e). MHCn-positive staining fibers, which are a more specific regenerative marker, were significantly more common in HTLV-1-positive PM [Fig. 5c; range 3–25/200 fibers; mean 11 (8.3)] than in HTLV-1-negative PM [Fig. 5d; range 0–20/200 fibers; mean 6 (5.5); P = 0.045; Fig. 5e]. There was no apparent difference between the groups regarding the staining profiles for the other antibodies including anti-HSP47 (a marker for subsequent fibrotic processes), perforin (a cytolytic protein and a marker of apoptosis induced by CD8+ and natural killer cells) and thrombomodulin, which has anti-thrombotic, anti-inflammatory and anti-apoptotic activities.
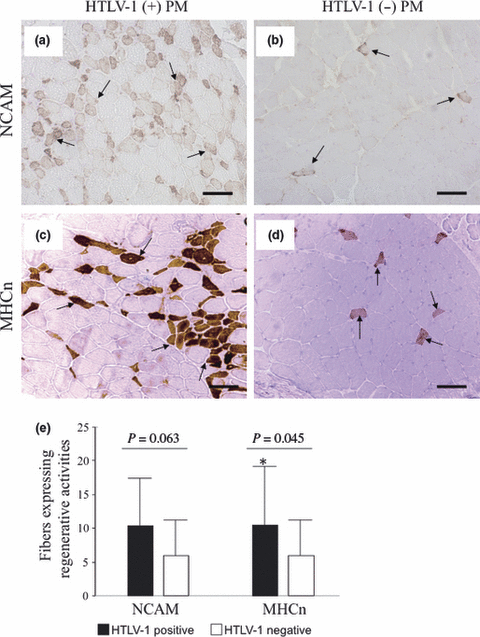
(a,b) Immunohistochemistry for neural cell adhesion molecule (NCAM) and (c,d) neonatal myosin heavy chain (MHCn). Myofibers show increased and decreased regenerative activity with NCAM (arrows) in (a) human T-lymphotropic virus type 1 (HTLV-1)-positive and (b) HTLV-1-negative polymyositis (PM), respectively. (c) Regenerative activity is more pronounced in HTLV-1-positive PM on MHCn staining (arrows). (d) Myofibers show decreased regenerative activity in HTLV-1-negative PM on MHCn staining (arrows). (e) Combined data for all study patients. An increase in the numbers of fibers showing regenerative activity in HTLV-1-positive PM with NCAM staining (P = 0.063, Mann–Whitney U-test) and significantly greater numbers of fibers showing regenerative activity with MHCn staining (P = 0.045; Mann–Whitney U-test) in HTLV-1-positive PM compared with HTLV-1-negative PM. Bars (a)–(d) 100 μm.
CCO activity is decreased in HTLV-1-positive PM
Using normal controls as a reference (Fig. 6a), peripheral fields were not examined to avoid dryness artifacts in the samples. The examined central fields were separated from the edges of the sections by at least one field distance. Partially decreased CCO-stained (Fig. 6c) or completely CCO-negative fibers (Fig. 6d) were frequently found in 9 of 11 HTLV-1-positive PM patients, but only in 3 of 10 HTLV-1-negative PM patients (Fig. 6b). In all 21 PM patients, the number of fibers with partially decreased CCO activity or completely CCO-negative that were counted out of 200 fibers was higher in HTLV-1-positive PM patients [range 0–28/200 fibers; mean, 7 (8)] than in HTLV-1-negative PM patients [range 0–1/200 fibers; mean 1 (1); P = 0.0031; Fig. 6e].
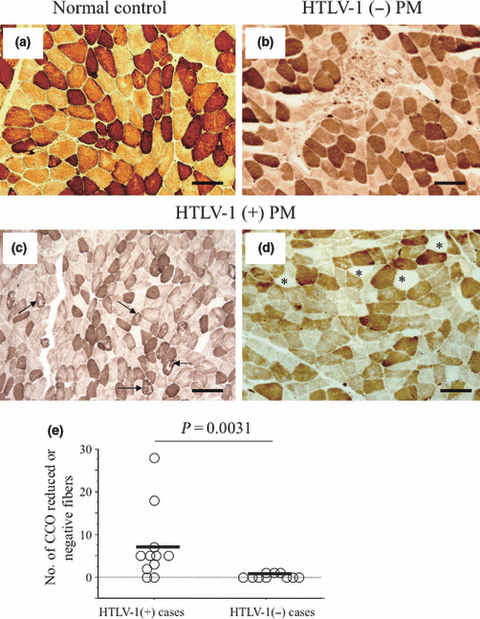
Enzyme histochemistry for cytochrome c oxidase (CCO). (a) Normal CCO staining in normal control showing two types of muscle fibers: type I (dark) and type II (light). (b) Normal CCO staining adjacent to inflammatory cells in human T-lymphotropic virus type 1 (HTLV-1)-negative polymyositis (PM). (c) Frequently observed partially reduced CCO-stained fibers with a mosaic appearance (arrows) in HTLV-1-positive PM. (d) Many completely CCO-negative fibers in HTLV-1-positive PM (stars). (e) Combined data for all study patients. Significantly greater numbers of partially reduced or completely CCO-negative fibers are seen in HTLV-1-positive than in HTLV-1-negative PM (P = 0.0031, Mann–Whitney U-test). Bars (a)–(d) 100 μm.
The staining profile of SDH enzyme histochemistry was normal in all HTLV-1-positive and HTLV-1-negative PM cases except for one case from each group that showed mild reduction in 1–2 fibers/200 fibers.
Mitochondrial morphological abnormalities in HTLV-1-positive PM
We examined semi-thin sections from seven HTLV-1-positive patients showing partially reduced CCO-staining or completely CCO-negative fibers. Sections that had areas with inflammatory infiltrates and variable-sized closely backed myofibers without artifacts and separated by a thin endomysium were selected for ultrathin sections. Morphologically abnormal mitochondria were found on examination of these ultrathin sections (range 8–61%; mean 30%). To avoid misinterpretation of preparation or fixation artifacts, we only considered abnormal mitochondria in well-fixed fields with intact surrounding sarcoplasm filled with closely packed myofibrils arranged in a precise manner without any contraction artifacts; other adjacent mitochondria showed slight swelling, but showed intact unseparated inner and outer membranes, and intact homogenous matrices and cristae. The morphologically abnormal mitochondria showed high-amplitude abnormal swelling without membrane separation, irregular or bizarre shapes, membrane disruption, matrix fragmentation, loss of cristae (Fig. 7c,e), and myelin-like structures (Fig. 7d). In contrast, such abnormal mitochondria were not observed in normal controls or all five examined HTLV-1-negative patients (Fig. 7a,b). The percentage of mitochondria with morphological abnormalities was correlated with the number of partially reduced or completely CCO negative-stained fibers (P = 0.0304; Spearman’s rank correlation; Fig. 7f).
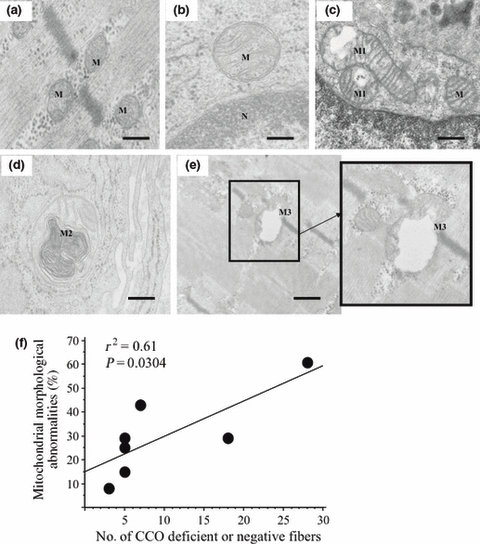
Ultrastructural examination of mitochondria. (a) Normal mitochondria near Z-discs in human T-lymphotropic virus type 1 (HTLV-1)-negative polymyositis (PM). (b) Normal mitochondria near the nucleus in HTLV-1-negative PM. (c) Mitochondria showing variable degrees of morphological abnormalities near the nucleus (M1) and other apparently normal mitochondria (M) in HTLV-1-positive PM. (d) Mitochondrion showing myelin-like formations in HTLV-1-positive PM (M2). (e) Well-fixed area showing many mitochondria; one of them shows abnormal high-amplitude swelling, cristae fragmentation, membrane interruption and loss of matrix in HTLV-1-positive PM (M3). (f) The percentages of mitochondria with morphological abnormalities is correlated with the counts of CCO-reduced or CCO-negative stained fibers (P = 0.0304; Spearman’s rank correlation). Bars (a), (e) 0.3 μm; bars (b)–(d) 0.2 μm.
Detailed histological, histochemical and electron microscopy findings in the skeletal muscle of all 21 PM patients are shown in Table 2.
| Case | Fiber diameter (μm) | Necrotic fibers | CCO negative fibers | SDH staining profile | Rimmed vacuoles | RRF | Fiber type atrophy | Neurogenic involvement | Glycogen and lipid content | Abnormal MT (%) |
|---|---|---|---|---|---|---|---|---|---|---|
| Po 1 | 10–60 | + | ++ | N | − | − | Both types atrophy | − | N | 43 |
| Po 2 | 8–50 | + | − | N | − | − | Type II atrophy | − | N | NA |
| Po 3 | 10–70 | + | +++ | + | − | − | Type II atrophy | − | N | 61 |
| Po 4 | 10–70 | − | + | N | − | − | Type II atrophy | − | N | NA |
| Po 5 | 10–50 | + | + | N | − | − | Both types atrophy | − | N | 29 |
| Po 6 | 10–80 | − | − | N | − | − | Both types atrophy | − | N | NA |
| Po 7 | 5–60 | − | + | N | − | − | Both types atrophy | − | N | 25 |
| Po 8 | 8–60 | + | + | N | − | − | Type II atrophy | − | N | 8 |
| Po 9 | 10–60 | − | ++ | N | − | − | Both types atrophy | − | N | 29 |
| Po 10 | 10–60 | − | + | N | − | − | Both types atrophy | − | N | 15 |
| Po 11 | 5–60 | − | + | N | − | − | Type II atrophy | − | N | NA |
| Neg 1 | 10–50 | + | + | N | − | − | Type II atrophy | − | N | − |
| Neg 2 | 8–50 | + | − | N | − | − | Type II atrophy | − | N | NA |
| Neg 3 | 10–60 | ++ | − | N | − | − | Both types atrophy | − | N | − |
| Neg 4 | 10–70 | +++ | − | N | − | − | Both types atrophy | − | N | NA |
| Neg 5 | 10–70 | + | + | N | − | − | Both types atrophy | − | N | − |
| Neg 6 | 8–70 | + | − | N | − | − | Type II atrophy | − | N | NA |
| Neg 7 | 5–60 | + | − | N | − | − | Both types atrophy | − | N | − |
| Neg 8 | 10–60 | ++ | − | + | − | − | Both types atrophy | − | N | NA |
| Neg 9 | 5–70 | + | + | N | − | − | Both types atrophy | − | N | − |
| Neg 10 | 10–70 | + | − | N | − | − | Both types atrophy | − | N | NA |
- −, Absent; +, 1–2/200 fibers, mild; ++, 3–5/200 fibers, moderate; +++, more than 5/200 fibers, frequent. Abnormal MT % is the percentage of abnormal mitochondria. CCO, cytochrome c oxidase; MT, mitochondria; N, normal; NA, not assessed; RRF, ragged red fibers; SDH, succinate dehydrogenase.
Discussion
The present retrospective study included all patients with inflammatory myopathy who had undergone biopsy over the past 10 years at Kagoshima University Hospital, South Kyushu, Japan. From these patients, we selected our cohort after excluding patients with myositis associated with any other diseases or factors other than HTLV-1 that might affect our results.
On retrospective re-evaluation of all 21 selected patients using the modified criteria introduced by Dalakas and Hohlfeld,7 six patients (29%) were diagnosed with definite PM; in the remaining 15 patients, probable myositis was diagnosed because of the absence of the CD8/MHC-1 complex, possibly a result of a minimal inflammatory reaction or patchy MHC-1 expression.12–14
In the present study, the incidence of PM was 31% (21/68), which is higher than that of other types of inflammatory myopathies. This might be because the present study was carried out on patients with myositis in Kagoshima and Okinawa prefectures, where HTLV-1 is endemic and usually shows the PM phenotype. Therefore, the association of PM with HTLV-1 might not be coincidental. Using these 21 cases of PM, we assessed whether HTLV-1 affects the clinical course and histopathological features of myositis.12,13
To confirm HTLV-1 positivity, we carried out a highly sensitive nested PCR using DNA extracted from fresh frozen muscle biopsy specimens; we found that all HTLV-1-positive patients were concomitant on retrospective serological examination without any disparities. This was carried out as a confirmatory procedure to clarify the difference between HTLV-1-positive and HTLV-1-negative cases. Based on these results, we determined that there were 11 HTLV-1-seropositive and PCR positive PM cases; and 10 HTLV-1-seronegative and PCR negative PM cases.
Regarding the clinical course of the patients, we found that HTLV-1-positive PM patients show a more protracted course, because they have a significantly longer duration of illness from the onset of symptoms until the time of biopsy. The longer duration before biopsy might reflect that the disease requires more time to progress to such a degree that obligates patients to seek medical advice; at the time of biopsy, all patients had sufficient clinical and histological features for a diagnosis of myositis. Although further follow-up studies of the patients in this cohort are necessary to conclude the protracted clinical course of HTLV-1-positive PM, the results of the present study are consistent with those of previous studies carried out in Kyushu and Jamaica – both areas of endemic HTLV-1 infection15– that report HTLV-1-seropositive PM patients having more frequent hospital admissions and significantly longer durations of symptoms before presentation.16–18
At the histopathological level, although both groups showed the classical features of PM, we found the following significant features of the HTLV-1-positive PM group compared with the HTLV-1-negative PM group: (i) endomysial inflammatory infiltrates are more prominent; (ii) necrotic fibers are observed less frequently; (iii) regenerative activities are more prominent; and (iv) partial or complete CCO reduction is more frequent. The present results show significantly higher endomysial infiltration of CD8+ and CD4+ T-cells in HTLV-1-positive PM; some of the infiltrating CD4+ cells in muscle lesions are considered to be the HTLV-1 genome-harboring cells, as we have reported in previous studies.19,20
We also observed the accumulation of CD8+ T-cells around aberrant normal myofibers. This suggests that myositis in patients with HTLV-1 infections is not caused by direct viral infection of muscle fibers, but by an immune reaction between HTLV-1-infected CD4+ cells and HTLV-1-specific CD8+ cytotoxic T-cells damaging muscle fibers.21–23 This characteristic inflammatory process associated with HTLV-1 is also detected in other tissues, such as tissues of the central nervous system in patients with HAM/TSP24 and HTLV-1 uveitis in the eye.25
Regarding necrosis and regeneration, the results obtained from the present study were contrary to our expectations and were paradoxical to the general rule that regeneration follows necrosis; therefore, we preferred to designate them as regenerative processes (i.e., processes for mending or maintaining partially damaged muscle fibers) rather than regeneration. HTLV-1 was recently linked to regenerative activities via p12I, which is an accessory hydrophilic protein of HTLV-1 that might contribute to and amplify the physiological stimulation of cells for proliferation.26,27
We speculate that such upregulation of regenerative processes contributes to the protracted course of HTLV-1-positive PM. These regenerative processes might be continuous but not complete, as fibers showing such processes appear slightly smaller than others in addition to upregulation of neonatal proteins.
We observed a reduction in CCO activity in HTLV-1-positive PM with intact normal staining profiles of SDH. CCO is an enzyme that is localized in the inner membrane and cristae of mitochondria, which are multifunctional and highly complex organelles.28 This finding attracted our attention; therefore, we examined the mitochondrial ultrastructure using electron microscopy. Mitochondrial morphological abnormalities were more frequently observed in HTLV-1-positive than in HTLV-1-negative patients or normal control subjects. Therefore, these mitochondrial morphological abnormalities are more likely to be related to HTLV-1 infection. In particular, we found a significant correlation between these morphological abnormalities and the numbers of CCO-deficient or CCO-negative fibers. Such a link between HTLV-1 and similar mitochondrial morphological abnormalities was previously observed in vitro and is reported to be caused by p13II, an accessory protein of HTLV-1.23 In addition, p13II accumulates in the inner mitochondrial membranes and causes mitochondrial morphological abnormalities by altering membrane permeability.29
It would be interesting if future studies could detect such viral proteins and confirm their relationship to the present findings in vivo.
In summary, we observed the clinical and morphological differences of muscle biopsy specimens between cases of HTLV-1-positive and HTLV-1-negative PM. Although these differences were significant, they were not specific to HTLV-1-positive PM, because they were also observed (although less frequently) in HTLV-1-negative PM. These results suggest that HTLV-1 is responsible for modifying the clinical course and the histopathological features of myofibers observed in the present study.
Acknowledgements
The present study was supported by a Grant-in-Aid for Scientific Research from Japan Society for the Promotion of Science and research grants from the Health Sciences Research Grants from the Ministry of Health, Labor, and Welfare in Japan. We thank Ms N. Hirata and Ms T. Inoue for their excellent technical assistance.


