Silencing and re-expression of retinoic acid receptor beta2 in human melanoma
Summary
Many melanoma cells are resistant to the anti-proliferative effect of all trans retinoic acid (ATRA). Retinoic Acid Receptor-β2 (RAR-β2) mediates the ATRA growth inhibition. We found a correlation between the anti-proliferative activity of ATRA and expression of RAR-β2. There was not a strict correlation between DNA methylation of RAR-β gene and its expression. There was no difference in global and RARβ specific nucleosome repeat length (NRL) in melanoma and melanocytes or between control and ATRA treated cells. Pan-acetylation of H3 and H4 within the RAR-β gene promoter was higher in cells expressing RAR-β2. All trans retinoic acid treatment of responsive cells did not change pan-acetylation of H3/H4, but addition of ATRA to non-responsive cells increased H4 pan-acetylation. Phytochemicals or the histone deacetylase inhibitor Trichostatin A did not restore expression of RAR-β2. Treatment of WM1366 melanoma cells with 5-aza 2′-deoxycytidine reactivated RAR-β2 gene expression and restored the ability of ATRA to further induce the expression of this gene. Therefore, promoter methylation is responsible for silencing of RAR-β2 in some melanoma cells and pan-acetylation of H3 likely plays a permissive role in expression of RAR-β2.
Significance
Retinoids (vitamin A and its metabolic products) have anti-proliferative and pro-differentiating effects on mammalian cells. However, many cancer cells escape from these regulatory effects of retinoids. Our findings implicate lack of RAR-β2 expression in melanoma in the mechanism of resistance of melanoma to all trans retinoic acid (ATRA) treatment. Reactivation of RAR-β2 expression in melanoma was achieved by inhibition of DNA methylation and importantly restored the ability of ATRA to induce the expression of this gene. Our results suggest possible therapeutic benefit for treatment of melanoma sequentially with DNA methylation inhibitors and ATRA or one of its synthetic analogues.
Introduction
Vitamin A and its metabolic derivatives, collectively known as retinoids, play important roles in the regulation of development, differentiation and cell proliferation (Goodman, 1984). Numerous studies have linked alterations in vitamin A metabolism and/or function to the development and progression of cancer (Fields et al., 2007). Natural and synthetic retinoids have been used, with varying success, as cancer chemotherapeutic or chemoprevention agents (Brtko and Thalhamer, 2003). The most biologically active endogenous retinoid is all-trans-retinoic acid (ATRA). The action of this retinoid is mediated by two classes of nuclear receptors, the retinoic acid receptors (RARs) and the retinoid X receptors (RXRs) (Germain et al., 2006). Each class consists of three receptors encoded by distinct genes (RAR α, β, γ:RXR α, β, γ), and most of the receptors have alternative mRNA isoforms (Germain et al., 2006).
The RAR-β receptor has four isoforms that give rise to receptor proteins with different affinities for retinoic acid. In particular, RAR-β2 receptor expression is decreased or silenced in a large number of cancers and this decrease is correlated with loss of retinoic acid’s ability to inhibit cell proliferation (Lotan, 1996; Sun, 2004; Pavan et al., 2006). Ectopic expression or reactivation of the expression of the endogenous RAR-β2 gene leads to reacquisition of retinoic acid’s ability to inhibit cell proliferation (Xu, 2007). In light of these findings, many investigators consider RAR-β2 to be a tumor suppressor gene. The loss of RAR-β2 expression in cancer cells is rarely due to gene deletion, rather it is due to epigenetic changes (Widschwendter et al., 2001; Wolffe and Matzke, 1999), particularly DNA methylation (Virmani et al., 2001; Shaw et al., 2006).
The incidence of melanoma is increasing more rapidly than any other tumor site. Melanoma accounts for 4% of all skin cancers, but for 79% of all skin cancer related deaths in the United States (Melanoma Research Foundation). Metastatic melanoma is highly resistant to both chemo- and radiotherapy (Soengas and Lowe, 2003). There have been a number of recent studies that documented genetic and molecular changes associated with the development and progression of melanoma (Hocker et al., 2008). However, these potential targets have not yet led to the development of effective/curative therapeutic agents.
Vitamin A metabolism and function in melanocytes and its alteration in melanoma has not been extensively studied. Human epidermal melanocytes are growth inhibited by ATRA (Fligiel et al., 1992). In contrast, ATRA has modest or no effect on the growth of a large number of human melanoma cell lines (Niles, 2002). While ATRA as a single agent is not effective in treatment of metastatic melanoma, its combination with other chemoimmunotherapy agents shows some promise (Recchia et al., 2008). The reason why so many human melanomas are resistant to the ability of ATRA to inhibit proliferation or induce apoptosis is not known, but may be due in part to their decreased expression of RARs and RXRs (Chakravarti et al., 2007). In particular, the RAR-β gene was found to have its promoter methylated in 60% of human melanoma cell lines and clinical specimens (Liu et al., 2008). In the study reported here we compared RAR-β2 mRNA expression, its induction by ATRA and its correlation to inhibition of cell proliferation by ATRA, in human melanocytes relative to three cell lines derived from radial, vertical and metastatic human melanomas. A 580-Kbp region encompassing the RAR-β2 promoter in the melanocytes and melanoma cells was assayed for DNA methylation, NRL and selected histone modifications. A variety of phytochemicals as well as 5-aza-deoxycytidine, a DNA methylation inhibitor and trichostatin A (TSA), a histone deacetylase (HDAC) inhibitor were tested for their ability to reactivate expression of RAR-β2 in WM1366, a vertical growth phase melanoma that totally lacked RAR-β2 mRNA expression.
Results
Effect of retinoic acid on human melanocyte and melanoma proliferation
We initially tested the ability of ATRA to inhibit the proliferation of normal human epidermal melanocytes, SbCl2 cells isolated from a radial growth phase (RGP) melanoma, WM1366 cells isolated from a vertical growth phase (VGP) melanoma, and WM9 cells, isolated from a metastatic melanoma (MET). All trans retinoic acid significantly inhibited the growth of normal melanocytes (42% at 72 h) and SbCl2 cells – 70% at 72 h (Figure 1A, B), but had a minimal effect – 13% non-significant (WM1366, Figure 1C), or a small effect – 22% non-significant (WM9, Figure 1D) on proliferation of the VGP and MET human melanoma cell lines.
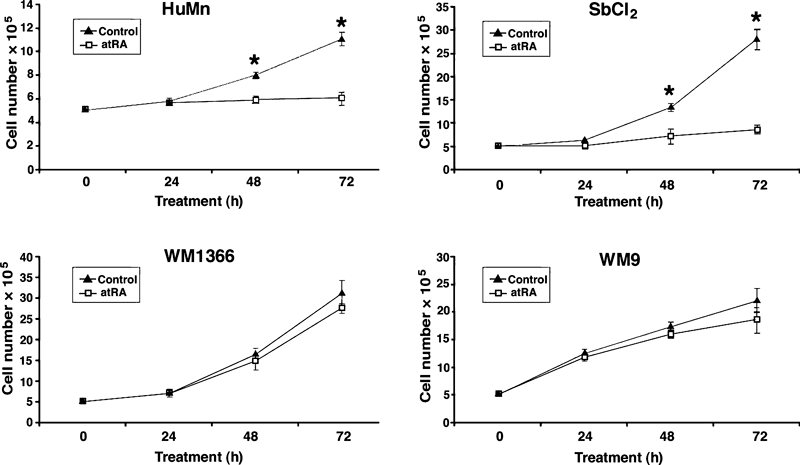
The effect of all trans retinoic acid (ATRA) on the proliferation of normal human melanocytes and human melanoma cell lines. Cells were seeded into dishes and then refed 24 h after seeding with appropriate growth media containing either 0.1% DMSO (control) or 10 μM ATRA. Triplicate dishes from each treatment group were harvested at the indicated times and the number of cells determined by hemocytometer counts. HEMn-LP – normal human melanocytes; SbCL2 – human melanoma cells isolated from a radial growth phase melanoma; WM1366 – human melanoma cells isolated from a vertical growth phase melanoma; WM9 – human melanoma cells isolated from a metastatic melanoma. The data are expressed as the mean ± SEM (error bars). *P < 0.01.
Expression and ATRA-induced increase in RAR-β2 in human melanocytes and melanoma
To determine if RAR-β2 expression might be correlated with the ability of retinoic acid to inhibit the proliferation of human melanoma cells, we measured the expression of RAR-β2 mRNA by qRT-PCR (Figure 2A). Relative to normal human melanocytes (HuMn), the mRNA level of RAR-β2 for all melanoma cells lines was decreased by at least 60%. WM 1366, (VGP) had no detectable expression of RAR-β2 mRNA. Since RAR-β2 is a direct target gene of retinoic acid, we incubated these cell lines with 10 μM ATRA for 24 h and then measured RAR-β2 mRNA levels in both control and treated cells. Relative to control cells, human melanocytes incubated with ATRA had an 11-fold increase in the amount of RAR-β2 mRNA (Figure 1B). SbCl2 cells, (RGP) had almost four times the amount of RAR-β2 mRNA relative to control cells, while W9 cells, (MM) had a small increase in RAR-β2 mRNA and WM1366 (VGP) had undetectable levels of RAR-β2 despite stimulation with ATRA.
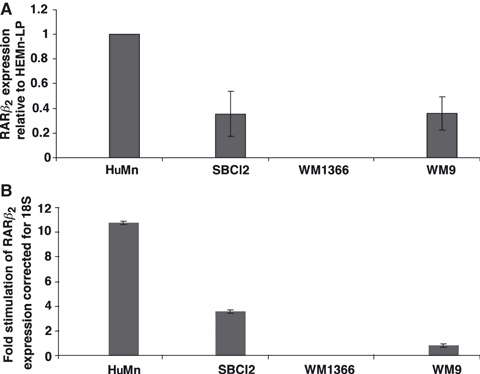
Baseline and all trans retinoic acid (ATRA) stimulation of RAR-β2 mRNA levels in human melanocytes and melanoma cells. The indicated cells were incubated with 0.1% DMSO (control) or 10 μM ATRA for 48 h. Cells were then harvested and processed for measurement of RAR-β2 mRNA using qRT-PCR with specific TaqMan primers as described in Methods. The data in panel A include the amount of basal expression of RAR-β2 mRNA relative to normal human melanocytes which is set as 1.0. The data in panel B include the degree of ATRA stimulation of RAR-β2 mRNA expression relative to DMSO-treated cells (set at 1.0). The data are expressed as the mean ± SEM from triplicate samples. The experiments were repeated two additional times with similar results.
Methylation of the RAR-β gene
We hypothesized, based on literature reports, that the decrease in RAR-β2 mRNA expression in human melanomas, relative to human melanocytes, was due, at least in part, to DNA methylation of the promoter region of the RAR-β gene. To examine this possibility, we performed bisulfite DNA sequencing and methylation-sensitive PCR on the region −329 to +251 of the RAR-β gene in HuMn and the RGP, VGP and MET melanoma cell lines. Figure 3A is a schematic of the DNA region of the RAR-β gene examined in these experiments. The potential methylation sites are represented by the solid bars. Notice that methylation sites are found within and flanking the retinoic acid response element (RARE; −53 to −37). In part B of Figure 3 the methylation status of the CpG sites for 10 clones of each cell line is shown. Human melanocytes and WM9 MET cells have relatively few methylated sites, while both WM1366 (VGP) and SbCL2 (RGP) have methylation at most of the CpG sites. The percent of methylation of each site for all sequenced clones from each of the cell lines is depicted in Figure 3C. The percentage of methylation of the CpG sites is quite low for HuMn and the MET melanoma, while the percent methylation of these same sites is much higher in the RGP and VGP cell lines, with WM 1366 cells (VGP) having the highest percent methylation for almost all of the CpG sites. These results were confirmed by methylation sensitive polymerase chain reaction (MSP) analysis (Figure 3D), which shows low or no methylation in the −329 to +251 region of the RAR β gene in WM9 cells and HuMn. In contrast, WM1366 and SbCl2 showed high levels of methylation in this region.
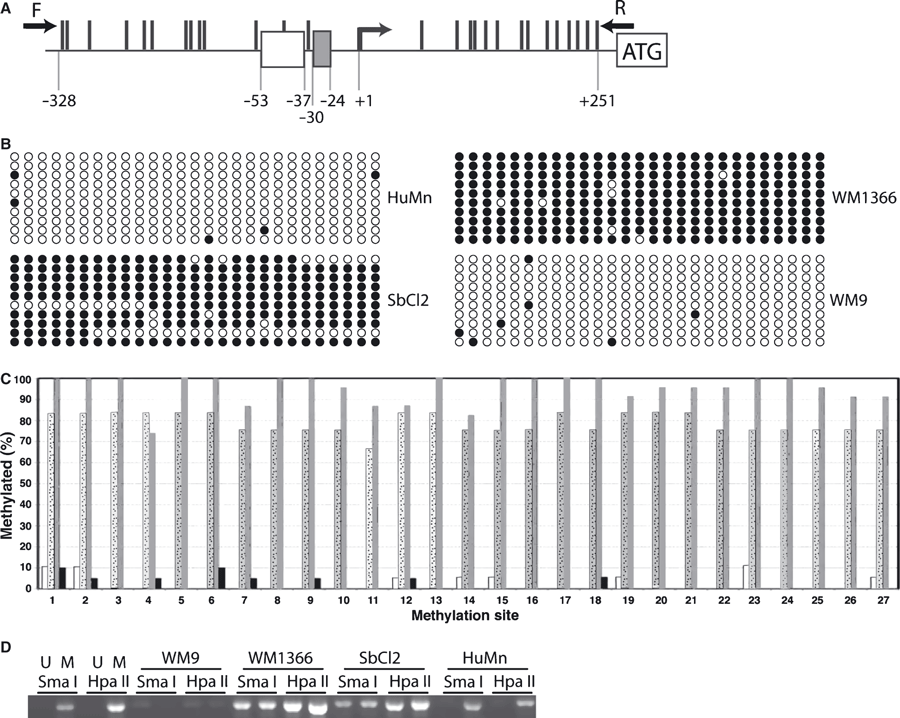
The methylation status of the RARβ promoter changes with melanoma progression. (A) 27 CG sites within the RARβ promoter and 5′ untranslated region were analyzed for methylation. The methylation sites are shown by black lines on the top of the DNA. The retinoic acid response element is shown at position −53 to −37, along with the TATA box at −30 to −24. The solid arrows indicate the location of the primers used to amplify the region between −329 and +252 respectively. (B–C) For each CG site, at least 20 clones were sequenced to determine the methylation status at each of the 27 CpG sites depicted in (A). (B) The methylation status of the first 10 clones sequenced are shown with shaded circles indicating the methylated CpG sites. (C) The overall methylation status for each CpG site is represented here with sites numbered from left to right as depicted in (A) for normal human melanocytes (white bars), SbCl2 cells from a radial growth phase melanoma (stippled bars), WM1366 cells from a vertical growth phase melanoma (solid gray bars), and WM9 cells from a metastatic melanoma (black bars) is shown. (D) Methylation sensitive restriction site PCR results for universal unmethylated DNA (U), universal methylated DNA (M), along with the four cell types analyzed. There are five Hpa II sites and one Sma I site that are all sensitive to methylation present in the region analyzed.
Analysis of the chromatin structure and histone modifications in the RAR-β gene
The measurement of the NRL indicated no statistically significant changes in nucleosome density, hence chromatin condensation upon ATRA treatment in any of the four cell lines tested. In all cases, the global NRL values were centered around 192 bp (see Figure 4 NRL, top panel), with a slightly higher value reported for the metastatic cells treated with ATRA, but again with no statistical significance. The RARβ promoter NRL value obtained using a probe hybridizing the promoter region (−337 to −54) showed a slightly higher NRL of ∼207–208 bp in normal cells (treated or untreated) that would correspond to a more open chromatin structure, a result compatible with an expectedly more transcriptionally active chromatin (see Figure 4 NRL, bottom panel). For the cell lines representative of radial, vertical growth, and metastatic phases, the average NRL was also slightly above the global NRL value of ∼192 bp, but again showed no statistically significant differences between the ATRA-treated and untreated cells, indicative of a lack of overall chromatin compaction or decondensation.
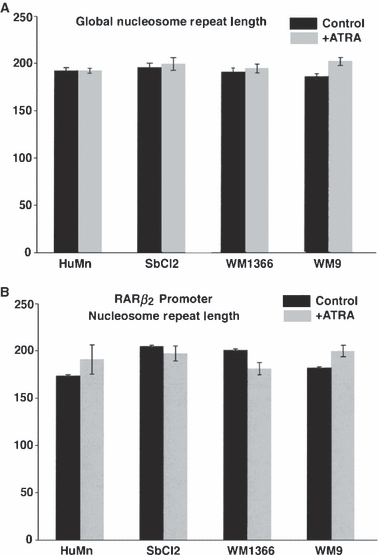
Nucleosome Repeat Length (NRL) analysis of normal human melanocytes and human melanoma cell lines with and without all trans retinoic acid treatment. Nuclei from melanocytes and melanoma cella were digested with micrococcal nuclease, and the resulting DNA fragments electrophoresed as described in Methods. Ethidium Bromide staining revealed the global NRL (A), while Southern blotting was utilized to obtain the NRL along the −337 to −54 region of the RAR-β2 promoter (B). The average NRL represents the size of the tetranucleosome fragment (in bp) divided by 4. The data are expressed as the mean ± SEM from triplicate biological samples.
Histone post-translational modifications
To further understand the regulatory mechanism involved in melanoma cells’ response to RA treatment, we decided to investigate possible changes in levels of histone post-translational modifications (HPTM) that have been reported to be associated with alterations in transcription. The hyper acetylation of lysines 9 and 14 of histones H3 and lysines 5, 8, 12, and 16 of histone H4 as well as phosphorylation of serine 10 of histone H3 are usually associated with actively transcribed genes (Jenuwein and Allis, 2001). To evaluate whether the RAR β gene was altered in acetylation of histones H3 and H4 or phosphorylation of serine 10 of histone 3 in melanocytes versus melanoma and in control versus ATRA-treated cells, we performed Chromatin Immunoprecipitation (ChIP) experiments using anti pan-acetylated H3 (K9, K14) and H4 (K5, K8, K12, and K16) histones and anti-H3 phosphorylated Ser10 antibodies. Both basal levels and potential relative enrichment of each of these modified histones before and after RA treatment were quantified (See Figure 5 ChIP and Table 1). Untreated normal melanocytes and radial growth phase SbCl2 cells displayed a high H3 and H4 acetylation level, with a particularly high level of acetylated H4 in SbCl2 cells. H3S10 phosphorylation (H3S10P) levels were low in all cells. Based on the ‘histone code’, these results are consistent with high levels of transcription.
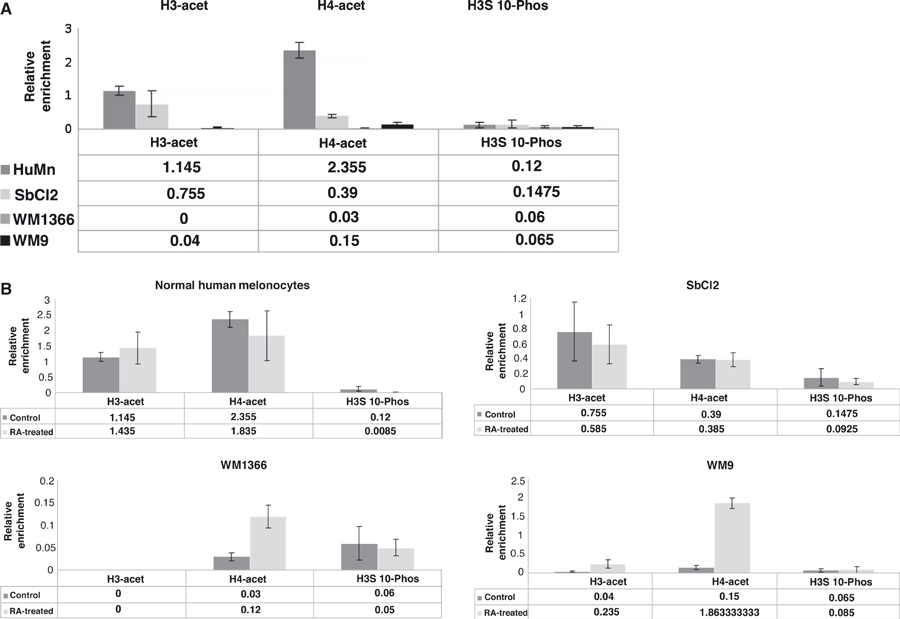
Chromatin Immunoprecipitation (ChIP) analysis for the presence of histone modifications associated with the RAR-β2 promoter in human melanocytes and human melanoma cell lines. Primers amplifying the −328 to −24 region of the RAR-β2 promoter were used to quantify relative enrichment, defined as immunoprecipitated (IP) DNA/total input DNA. Serial dilutions of input DNA were used to calculate unknown IP values, normalized to mock-IP amounts. Data for untreated cell lines (A), as well as cell lines treated with all trans retinoic acid (B), are representative of the mean of three biological replicates ±SEM.
| Cell lines | Human melanocytes | SbCl2 (radial growth phase) | WM1366 (vertical growth phase) | WM9 (metastatic melanoma) |
|---|---|---|---|---|
| RARβ2 mRNA level | −ATRA +++ATRA ++++ | −ATRA ++ATRA +++ | −ATRA −−+ATRA −− | −ATRA ++ATRA + |
| ATRA growth inhibition | +++ | +++ | −−− | +/− |
| RARβ promoter DNA methylation | −/+ | +++++ | +++++ | + |
| RARβ promoter histone acetylation | −ATRA H3 +++ATRA H3 +++−ATRA H4 +++++ATRA H4 +++ | −ATRA H3 ++ATRA H3 +−ATRA H4 +/−+ATRA H4 +/− | −ATRA H3 −+ATRA H3 −−ATRA H4 +/−+ATRA H4 + | −ATRA H3 −/++ATRA H3 +−ATRA H4 +/−+ATRA H4 ++ |
- ATRA, all trans retinoic acid; RARβ, retinoic acid receptor-β.
- +, relative degree of expression/growth inhibition.
- −, no expression of growth inhibition.
When we compared the levels of the same histone modifications before and after ATRA treatment of these cells, we observed no significant change in H3 or H4 acetylation levels in normal melanocytes or cells from a radial growth phase melanoma, despite an increase in the amount of RARβ2 mRNA (see Figure 2). In contrast, the levels of H4 acetylation of WM1366 (vertical growth phase melanoma) and WM9 (metastatic melanoma) were significantly higher in ATRA-treated versus control cells. Since the mRNA levels of RAR-β2 are low (WM9), or not detectable (WM1366) in those two cells lines and are not increased by ATRA, and the fact the H3 and H4 acetylation is usually considered a marker of active transcription, (Jenuwein and Allis, 2001), we did not expect to see any increase in these specific post-translational modifications. The amount of H3 S10P, another marker of active transcription, was low in most of the cells studied and did not change when these cells were treated with ATRA.
Reactivation of RAR-β2 mRNA expression in WM1366 melanoma cells
It has been reported that various phytochemicals, such as genistein, can reactivate expression of RAR-β2 (Fang et al., 2005). We tested a variety of phytochemicals for their ability to increase expression of RAR-β2 mRNA in WM1366 human melanoma cells. These cells do not have detectable levels of RAR-β2 mRNA and treatment with ATRA did not increase RAR-β2 expression (Figure 2). Treating the WM1366 cells for 5 d with concentrations of phytochemicals that were reported to stimulate RAR-β2 expression in other types of tumor cells (Fang et al., 2005), did not increase RAR-β2 mRNA levels in these cells (Figure 6A). However, treatment of WM1366 cells with the DNA methylation inhibitor 5-aza, 2′-deoxycytidine (aza) at a concentration of 0.5 μM for 5 d reactivated RAR-β2 expression (Figure 6A). Treatment of WM1366 cells for 5 d with 25 ng/ml of the HDAC inhibitor TSA did not reactivate RAR-β2 expression (Figure 6B). Also when TSA was combined with aza, it did not further enhance the reactivation of RAR-β2 mRNA expression over that seen with aza alone (Figure 6B). In addition, to reactivating basal expression of RAR-β2 in WM1366 cells, aza treatment also sensitized these cells to retinoic acid induction of RAR-β2 mRNA expression (Figure 6C). Compared to aza alone (set as 1.0), a 24 h ATRA treatment of cells preincubated for 5 d with aza, resulted in a 12-fold increase in RAR-β2 mRNA levels.
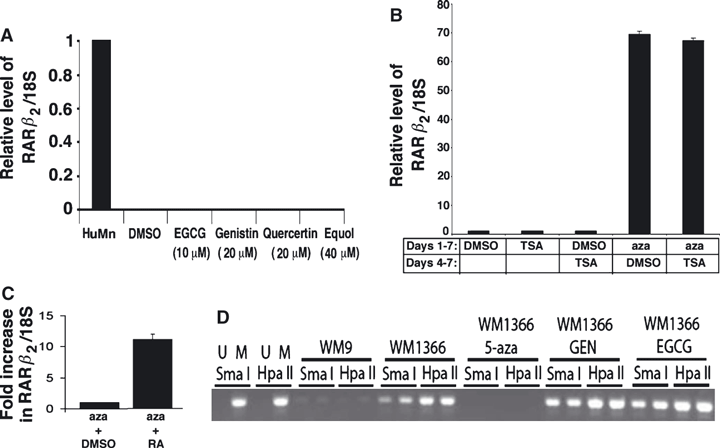
Reactivation of RAR-β2 expression in WM1366 cells. (A) WM1366 cells were treated for 5 d with the indicated concentrations of phytochemicals. Cells were then harvested and the amount of RAR-β2 mRNA measured by qRT-PCR as described in Methods. DMSO-treated normal human melanocytes (HuMn) were used as a positive control (see Figure 2) and the level of RAR-β2 mRNA in these cells set at 1.0. (B) WM1366 cells were treated for 6 d with the histone deacetylase inhibitor Trichostatin A (TSA – 25 ng/ml) or the DNA methylation inhibitor 5-aza-2′-deoxycytidine (aza-0.5 μM). In separate experiments WM1366 cells were treated with aza for 72 h and then DMSO or TSA added together with aza for an additional 72 h. At the end of these experiments, cells were harvested and the amount of RAR-β2 mRNA measured by qRT-PCR as described in Methods. (C) WM1366 cells were treated for 5 d with aza (0.5 μM) and then incubated an additional 24 h with either DMSO or 10 μM all trans retinoic acid (ATRA). Cells were harvested and the amount of RAR-β2 mRNA determined by qRT-PCR as described in Methods. The data are expressed as the fold increase in RAR-β2 mRNA levels in ATRA-treated cells versus DMSO-treated cells. (D) Methylation sensitive restriction site PCR showing universal controls, WM9 cells with low levels of methylation, WM1366 cells with high levels, and levels of methylation in WM1366 cells after treatment with 5-aza-2′-deoxycytidine (aza), genistein (GEN), and epigallocatechin gallate (EGCG).
To ensure that aza was decreasing DNA methylation within the −329 to +251 region of the RAR-β gene in WM1366 cells, we performed methylation sensitive restriction site PCR analysis. Figure 6D shows that aza treatment for 5 d resulted in a complete loss of methylated sites within the −329 to +251 region of the RAR-β gene. In contrast, treatment of these cells with genistein or epigallocatechin gallate (EGCG) for 5 d did not alter the DNA methylation within the −329 to +251 region of the RAR-β gene in WM1366 cells.
Discussion
Many human melanoma cell lines are either insensitive or weakly sensitive to the growth inhibitory effects of ATRA (Fligiel et al., 1992; Niles, 2002). In this study we found that in a series of human melanoma cell lines derived from different stages of melanoma progression, there was a strong correlation between the ability of retinoic acid to inhibit cell proliferation and the basal/retinoic acid-stimulated levels of RAR-β2. Studies have reported similar findings in other types of tumors (Zhuang et al., 2003; Sabichi et al., 1998). Therefore, silencing of the RAR-β gene may play a role in the resistance of human melanoma cell lines and tumors (Recchia et al., 2008) to ATRA. Ideally, we would have also measured RAR-β protein, in order to determine if protein and mRNA levels correlated. However, in our hands, none of the commercially available antibodies are sufficiently sensitive or specific to allow the accurate measurement of RAR-beta protein in our human melanocytes or melanoma cell lines.
The RAR-β gene is frequently methylated in human cancers including melanoma (Widschwendter et al., 2001; Wolffe and Matzke, 1999; Virmani et al., 2001; Liu et al., 2008). To determine whether an altered methylation pattern in the RAR-β gene was correlated with resistance to ATRA treatment in our cell lines, we measured DNA methylated sites within the −329 to +251 region of the RAR-β gene. This region includes a consensus RARE site previously shown to mediate retinoic acid stimulation of RAR-β2 gene transcription (Shen et al., 1991). Surprisingly, we did not find a strict correlation between DNA methylation in this region and expression of RAR-β2 mRNA. For example, while CpG island methylation is very low in HuMn which express high levels of RAR-β2, it is also very low in WM9 cells which express very low amounts of RAR-β2 mRNA. Conversely, most CpG islands are methylated in WM1366 that do not express RAR-β2, but these sites are also methylated in SbCl2 cells that express RAR-β2 and respond the ATRA treatment by increasing the expression of RAR-β2. Therefore, it is unlikely that changes in DNA methylation alone can explain the decrease or absence of RAR-β2 mRNA expression in all melanoma cell lines and tumors.
In light of the above finding we decided to investigate the role of chromatin in the regulation of RAR-β gene expression. To evaluate the importance of chromatin condensation, we measured the NRL within the RAR-β gene in the presence or absence of ATRA. Histone post-translational modifications within the RAR-β gene were also investigated. Decreased nucleosome spacing is associated with gene silencing (De Ambrosis et al., 1987), while increased spacing is usually associated with gene activation (De Ambrosis et al., 1987). Examination of NRL values in all cell lines showed no statistically significant differences in either global NRL or RAR-β promoter-associated chromatin condensation. All trans retinoic acid treatment did not appear to influence nucleosome distribution that might result in compaction or unfolding. Therefore, chromatin packing, at least at the level of NRL, is unlikely to explain silencing of RAR-β gene expression in our melanoma cell lines.
Another change that influences gene expression is the status of HPTM. As a general rule, high levels of histone acetylation are associated with a more open chromatin conformation leading to increased DNA availability for transcription. Histone deacetylase inhibitors, through shifting the acetylation/deacetylation equilibrium towards an increase of histone H3 and H4 acetylation, can reactivate silenced genes and inhibit cancer growth in patients (Ma et al., 2009). Some studies indicate that RAR-β gene expression can be reactivated in melanoma cells treated with HDAC inhibitors (Demary et al., 2001; Kato et al., 2007). To address this particular regulatory mechanism in our melanoma cells, we examined the level of histone acetylation associated with the RAR-β promoter in HuMn and in our series of human melanoma cells that have different levels of RAR-β2 expression. A major difference was that HuMn and SbCl2 cells, which express basal levels of RAR-β mRNA, displayed a medium to high level of H3 and H4 acetylation, while little to no H3/H4 acetylation was detected in WM1366 and WM9 cells. These latter cells have either no (WM1366) or small (WM9) amounts of RAR-β expression. To our knowledge ours is the first study to demonstrate a correlation between H3/H4 acetylation within the RAR-β promoter and the degree of RAR-β expression in melanocytes and melanoma. When melanocytes and melanoma cells were treated with ATRA, there was no significant change in H3/H4 acetylation associated with the RAR-β promoter in melanocytes or SbCl2 cells. However, ATRA caused a significant increase in H4, but not H3 acetylation in WM1366 and WM9 cells. This is an unexpected finding since ATRA has either no effect (WM1366), or a very small effect (WM9) on stimulation of RAR-β2 expression, and generally, H3 and H4 pan acetylation have been associated with increased gene transcriptional activity (Munshi et al., 2009). Similar to our findings, Suh et al. (2002) found that low or lack of RAR-β2 expression in lung cancer specimens was linked to low H3 acetylation. They also reported an increase in histone H4 acetylation level when lung cancer cells were treated with ATRA, despite the lack of induction of RAR-β2 expression. Decreased expression of RAR-β2 in thyroid cancer cells was linked with decreased histone H3 and H4 acetylation within the RAR-b promoter (Cras et al., 2007). The similarities between these reports and our work suggest that pan-H3 acetylation is involved in the regulation of expression of the RAR-β gene and its ability to respond to ATRA treatment. A speculation is that certain lysine acetylation sites on histone H-4 might be involved in inhibition of RAR-β transcription in response to ATRA treatment of cancer cells. Further research is necessary to identify other potential histone PTMs, such as lysine methylation that might affect the expression of the RAR-β gene.
In the last series of experiments, we tried various treatments to reactivate RAR-β2 expression in the WM1366 cells. We chose this cell line because it had no detectable RAR-β2 expression in either the absence or presence of ATRA. We used a series of phytochemicals to try to reactivate RAR-β2 expression. Some of these phytochemicals such as genistein have been reported to alter DNA methyltransferase activity (Fang et al., 2005). However, none of these compounds at concentrations reported in the literature to be effective (Fang et al., 2005) reactivated RAR-β2 expression in WM1366 human melanoma cells. In contrast, treatment of these cells with the DNA methylation inhibitor 5-aza-2′-deoxycytidine (aza) activated basal expression of RAR-β2 in WM133 cells and also resulted in restoration of the ability of ATRA to induce RAR-β2 expression. Interestingly, the HDAC inhibitor TSA did not restore expression of RAR-β2 in WM1366 cells and did not synergize with aza to further enhance RAR-β2 expression. A pertinent question is whether this restoration of RAR-β2 expression resulted in the ability of ATRA to inhibit cell proliferation in the previous insensitive cell line. Unfortunately, aza by itself strongly inhibited proliferation of WM1366 and this precluded us from testing the growth inhibitory properties of ATRA. This action of aza was not unexpected since it is non-specific and many genes will be demethylated; some of these now active genes likely lead to suppression of proliferation. Examination of the RAR-β promoter region in WM1366 cells using methylation-sensitive PCR confirmed that the phytochemicals failed to alter methylation while aza cause demethylation of the DNA. Several other studies have shown that treatment of cancer cells with aza reactivates RAR-β2 gene expression (Yang et al., 2002; Liu et al., 2005). However, our study appears to be the first to show that reactivation of RAR-β2 expression in melanoma is associated with demethylation of CpG islands in the RAR-β promoter.
Overall our study indicates that silencing of RAR-β2 expression in melanoma likely occurs by several different mechanisms. In WM1366 cells, derived from a vertical phase melanoma, DNA methylation appears to be the predominant mechanism for silencing of RAR-β2 expression. However, WM9 metastatic melanoma cells also have limited RAR-β2 expression yet have little DNA methylation in the RAR-β promoter. This finding suggests that regulation of RAR-β2 expression in WM9 cells involves other mechanisms, such as modulating the levels of acetylation of histone H3 and H4. However, other epigenetic modifications may also be involved in this process. Further investigation of changes in the levels of other histone PTMs and presence of specific co-activators or co-repressors will be required to obtain a more complete picture of the mechanisms by which different human melanomas silence the expression of RAR-β2. There have also been reports that decreased expression of RXRα might be responsible for decreased ability of ATRA to inhibit growth and stimulate expression of RARβ2 mRNA (Boehm et al., 2004; Chakravarti et al., 2007). In supplementary data for this study (Fig. S1) we show that the mRNA levels of RARα,γ, and RXRα,β,γ in six different melanoma cell lines, including the three used in this study, are mostly lower than HuMn. We could not find a correlation between the expression of any of these receptors and the ability of ATRA to inhibit growth and stimulate expression of RARβ2. Perhaps by discerning the mechanism for RAR-β2 silencing in melanoma tumors removed from patients, more selective DNA methylation or HDAC inhibitors can be developed to treat patients with melanoma so that their tumor become responsive to ATRA-induced growth inhibition and differentiation.
Methods
All chemicals, unless otherwise indicated, were obtained from Sigma Chemical Co., St. Louis, MO, USA. A variety of molecular biology kits were obtained from Invitrogen, Carlsbad, CA, USA. Taqman probes for qRT-PCR were obtained from ABI, Foster City, CA, USA.
Cells and cell culture
SbCl2, (RGP), WM1366, (VGP), and WM9, (metastatic melanoma) cells were a generous gift from Meenhard Herlyn’s lab at the Wistar Institute (University of Pennsylvania). All cells were grown in a humidified incubator with 5% CO2 and 95% air at 37°C. The SbCl2 cells were cultured in MCDB153 media (Invitrogen), supplemented with 2% fetal bovine serum, 5 μg/ml insulin (Sigma Chemical), 1.68 mM CaCl2, 100 units/ml penicillin streptomycin solution (Invitrogen Corp.). WM1366 and WM9 cells were cultured in a similar manner except they contained 10% fetal bovine serum and no CaCl2. Normal human melanocytes were derived from human foreskin (Cascade Biologics, Portland, OR, USA) and maintained in Medium 254 supplemented with 50 ml Human Melanocyte Growth Supplement (HMGS) (Cascade Biologics) and 1 ml PSA solution (Cascade). To ensure changes reported in results were not due to the different compositions of the tissue culture media, SbCl2 cells and human melanocytes were incubated for 48 h in MCBD153 medium plus 10% FBS and assayed for the level of RAR-β2 expression by qRT-PCR. There was little difference in basal and ATRA-stimulated RAR-β mRNA levels between cells grown in the customized media and those incubated for 48 h in the standard MCBD153 medium.
In the reactivation of RAR-β2 expression studies, WM1366 cells were treated with the following compounds: 10–20 μM equol; 10–20 μM genistein; 1, 5, and 10 μM EGCG; and 10–20 μM quercetin. After 6 d of treatment, replenishing the cells with tissue culture medium containing the compounds every 2 d, cells were harvested and RNA isolated as described below. WM1366 cells were also treated with 0.5 μM 5-aza 2′-deoxycytidine alone or Trichostatin A (TSA – 25 ng/ml) for 6 d, or for 3 d 5-aza 2′-deoxycytidine and then in combination with TSA for another 3 d. In separate experiments, cells were treated for 5 d with 5-aza 2′-deoxycytidine and then treated with either DMSO or 10 μM ATRA for 24 h. At the end of these treatment times cells were harvested and RNA isolated for qRT-PCR as described below.
qRT-PCR
RNA was isolated from cells using the RNeasy kit (Qiagen, Valencia, CA, USA). The purified RNA samples were dissolved in RNase-free water and quantified by using a Nanodrop spectrophotometer (NanoDrop Technology, Inc., Wilmington, DE, USA). Each RNA sample had an A260/A280 ratio of 1.8 or higher. Prior to synthesis of cDNA, the quality of RNA was determined on the Agilent 2100 Bioanalyzer, using the RNA 6000 Nano Assay kit (Agilent Technologies, Wilmington, DE, USA). Synthesis of cDNA was performed using the Advantage RT-for-PCR kit (Clontech, Mountain View, CA, USA), according to the manufacturer’s instructions. cDNA (4 μl out of 20 μl volume) generated from 1 μg of total RNA was then used to perform qPCR on the ABI PRISM 7000 Sequence Detection System instrument by using TaqMan Gene Expression Assays (Applied Biosystems, Foster City, CA, USA). The amount of RAR-β2 mRNA relative to 18s rRNA was calculated and corrected for efficiency based on 2−ΔΔCT method. [ΔΔCT = (CTtarget−CT18s)B−(CTtarget−CT18s)A]. The qRT-PCR was performed on triplicate samples from each group (control versus ATRA-treated). Data are expressed as the mean (±SEM).
Bisulfite DNA sequencing
DNA was harvested from cells grown on plates by using the GenElute™ mammalian genomic DNA miniprep kit (Sigma, cat # G1N70). DNA concentration was obtained through spectrophotometric analysis with a Nanodrop™ 1000 system (Thermo Scientific, Rochester, NY, USA). About 500 ng of DNA was subjected to bisulfite conversion using an EZ DNA methylation Kit™ (Zymo Research, Orange, CA, USA, ca # D5006). Five microliter of bisulfite treated DNA was used as template in a nested PCR reaction. The first phase PCR reaction used primers [gta tag agg aat tta aag tgt ggg ttg gg] and [cct ata att aat cca aat aat cat tta cc] at an annealing temperature of 56°C for 30 cycles. The second phase of the PCR reaction used 2 μl of the first round of PCR as template. The primers for the nested reaction were [gta gg(c/t) gga ata ttg ttt ttt aag tta ag] and [aat cat tta cca ttt tcc aaa ctt act c] and were used at an annealing temperature of 57°C for 30 cycles. All PCR reactions had an initial denaturing step at 95°C for 5 min and a final extension step at 72°C for 7 min. PCR amplicons were cloned using the TOPO TA Cloning™ kit for sequencing (Invitrogen, cat # K4575-01). DNA was harvested from individual clones using DNeasy blood and tissue kit (Qiagen, cat # 69504). Triplicate samples of DNA from at least 20 clones were reacted with bisulfite and then sequenced for each sample type. Standards of unmethylated and methylated DNA (Chemicon International, cat #s S7821 and S7822) were sequenced to verify the bisulfite reaction was complete.
Nucleosome repeat length
Nuclei isolation
The harvested cells were washed twice with cold phosphate buffer and re-suspended in buffer 1 (10 mM Hepes, pH 7.8, 0.3 M sucrose, 2 mM magnesium acetate, 3 mM CaCl2, 1% Triton X-100, 0.5 mM DTT, and 0.5 mM PMSF). To lyse the cells, we used a Dounce homogenizer and then diluted the homogenates at a ratio of 1:1 in buffer 2 (10 mM Hepes, pH 7.8, 25% glycerol, 5 mM magnesium acetate, 0.1 mM EDTA, and 0.5 mM DTT). After centrifugation at 4°C for 15 min at 1000 g, the nuclei in the pellet were re-suspended in buffer 2 (200 μl for 106 starting cells). The DNA concentration was estimated by measuring the OD260.
Nucleosome repeat length analysis
The isolated nuclei (20–50 μg protein) from cells treated +/− ATRA were digested using 5 units of micrococal nuclease for 1, 5, and 10 min at room temperature as described in Becker and Wu (1992). The digested chromatin was then treated with RNase, digested with Proteinase K (1 μg for 60 m at 52°C), followed by phenol/chloroform extraction, and ethanol precipitation as described in Becker and Wu (1992). Gel electrophoresis of the digested products was performed in 1% agarose in 1× TAE, next to a molecular weight marker containing a 100-bp ladder. After electrophoresis and ethidium bromide staining, the global average NRL were determined by measuring the distances of migration of the band corresponding to tetranucleosomes, as described by Rodríguez-Campos et al. (1989). It is important to note that repeat lengths are best evaluated using measurements from oligonucleosome (we selected the tetranucleosome as a standard) to minimize the contribution of end trimming by micrococcal nuclease. To determine the local NRL over the RAR-β2 gene, we transferred the DNA to a nitrocellulose membrane and performed Southern blots probing with a labeled PCR amplicon hybridizing with the −337 to −54 region of the RAR-β2 promoter region. The amplicon was labeled using the Amersham Gene Images AlkPhos Direct Labeling and Detection System, according to the manufacturer’s specifications.
Chromatin Immunoprecipitation (ChIP) analysis of histone modifications
Chromatin Immunoprecipitation experiments were performed according to company (Millipore) protocols, as described by John et al. (2008). Briefly, 1 × 10⁶ cells were collected for each cell line treated or untreated with 10 μM ATRA for 24 h. Protein was cross-linked to DNA through exposure to 1% formaldehyde for 5 min at room temperature. After centrifugation, the cell pellets were re-suspended in a 1% SDS lysis buffer containing Halt Protease Inhibitor Cocktail (Pierce, Rockville, IL, USA) and sonicated using the Bioruptor TM sonicator (Sparta, NJ, USA) on ice to give an average of 0.5- to 1.2-kb of sheared genomic DNA. Samples were then centrifuged to remove debris, and the supernatant was diluted 1:10 to reduce the SDS concentration. Two hundred microgram of chromatin (DNA concentration based on a 260/280 ratio) was precleared with protein A-agarose beads (Millipore) to reduce non-specific binding of proteins. An aliquot of input chromatin was removed for later quantification. Antibodies against pan-acetyl-H3 (Upstate Biotechnology, Lake Placid, NY, USA), pan-acetyl-H4 (Upstate Biotechnology), and phospho-H3S10 (Abcam) were used for immunoprecipitation of protein–DNA complexes. The antibodies were incubated with sheared and precleared chromatin overnight at 4°C with constant agitation. The immune complexes were collected by incubating the chromatin/antibody mixture with protein A-agarose beads for 1 h. The complexes were washed once with low salt buffer, followed by another wash using high salt buffer, and finally TE buffer. The last step consisted of elution of the immunoprecipitated material using two washes of a 1% SDS solution. Reversal of protein cross-linking was performed by incubating the samples for 4 h at 65°C. The immunoprecipitated DNA was isolated by phenol/chloroform extraction followed by ethanol precipitation. These DNA samples, as well as the input material and the mock immunoprecipitated samples were resuspended in 30 μl of sterile water, and 2 μl aliquots were used as a template for the individual PCR reactions. Primers were designed to amplify a 283 bp sequence of the RAR-® promoter region (−328 to −24) using 30 PCR cycles. Relative enrichment (IP/Total input) was determined using serial dilution of input DNA to calculate unknown IP values.
Acknowledgements
The authors would like to thank Dr. Meenhard Herlyn, Wistar Institute, University of Pennsylvania for supplying us with the human melanoma cell lines used in this study. We would also like to thank Margaret McFarland for preparing the figures for this manuscript. This research was supported in part by grants CA124637 (RMN) from the NCI; RR020180 (RMN) from the NCRR; EPS-0554328 (PG) from NSF-EPSCoR; EPS08-05 from WV WPSCoR (PG) and RO3CA129790 (VS) from the NCI.


