Mechanism and Efficiency of Cell Death of Type II Photosensitizers: Effect of Zinc Chelation†
This paper is part of the Special Issue on the 21th Conference of the IAPS.
Abstract
A series of meso-substituted tetra-cationic porphyrins, which have methyl and octyl substituents, was studied in order to understand the effect of zinc chelation and photosensitizer subcellular localization in the mechanism of cell death. Zinc chelation does not change the photophysical properties of the photosensitizers (all molecules studied are type II photosensitizers) but affects considerably the interaction of the porphyrins with membranes, reducing mitochondrial accumulation. The total amount of intracellular reactive species induced by treating cells with photosensitizer and light is similar for zinc-chelated and free-base porphyrins that have the same alkyl substituent. Zinc-chelated porphyrins, which are poorly accumulated in mitochondria, show higher efficiency of cell death with features of apoptosis (higher MTT response compared with trypan blue staining, specific acridine orange/ethidium bromide staining, loss of mitochondrial transmembrane potential, stronger cytochrome c release and larger sub-G1 cell population), whereas nonchelated porphyrins, which are considerably more concentrated in mitochondria, triggered mainly necrotic cell death. We hypothesized that zinc-chelation protects the photoinduced properties of the porphyrins in the mitochondrial environment.
Introduction
Photodynamic therapy (PDT) has evolved considerably in recent years becoming an important alternative to treat several cancerous and noncancerous diseases (1–4). Nevertheless, the actual photochemical and photobiological mechanisms taking place in the biological realm are not completely understood, requiring extensive investigation (1–6). We and others consider that gaining knowledge on the specific light and dark mechanisms will lead to the development of more efficient photosensitizers for PDT (1–7).
PDT can induce several mechanisms of controlled cell death (apoptosis, necrosis and autophagy) as well as uncontrolled necrosis (1,5,7–9). The efficiency and mechanism of cell death have been related to the intracellular localization of the photosensitizers (10–23). Photosensitizers that concentrate in mitochondria (10–13,23), endoplasmatic reticulum (14,15) or lysosomes (16,17) have been shown to induce apoptotic cell death. Interestingly, under similar experimental conditions, necrotic cell death has also been reported in different cell lines (18–22).
The reason why a certain experimental protocol leads to a specific mechanism of cell death has different biological origins but is somehow related with the amount of damage induced in the cells. However, manuscripts describing quantitative distinctions among the different mechanisms of cell death are rare (1,5,7–9,22). In other words, one can control the experimental conditions to favor one or the other mechanism of cell death in order to prove that this specific mechanism can be triggered by photosensitization, however, standard cell-type PDT protocols usually show the coexistence of different mechanisms of cell death, making it difficult to establish clear structure/activity relationships (20).
There are studies aiming to establish relationships among molecular structure, cell localization, efficiency and mechanism of cell death (6,7,24–27). We have recently shown that a type I PS (crystal violet), which concentrates in mitochondria but generates very small amounts of triplets and of reactive oxygen species (ROS), can be more efficient than a type II photosensitizer (methylene blue), which generates a considerable amount of ROS diffusively distributed in the intracellular domain (6).
In this report, we aim to establish quantitative relationships between efficiency/mechanism of cell death and the molecular structure of type II photosensitizers. We used a series of positively charged porphyrins chelated or not with zinc. We have shown in a previous study that the photophysical properties of these molecules are very similar among the series (all of them generate singlet oxygen with a yield of 0.8). Zinc chelation facilitates binding in membranes, increases the efficiency of cell killing (as quantified by MTT) and, curiously, decreases the interaction with mitochondria (28).
The goal of this work is to understand how zinc chelation and subcellular localization are related with the mechanism of cell death. Rather than trying to quantify necrosis and apoptosis by standard kits, our experimental strategy is to measure and compare damages imparted to cellular structures, mainly mitochondria and cytoplasmic membrane (CM).
Materials and Methods
Chemicals. Digitonin, bovine serum albumine (BSA), rhodamine 123, propidium iodide, ribonuclease A, saponin, Tween-20, sodium azide, paraformaldehyde, trypan blue solution 0.4%, 2′,7′-dichlorodihydrofluorescein diacetate (DCFHDA) were purchased from Sigma-Aldrich. Anticytochrome c monoclonal antibody (clone 6H2.B4), PE-labeled secondary antibody anti IgG1, and FITC Rabbit antiactive caspase-3 were purchased from BD Pharmingen.
Photosensitizers, cell culture and irradiation protocol. Synthesis, purification and characterization of the meso-substituted tetra-cationic porphyrins (Fig. 1) were reported previously (28). We named them P1 to P4 to facilitate reading the text. Human cervical adenocarcinoma cell line (HeLa-ATCC CCL-2) was routinely grown in 75 cm2 plastic culture bottle in Dulbecco’s Minimum Eagle medium (DMEM) supplemented with 10% fetal calf serum (FCS) and 1% penicillin/streptomycin, and maintained at 37°C in a humid incubator with 5% CO2. Cells were detached from the bottle with tripsin.
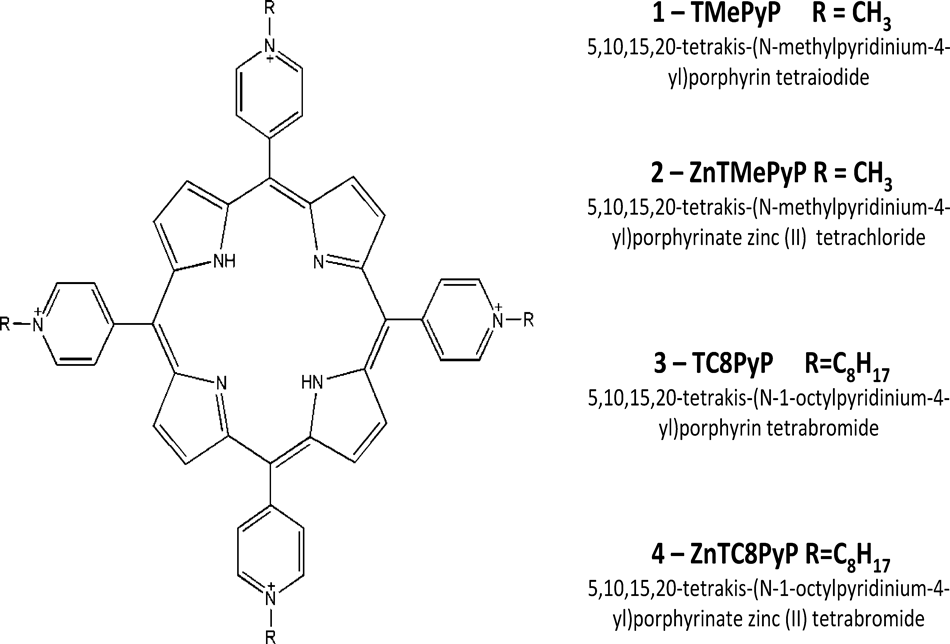
Porphyrin (P) structures and chemical names, referred to throughout the text as P1, P2, P3 and P4.
Cells were seeded in six-well plates (5 × 10⁵ cells per well) or 12-well plates (2.5 × 10⁵ cells per well) for treatment with free-base and zinc porphyrins, respectively. After 18 h, cells were exposed to porphyrin solutions in DMEM without phenol red and without FCS in the following concentrations: TMePyP (P1)—13 μmol·L−1; ZnTMePyP (P2)—19 μmol·L−1; TC8PyP (P3)—14 μmol·L−1; ZnTC8PyP (P4)—6.0 μmol·L−1 for 3 h. Photosensitizer uptake was shown to vary within this series (28). We incubated cells with different photosensitizer concentrations to make sure that the same amount of photons was absorbed by the photosensitizers within the cells, by considering the cell uptake and the absorption properties of the photosensitizers at the excitation wavelengths (see below).
Cells were washed with PBS and irradiated in the presence of PBS (7 cycles of 1 min of irradiation and 1 min in the dark). Although the removal of FCS makes our in vitro system a worse model for the situation in vivo, it also lessens the number of experimental variables, facilitating the interpretation of the results. For example, photosensitizers can have different binding efficiencies to the components of the serum, which can affect their photodynamic performances (29). Because we want to compare the efficiencies within the series, we find it appropriate to be a bit distant from the in vivo situation but to have more control of the possible explanations. The irradiations were performed using the Laser line INOVA emitting at 650 nm for free-base porphyrins and the Morgotron Laser emitting at 532 nm for the zinc porphyrins (final dose 175 mJ·cm−2 for both systems). The free-base porphyrins present an intense Soret band and four Q bands whereas the zinc porphyrins present a redshifted Soret band (16 nm) and two Q bands. Free-base porphyrins present an absorption band maxima around 650 nm, whereas at this wavelength zinc porphyrins present very weak absorption. Therefore, in order to allow similar light-dose absorption within the series, we had to use different wavelengths of excitation. The photophysical properties of the photosensitizers as well as further details of the illumination protocols were published previously (28). After irradiation, cells were maintained in DMEM on the incubator until the start of the measurement protocols described below.
Singlet oxygen quantum yield, membrane binding, MTT cell viability and photosensitizer subcellular localization. Protocols and results were published before by us (28) and they were used in comparison with the experiments described in this study.
Measurement of photoinduced ROS production. Thirty minutes before irradiation, cells were incubated with DCFHDA (5.0 μmol·L−1). This nonfluorescent probe crosses cell membranes, it is de-esterified to 2′,7′-dichlorodihydrofluorescein (DCFH) and turns to highly fluorescent 2′,7′-dichlorofluorescein (DCF) upon oxidation (30). A variety of ROS, including radicals and singlet oxygen, can oxidize DCFH to DCF (30). Another source of DCF formation can be the indirect oxidation by ROS produced within PDT damaged mitochondria. After irradiation, cells were harvested and put on tubes with PBS. Samples were read in a flow cytometer (Beckman Coulter). Fluorescence was detected in FL-1 filter (λ < 550 nm) and the fluorescence intensities were plotted as columns for comparison.
Quantification of sub-G1 population. Cells were maintained in the incubator for 48 h after the irradiation and then were harvested and washed with binding buffer (10 mmol·L−1 HEPES, 150 mmol·L−1 NaCl, 5 mmol·L−1 KCl, 1 mmol·L−1 MgCl2, 1,8 mmol·L−1 CaCl2). One milliliter of DMEM and 3 mL of ethanol (70% v/v) at −20°C were added to each sample. Tubes were maintained in the freezer for several days. Cells were centrifuged (10 min, 100 g), supernatants were removed and the samples were incubated with 200 μL of ribonuclease-A (200 μg·mL−1) at room temperature. After 1 h, reaction was stopped in an ice bath, samples were centrifuged, supernatant was removed and, finally, cells were suspended in 200 μL of propidium iodide (50 μg·mL−1). Samples were analyzed in a flow cytometer (FACSCalibur-BD) using FL-2 filter (550 nm < λ < 600 nm) (31).
Cell viability by trypan blue exclusion assay after irradiation. Three hours after irradiation cells were stained with trypan blue (10 μL trypan blue solution in 1 mL DMEM without phenol red) (32). We obtained images in a fluorescence microscope Axiovert 200 (Zeiss, Germany), 130× magnification and photographed on a Canon Power Shot G10. Image J Launcher was used for cell counting. Blue-stained cells were considered to have lost their membrane integrity.
Mitochondrial membrane potential loss (PI/Rh). Two hours after irradiation, cells were harvested and stained with rhodamine 123 for 30 min (1 μg·mL−1) at room temperature in the dark. Then, propidium iodide (1 μg·mL−1) was added and samples were incubated for 5 min in the dark. Samples were analyzed by flow cytometry (Beckman Coulter). Rhodamine fluorescence was detected in FL-1 filter (λ < 550 nm) and propidium iodide was detected in FL-3 filter (600 nm < λ < 645 nm) (33,34).
Rhodamine 123 is a dye that concentrates in breathing/coupled mitochondria. Rhodamine 123 accumulation in mitochondria diminishes as these organelles lose their mitochondrial transmembrane potential (MTP). Cells presenting damage in plasma membrane are stained by propidium iodide because this dye binds DNA. The possible combinations of the binding of these two dyes result in: (1) negative PI and positive rhodamine (PI−/Rh+) (cells with integral CM and MTP); (2) negative rhodamine and positive PI (Rh−/PI+) (cells with damaged CM and depleted MTP); and (3) rhodamine and PI negatives (Rh−/PI−) (cells with intact CM and loss of MTP). The percentage of cells in group 3 generated by the different PS + light protocols were plotted in a graph for comparison (33).
Quantification of cytochrome c that remained in mitochondria after PDT. The protocol was started 24 h after irradiation. The methodology used was previously described by Waterhouse and Trapani (35). Briefly, cells were harvested and maintained on ice during 5 min in 100 μL of a “permeabilization solution” (digitonin 50 μg·mL−1 in PBS with 100 mm KCl). Then, cells were fixed in a 4% paraformaldehyde solution (20 min at room temperature), washed three times in PBS and maintained overnight at 4°C in blocking buffer (3% BSA, 0.05% saponin in PBS). The next day, cells were incubated at 4°C for 3 h with 1:200 anticytochrome c monoclonal antibodies (clone 6H2.B4) in blocking buffer, then washed three times with PBS and incubated in 1:200 PE-labeled secondary antibody in blocking buffer for 1 h at room temperature. Samples were analyzed by a flow cytometer (Beckman Coulter) using the FL2 filter (550 nm < λ < 600 nm) for the detection of PE fluorescence.
Fluorescence microscopy: acridine orange and ethidium bromide double staining. After 24 and 45 h, PDT cells were stained with 1:1 acridine orange and ethidium bromide (AO/EB) 1 μg·mL−1 for 10 min following the protocol previously described (36,37). Images were acquired in a fluorescence microscope Axiovert 200 (Zeiss, Germany), 130× magnification and photographed on a Canon Power Shot G10. Living cells were observed as green, necrotic cells as red, early apoptotic cells as green with nucleus exhibiting strong emission because of the chromatin condensation and autophagic cells were seen as green with orange vacuoles (36,37).
Statistical analysis. Statistical analysis was performed by ANOVA method using the software Microcal Origin (version 7.0) and the level of significance was assigned as P ≤ 0.05.
Results and discussion
Photosensitizers P1 to P4 have different efficiencies of cell death (quantified by MTT) (28). For example, cell viability after the treatment with P1 + light is 17 times larger than that observed after performing the same protocol with P4. Note also that there is no correlation between the observed cell viability after PDT and the quantum yield of singlet oxygen generation, measured in isotropic media (Fig. 2A). On the other hand, intracellular photoinduced ROS (measured by DCF fluorescence) and membrane-binding efficiency (measured by centrifugation of suspended large vesicles made of synthetic lipids) (21,28) have clear relationships with the efficiency of cell death. P3 and P4 are more efficient than P1 and P2 in terms of binding to membranes and generating intracellular ROS, both properties being well correlated with the efficiency of photoinduced cell death (Fig. 2B,C). These results suggest that there are no differences in the photochemical mechanisms taking place within this series (all photosensitizers are excellent singlet oxygen generators), i.e. the more ROS is generated inside the cells, the more cells die. It also shows that the length of the alkyl chain determines the final efficiency of cell death.
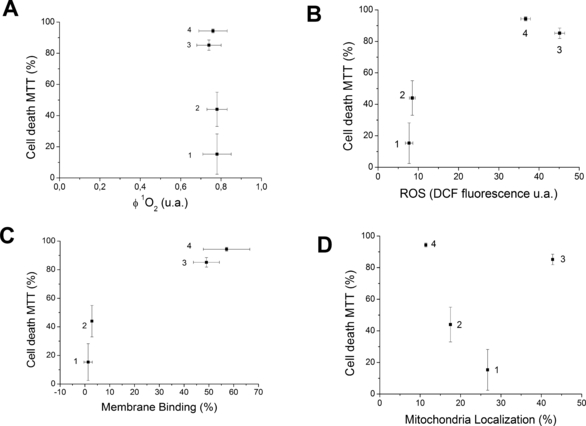
Cell death by MTT versus: singlet oxygen quantum yield production—determined in methanol (A) (28); ROS production estimated by DCF fluorescence (B); membrane binding measured in multilamellar vesicles (C) (28); mitochondria localization measured in HeLa cells (28) (D). PDT treatment: 1-TMePyP—13 μmol·L−1 (P1); 2-ZnTMePyP—19 μmol·L−1 (P2); 3-TC8PyP—14 μmol·L−1 (P3); 4-ZnTC8PyP—6 μmol·L−1 (P4) in DMEM. Irradiation at 650 nm for free-base porphyrins and at 532 nm for the zinc porphyrins (light dose of 175 mJ·cm−2 for both systems).
More intriguing is the profile of subcellular localization. Although none of the photosensitizers showed complete accumulation in a specific organelle (more than 90% accumulation in a specific organelle is a rare event) (6,38), P2 and P4 have lower mitochondrial colocalization (17% and 12%) compared with P1 and P3 (27% and 43%) (Fig. 2D). As reported previously, this effect is due to the zinc chelation, which favors unspecific membrane binding, but disfavors the interaction with mitochondria (28). Additionally, mitochondria localization showed no special relationship with the efficiency of cell death (Fig. 2D). Note that P3 and P4, which are, respectively, the most and least enriched in mitochondria, show similar cell-death efficiencies. In what follows we want to take advantage of this experimental condition, i.e. similar efficiency of cell death (P3–P4 and P1–P2) for photosensitizers that have similar structures and similar intracellular photochemical mechanisms but different subcellular distributions, to understand and quantify the effect of subcellular distribution and zinc chelation in the mechanisms of cell death.
Besides MTT (Fig. 1), which indicates damage in mitochondrial dehydrogenases, we quantified five parameters related to cell death, which are: loss of membrane integrity (trypan blue exclusion assay), DNA fragmentation (quantification of sub-G1 population), loss of mitochondrial membrane potential (PI/Rh assay), release of cytochrome c (cyt c) from mitochondria (immune staining and quantification by FACS) and double cell staining with AO and EB. Our main goal was to obtain quantitative relationships of these properties with the photosensitizer structure and cell localization.
Trypan blue exclusion assay (3 h after irradiation) gives an indication of the rapid damage that the PDT protocol caused in the CM. Observe in Fig. 3A that P3 and P4 induce higher damage in the CM than P1 and P2, which is somewhat expected based on the MTT data (Fig. 1). However, there are also some differences. Note that the free-base porphyrins (P1 and P3) induce stronger CM damage than the zinc-chelated ones (P2 and P4), which is the reverse profile to that observed in the MTT results. It is intriguing that photosensitizers that concentrate more in mitochondria (P1 and P3) induce stronger damage in the CM.
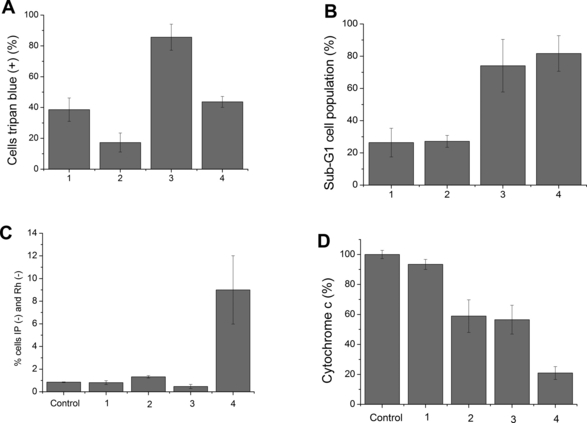
Quantification of cell damage by P1 to P4. Evaluation of the loss of integrity in the plasmatic membrane using trypan blue staining (3 h after irradiation) (A); percentage of sub-G1 cell population measured 48 h after treatment (B); loss of mitochondrial transmembrane potential (C); percentage of cytochrome c that remained in mitochondria after PDT treatment (D). 1. TMePyP—13 μmol·L−1 (P1); 2. ZnTMePyP—19 μmol·L−1 (P2); 3. TC8PyP—14 μmol·L−1 (P3); 4. ZnTC8PyP—6 μmol·L−1 (P4) in DMEM. Irradiation at 650 nm for free-base porphyrins and at 532 nm for the zinc porphyrins (light dose of 175 mJ·cm−2 for both systems).
Cells undergoing apoptosis cleave DNA in small fragments, which are collectively called sub-G1 population. Unfortunately, the quantification of sub-G1 population is not a quantitative test of apoptosis because some DNA fragmentation also occurs in cells undergoing necrosis. However, it is useful for our comparisons within this series of compounds (39). Control cells (cells not exposed to photosensitizers in the dark or with irradiation and cells exposed to photosensitizers in the dark) presented no measurable sub-G1 (data not shown). Porphyrins presenting long alkyl chains (P3/P4) generated larger sub-G1 populations than porphyrins presenting methyl groups (P1/P2) (Fig. 3B). There is a slightly higher sub-G1 population for the zinc compounds, but it is not statistically significant. You may note that P3 (the compound most enriched in mitochondria) and P4 (the least one) generated almost the same sub-G1 cell population, with a slight increase in the case of P4.
Changes in MTP is one of the events that is involved in the release of cyt c from mitochondria and consequently with the initialization/amplification of the apoptotic mechanism of cell death. At the same time, the maintenance of the MTP during an apoptotic mechanism is a necessary condition for apoptosis to reach completion (40). The changes in MTP were evaluated by staining cells with rhodamine 123 (a dye that accumulates in mitochondria in the conditions that this organelle keeps its membrane potential) and propidium iodide (a dye that accumulates in cells with damaged membranes). Control cells were stained with rhodamine, but were not stained by propidium iodide as have integral membranes and mitochondrial membrane potential. Cells incubated with photosensitizers without illumination behaved as controls (data not shown). Cells that lose MTP were defined as those that were neither stained with rhodamine nor with propidium iodide (IP−/Rh−). The percentage of IP−/Rh− cells after incubation with photosensitizers and illumination is plotted in Fig. 3C. Only P4 showed a representative change, although P2 has also induced some mitochondrial membrane potential loss. Interestingly, both P2 and P4 are zinc-chelated porphyrins, indicating that free-base porphyrins P1 and P3, which are more accumulated in mitochondria, do not seem to cause direct damage in this organelle.
Cyt c plays an important role in apoptosis. Its release from mitochondria to cytosol is necessary in order to form the apoptosome (a complex with apoptosis protease-activating factor 1—Apaf-1 and procaspase-9) (41). Cells treated with photosensitizers in the dark did not present significant differences in the level of cyt c release compared with the control (results not presented). As can be observed in Fig. 3D, the percentage of cyt c that remained in mitochondria decreases in the order P1 > P2=P3 > P4. In cells treated with P4 and irradiation, there is three times more cyt c released compared with cells treated with P3 and P2. Again, note that P4, which presented low mitochondrial localization, is the one that caused larger cyt c release. Another interesting observation is that the other zinc-chelated porphyrin (P2), which induces a relatively low level of total kill (2, 3) under this experimental condition, induces as much cyt c release as P3.
The double staining of the cells with AO and EB also gave important hints concerning the cell-death mechanisms. Cells were treated with P3 and P4 illuminated and stained 24 and 45 h after PDT (Fig. 4). Although we can observe some features of each of the known cell-death processes (36,37), the most important difference is the high level of staining with EB (red cells) in cells treated with P3, both 24 and 48 h after PDT. This is another piece of evidence pointing to the concept that free-base porphyrins, which accumulate in mitochondria induce a higher level of necrosis compared with zinc-chelated porphyrins, which do not accumulate in mitochondria.
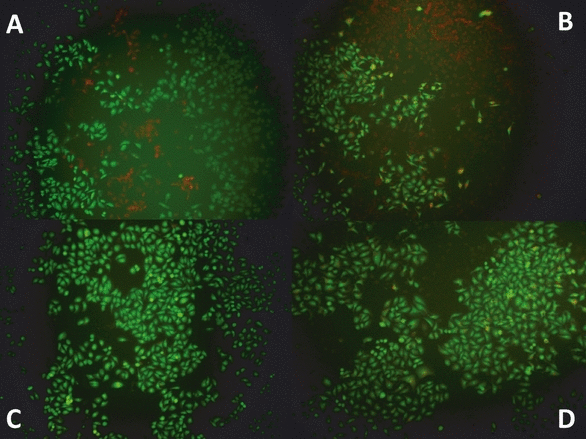
AO/EB double staining. HeLa cells treated with: P3 + light 24 h after irradiation (A); P3 + light 45 h after irradiation (B); P4 + light 24 h after irradiation (C); P4 + light 45 h after irradiation (D). 3. TC8PyP—14 μmol·L−1 (P3); 4. ZnTC8PyP—6 μmol·L−1 (P4) in DMEM. Irradiation at 650 nm for PS3 and at 532 nm for PS4 (light dose of 175 mJ/cm2 for both systems).
In order to better correlate the molecular structure of the photosensitizers with the mechanisms of cell death, specially the effect of zinc chelation, we decided to analyze the cell-death parameters related with mitochondria (viability-MTT, sub-G1 population, MTP loss, cyt c release) at a constant level of CM damage, i.e. all quantified parameters were divided by the level of trypan blue staining (Fig. 5). Note that this parameter is different from the final biological outcome, which is more prominent for the photosensitizers functionalized with longer alkyl chain (Fig. 2). In this analysis, we would like to define which photosensitizers are more efficient at a similar level of damage in the CM. Observe that zinc-chelated porphyrins (P2 and P4), independently of the level of cell death they cause, present a clear discrimination compared with the free-base porphyrins (1 and 3). Although they are less accumulated in mitochondria, they cause a larger damage in the mitochondrial dehydrogenases (Fig. 5A), promote a stronger level sub-G1 DNA population (Fig. 5B), cause a stronger decrease in the MTP (Fig. 5C) and a larger release of cyt c (note that the percentage of cyt c that remained in mitochondria at a constant level of damage in the CM is larger for porphyrin 1 compared with 2 and for porphyrin 3 compared with 4) (Fig. 5D).
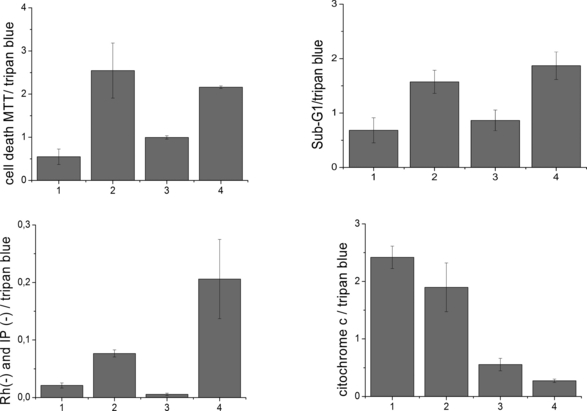
Data from Fig. 3B–D and MTT results (Fig. 2) divided by the level of membrane damage obtained by the trypan blue staining (TBS). MTT cell death/TBS (A); sub-G1 cell population/TBS (B); loss of mitochondrial transmembrane potential/TBS (C); (percentage of cytochrome c that remained in mitochondria after PDT treatment)/TBS (D). PDT treatment: 1. TMePyP—13 μmol·L−1 (P1); 2. ZnTMePyP—19 μmol·L−1 (P2); 3. TC8PyP—14 μmol·L−1 (P3); 4. ZnTC8PyP—6 μmol·L−1 (P4) in DMEM. Irradiation at 650 nm for free-base porphyrins and at 532 nm for the zinc porphyrins (light dose of 175 mJ·cm−2 for both systems).
Our results show that the type II photosensitizers that are chelated with zinc have a lower tendency to accumulate in mitochondria but present higher efficiency in damaging this organelle, leading to a higher percentage of cells engaging in apoptotic cell death. On the other hand, free-base porphyrins, which have higher accumulation in mitochondria, are less efficient in damaging mitochondria and cause a rapid loss of membrane integrity, favoring a necrotic route of cell death. We must raise a word of caution concerning the intracellular localization of the porphyrins. Zinc porphyrins may in fact localize to mitochondria without showing the characteristic colocalization profile with Rodhamine-123 (28), if there is some sort of specific/unknown quenching mechanisms of the zinc porphyrins occurring at this microenvironment.
Although there is a considerable amount of published data indicating that photosensitizers that act in other cell compartments (different than mitochondria) can induce apoptotic response (22,42–44), the lower mitochondrial damage of photosensitizers that are further accumulated in this organelle suggests that there is some sort of deactivation happening inside mitochondria, which decreases the efficiency of nonchelated porphyrin photosensitizers in this environment. This was shown to occur in the case of methylene blue, which can aggregate and get reduced inside mitochondria (6,45).
In the case of the series of compounds investigated in this manuscript, we had hypothesized that the free-base porphyrins have stronger than expected interaction with mitochondria because of a possible chelation with free or partially chelated metals, which are present in mitochondria. Recently, we have observed a strong efficiency of free irons to suppress excited states of free-base porphyrins, even when the porphyrin is entrapped inside silica nanoparticles (46). Therefore, we can hypothesize that a possible reason why the free-base porphyrins, which accumulate more in mitochondria compared with the zinc chelated porphyrins, have a lower efficiency of cell killing and a much lower tendency to damage mitochondria may be the suppression of excited states that possibly occurs in the presence of free or partially chelated ions inside mitochondria. However, we must emphasize that we still do not have a definitive mechanistic proof. There are other possible explanations; for example: free-base porphyrins can be more strongly bound to membrane proteins in mitochondria decreasing the efficiency of type II photosensitization and consequently of singlet oxygen generation inside mitochondria (29); and zinc-chelated porphyrins, which have a higher efficiency of binding to membranes in general, could cause a stronger damage in the mitochondrial membrane. We are currently working on isolated mitochondria to prove which possible molecular mechanisms can explain the effect of zinc chelation on the efficiency of mitochondria damage.
Conclusions
The subcellular localization and the efficiency/mechanism of photoinduced cell death are considerably affected by the chelation of porphyrin photosensitizers with zinc. Zinc-chelated photosensitizers accumulate less in mitochondria and induce higher damage in this organelle compared with free-base photosensitizers. The photodynamic efficiency of free-base porphyrins is somehow affected by the microenvironment found in mitochondria. Our results indicate that chelation with zinc is a good strategy to help the maintenance of the photophysical/photochemical properties of the photosensitizers in the intracellular environment.
Acknowledgments
Acknowledgements— FAPESP, CNPq and CAPES are acknowledged for funding this research.


