Indicator of UV Index Intervals
Abstract
A simple device for indication of intervals of UV index (UVI) values and the level of necessary protection is constructed. The indication is based on the solar elevation angle and total ozone column values. The recommended level of protection is indicated via color-coded (red, yellow, green) intervals on the scale of the device. Comparisons of the indication of the device to the forecast of UVI for 165 days during spring, summer and fall for Belgrade, Serbia showed that for 162 days the indication about application of protective measures was in agreement with the UVI forecast. The indicator is simple, easy to use, straightforward and reliable in determining the interval of UVI values and the level of necessary protection from UV radiation.
Introduction
The UV index (UVI) was introduced to raise public awareness of UV radiation and to promote the protective measures that should be taken (1). UVI is calculated using values for solar zenith angle (sun elevation), ozone, altitude, albedo, aerosols and cloudiness. The most important factor is the sun elevation. Other factors just modify the UVI value determined by the elevation of the sun. UVI can be approximately determined using two of the abovementioned parameters (solar zenith angle and total ozone column) (2). UVI is an integer ranging from 1 to 11 or more, reaching as much as 20 at some locations (3). As different level of protection is not easily applicable for each value of the UVI, the whole range of UVI values is divided into three intervals, which correspond to three levels of protection (4). The three regions can be color coded: low values green, medium values yellow and high values red, which differs from the World Health Organization color coding (4), but is in concordance with the universally accepted practice of this type of color coding. Low values (protection is not required) are from 1 to 4, medium (protection is required) from 4 to 7 and high values (extra protection is required) are above 7 (more than 9 is extreme) (5).
There are instruments that measure UV radiation intensity for scientific purposes (6). There are devices intended for personal use that are not of satisfactory quality (7). The shadow rule from the period before the UVI was instituted suggests more than 45° of sun elevation as an indication for the application of protective measures. The rule is based on UV radiation measurements, but total ozone column values were not considered (8–10).
Many people are not familiar with the UVI, so misinterpretations occur. Even basic facts about UV radiation are misunderstood. In a recent study, 61% of respondents did not appreciate that UVI is independent of temperature and at least 55% do not appreciate that UV conditions peak at solar noon (11).
As there are generally three possible levels of protection from UV radiation, a device that would reliably indicate the recommended level of protection could satisfy the need for an indicator for UV radiation protection in public. This article details the design of a simple device to indicate the interval of UVI values and the level of necessary protection.
Methods
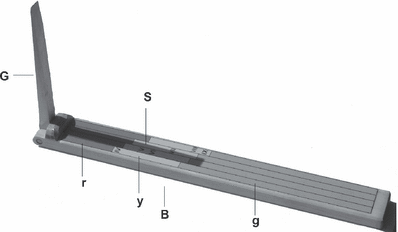
The device is a sort of a sundial or a shadowscope that consists of a gnomon G and a base plate B (Fig. 1). The device should be positioned in such a way that the shadow S of the gnomon G lies along the longitudinal axis of the base plate B, which is horizontal (Fig. 1). On the base plate there are one or several scales made to indicate low (1–4), medium (4–7) and high (more than 7) UVI. The intervals of UVI values on scales are colored green, yellow and red (g, y, r, Fig. 1).

Photograph of indicator of UV index intervals.
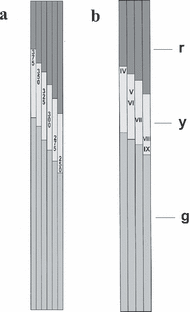
Different labeled scales can be constructed in several ways. One is to construct color-coded intervals on scales for predetermined values of total ozone column in Dobson Units (DU), for example 250, 275, 300, 325, 350 and 375 DU (Fig. 2a) while altitude, albedo of the surface and aerosols are considered to be constant. Other values can also be chosen to best suit regional conditions.

(a) Scales with predetermined values of the total ozone column in Dobson Units. (b) Scales with monthly average values of total ozone column for Serbia.
The other modality is to construct scales for specified periods according to average values for total ozone column in previous years in the area for which the device is best suited. An example of such a scale is given in Fig. 2b for Serbia. The four scales are made for April, May and June, July, August and September (IV, V and VI, VII, VIII and IX, Fig. 2b). Total ozone column values used for scale construction are monthly averages for the period between 1979 and 2003 minus two standard deviations (12).
The scale construction for both scale modalities (Fig. 2) is based on UVI values obtained using the multiple scattering model System for Transfer of Atmospheric Radiation. The scales are valid for mean sea level, clear sky and a 3% albedo of the surface, and aerosol optical depth at 550 nm of 0.2 (13,14).
Indication of UVI interval at solar noon was compared with the UVI forecast issued by Tropospheric Emission Monitoring Internet Service (http://www.temis.nl) for clear sky for solar noon for 3 days (today plus 2 days). The input for the UVI is assimilated global ozone field. Average ozone predictions accuracy is about 9 DU (15,16).
Results
The indication of the UVI interval on the month scale was compared with the UVI forecast. The comparison was made for 165 days during spring, summer and fall in 2007 for Belgrade (latitude 44.85 N, longitude 20.5 E), Serbia. In the period between 15 May and 24 August, when elevation of the sun resulted in indicator readings in the red zone (UVI more than 7), on 15 occasions the forecast of clear sky UVI was less than 7. However, the UVI forecast for those days was between 6.3 and 6.9 (<6.5 on three occasions), so the level of protection indicated by the indicator could hardly be described as excessive.
Between 25 August and 30 September the indicator pointed at the yellow zone at solar noon (UVI between 4 and 7). UVI forecasts were outside this interval on three occasions (7.5, 7.2 and 3.9).
From 1 October until 19 October the instrument indicated the green zone (UVI <4). The forecasts were 4.2 on two occasions.
Out of 165 readings the instrument underestimated UVI forecast on four occasions. Erroneous indications whether to apply protective measures were made three times.
Discussion
The values of UVI interval obtained by the indicator showed very good agreement with the forecast of UVI. The forecast differed from the indicated UVI interval 20 times out of 165 comparisons. Underestimation of UVI is of greater concern for radiation protection. It occurred on four occasions and all of them were when UVI was medium or low. Altitude is a parameter which is taken to be 0 for UVI indicator readings. If the indicator is intended for use at locations with altitude higher than 300 or 400 m appropriate scales could be constructed. The albedo of the surface was 3% for indicator readings and aerosol optical depth at 550 nm was 0.2.
Cloudiness is a factor that is not accounted for in UVI indicator readings and most often for UVI forecasts as well. Clouds modify UVI values profoundly (reduce UVI by 50% or more) only when the sky is completely or almost completely covered by low or medium high clouds (5). Such conditions can be readily recognized by individuals trying to determine the necessary level of protection.
Conclusion
The UVI indicator proved reliable in determining UVI intervals and the level of necessary protection. It is simple, straightforward to use and adaptable. Large errors are avoided because the indication is analogous to sun elevation—the principal factor that determines the intensity of biologically active UV radiation. Its color-coded scales are intuitive and do not require knowledge of the UVI, so it can be used by children.


