Modeling the diet of humpback whales: An approach using stable carbon and nitrogen isotopes in a Bayesian mixing model
Abstract
Humpback whales are considered generalist predators, feeding on schooling fish, and zooplankton, but variability likely exists among regional feeding aggregations. We explored the diet of one feeding aggregation of humpback whales near Kodiak Island, Alaska, through analysis of the stable carbon (δ13C) and nitrogen (δ15N) isotope ratios of their skin and regional prey sources. Humpback whales were sampled during the summer feeding season over 3 yr (n= 93; 2004–2006). Prey samples were collected from the same region during trawl surveys conducted between 2003 and 2005. Isotope values of humpback whale skin and prey were entered into a Bayesian dietary mixing model to estimate feasible contributions of prey to humpback diets. Diet results indicated that humpbacks feed heavily on euphausiids, but also consume juvenile walleye pollock, capelin, and Pacific sand lance. The diet of humpback whales in 2004 was the most diverse, while diets in 2005 and 2006 showed a higher proportion of euphausiids. Our results reveal annual differences in humpback diets from the Kodiak region due to either individual prey preferences or prey availability. Application of a Bayesian mixing model to stable isotope analysis improves description of regional diets and comparison of these diets to resource availability and quality.
The humpback whale (Megaptera novaeangliae) is a marine predator with a life history highlighted by an extensive seasonal migration. In general, these whales spend the winter months in warmer, low-latitude waters where they breed and give birth before migrating to higher latitude waters to forage. Because humpback whales fast during migration and while on breeding grounds, they are exposed to periods of nutritional stress and potential reductions in body condition (Dawbin 1966, Lockyer and Brown 1981, Baraff et al. 1991, Laerm et al. 1997). Thus, food quality and intake need to be optimized on the feeding grounds in order to sustain migration and breeding behavior and, for females, lactation and pregnancy (Read 2001, Craig et al. 2003).
On their feeding grounds in the North Pacific, humpback whales are classified as top-level predators and are known to consume substantial amounts of prey. These whales are considered generalists in their prey selection, feeding seasonally on zooplankton, such as krill (Thysanoessa spp. and Euphausia pacifica), and pelagic schooling fish, including capelin (Mallotus villosus), Pacific herring (Clupea pallasii), and juvenile walleye pollock (Theragra chalcogramma) (Nemoto 1959; Krieger and Wing 1984, 1986). However, past observations and analyses suggest differences in trophic level and prey use among feeding groups (Witteveen 2008, Witteveen et al. 2009). Variation in prey use may result in inconsistent pressures on prey populations and in differences in the body condition of whales between feeding aggregations. Examining diet and, in turn prey removal, by humpback whales therefore contributes valuable information about complex ecosystem linkages and predator–prey dynamics and may provide insight into differences in population parameters of regional feeding groups.
Unfortunately, studying the foraging habits and prey preferences of whales can be very difficult. Identifying cetacean prey preferences with certainty requires analysis of the stomach contents of harvested or beached whales (Thompson 1940, Klumov 1963) or direct observation of prey in the mouths of surface-feeding animals. Fecal samples from free-swimming whales may also provide dietary insights, but their collection is rare. These means of exploring diet composition are uncommon due to logistical difficulties and ethical considerations, and can also bias results.
Fortunately, analyses of stable carbon and nitrogen isotope ratios of animal tissues are a widely used technique for exploring trophic position, diet, and feeding habitats of migratory animals (Hobson 1999). Stable carbon and nitrogen isotope ratios in animal tissue reflect assimilated diet (Deniro and Epstein 1978, 1981; Wada et al. 1987) and are thus often used to explore dietary inputs (e.g., Hawke and Holdaway 2005, Rudnick and Resh 2005). Distinct isotopic signatures of both mixture (predator) and source (prey) can be used in mass balance equations (mixing models) to determine the relative contribution of a variety of prey sources in the predator's diet (Phillips and Gregg 2003, Hall-Aspland et al. 2005, Phillips et al. 2005, Urton and Hobson 2005). While widely used, traditional models have been criticized for their inability to account for variability in model inputs, particularly as the number of inputs increase (Moreno et al. 2010, Parnell et al. 2010). Newer models account for such variability through the use of Bayesian statistics (Moore and Semmens 2008, Parnell et al. 2010). Bayesian mixing models present dietary solutions as true probability distributions while also accounting for variability in both dietary sources and enrichment factors.
In the present study, ratios of stable carbon and nitrogen isotopes were used to examine the foraging ecology of humpback whales of the Kodiak Archipelago, Alaska, which represents one of many feeding aggregations of humpback whales within the North Pacific (Waite et al. 1999; Witteveen et al. 2006, 2008, 2009). A Bayesian dietary mixing model (Stable Isotope Analysis in R [SIAR]; Parnell et al. 2010) was used to predict the composition of potential humpback whale diets using carbon and nitrogen isotope ratios of humpback whale skin and potential local prey sources. The temporal applicability of modeled diets depends upon the turnover rate of assimilated tissues selected for analysis. Tissues that are more metabolically active (i.e., skin or muscle) will have a much faster turnover rate than inert tissues (i.e., baleen or bone) (Tieszen et al. 1983, Hobson and Clark 1992, Macavoy et al. 2006, Podlesak and Mcwilliams 2006). Though never empirically tested, the skin of rorqual whales likely exhibits high metabolic rates and anecdotal evidence has suggested a turnover rate of 7–14 d for humpback whale skin (Todd 1997). Thus, δ13C and δ15N ratios reported for humpback whales in this study may reflect diets of two weeks to one month prior to sampling.
The primary objective of our study was to model potential diet compositions of humpback whales using stable carbon and nitrogen isotope ratios in order to identify targeted prey species and to explore how diets may vary for a defined feeding aggregation. Results from the present study can be used to refine previous estimates of consumption by humpback whales (Witteveen et al. 2006). Furthermore, methodologies used here may be applied to other feeding aggregations of humpback whales and more specific comparisons of regional diets can be made. Following such comparisons, it may be possible to determine how differences in regional diets and prey choice influence humpback whale population parameters. These techniques can also assist in defining regional diets and relative trophic levels so that predation pressure exerted by foraging humpback whale populations may be further explored. Overall, our study shows the utility of a Bayesian mixing model and stable isotope analysis in exploring cetacean diets that are often difficult to study.
Materials and Methods
Study Area and Period
The study area encompassed the waters of the eastern Kodiak Archipelago (Fig. 1). Humpback whale samples were collected from June through August in 2004, 2005, and 2006. Prey samples were collected in May and August of 2003 and 2004 and in August of 2005.
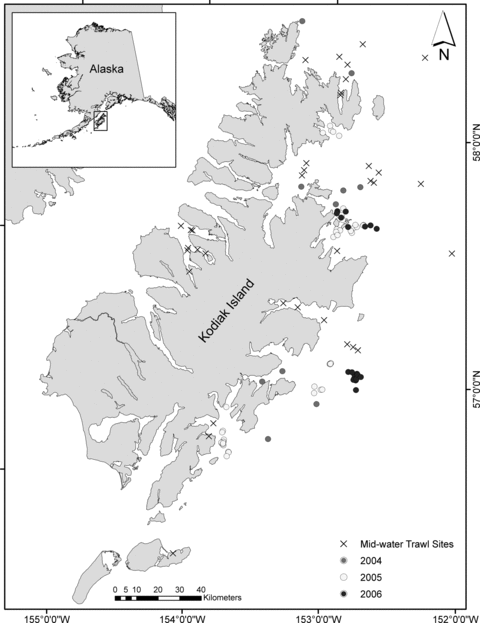
Map of the Kodiak Island Archipelago showing collection locations of humpback whale skin (○) for 2004, 2005, and 2006. Also shown are tow locations of mid-water trawls conducted for prey collection (x).
Sample Collection
Samples for stable isotope analysis were collected from free-ranging humpback whales and preserved as described in Witteveen et al. (2009). Briefly, skin samples were collected using a pneumatic darting system. At each sampling event, the date, location (latitude and longitude), group composition, and general whale behavior were recorded. In addition, identification photographs of tail flukes of sampled animals were collected. Samples were frozen at −80°C until processed for stable isotope analysis.
Fish were collected for stable isotope analysis during mid-water trawl and hydroacoustic surveys conducted within the study area between 2003 and 2005 (Fig. 1). Prey layers showing the highest acoustic backscatter densities were sampled with a commercial mid-water trawl net with a 22 mm mesh cod-end liner and were assumed to represent the available prey resources in the region. Species composition, species counts, and fish size were determined for each tow. Species caught in tows that were considered potential humpback whale prey were schooling fishes measuring less than 30 cm and included capelin, eulachon (Thaleichthys pacificus), juvenile walleye pollock, and Pacific herring (Nemoto 1959). The prey, Pacific sand lance (Ammodytes hexapterus) and euphausiids (Thysanoessa spinifera), were not represented in trawl surveys, likely due to low catchability in the gear used. Both species are abundant forage species in the region and are prevalent in seabird and salmon diets (Boldt and Haldorson 2003, Williams et al. 2009). Therefore, these species are likely prey for humpback whales in the Kodiak region and were considered to be part of the diet for this study. Isotopic data for euphausiids and Pacific sand lance were used from samples originally collected closer to shore for a separate stable isotope study (Williams et al. 2008). Given the movement of Pacific sand lance and euphausiids in the study region, it was assumed that these near-shore samples would also be representative of these species available to humpback whales samples in this study.
Sample Preparation and Stable Isotope Analysis
Samples were prepared for stable isotope analysis through a multistep process that included oven drying, extraction of lipids, and homogenization (Witteveen et al. 2009). Samples were analyzed for stable carbon and nitrogen isotope ratios using a Finnigan MAT Delta Plus XL isotope ratio mass spectrometer at the University of Georgia Institute of Ecology Stable Isotope Laboratory.

Statistical Analysis
Stable isotope ratios for humpback whales and for trawl caught prey species were tested for normality. Ratios for humpback whales were normally distributed for both δ13C (Shapiro–Wilk W= 0.98, P= 0.36) and δ15N (W= 0.99, P= 0.95). Test results for prey species were mixed and thus were treated as nonnormal. Based on tests for normality, one-way analysis of variance (ANOVA) was used to explore relationships between humpback whale stable isotope ratios by year followed by Tukey's Honestly Significant Difference (HSD) test for post hoc comparisons, while variations in prey stable isotopes ratios were tested using Kruskal–Wallis nonparametric tests.
An initial ANOVA explored for differences in the mean stable isotope ratios of humpback whales with sex and year of sample collection as factors. Sex was known for a subset of sampled whales (n= 31; 21 females, 10 males). Sex was determined based on genetic analysis and field observations. Sexes did not differ significantly for δ13C (F1,29= 1.0, P= 0.08) or δ15N (F1,30= 0.2, P= 0.43). Therefore, samples of known and unknown sex were pooled for the remainder of the analyses and sex was removed as a variable in subsequent analyses.
Linear regressions were performed to determine if the stable isotope ratios of humpback whale prey varied as a result of length (cm) by species. If results of regressions were significant, species were grouped into size classes based on regional age-at-length data. Euphausiids and Pacific sand lance were not included in the regression analysis, since their values were obtained through another source.
All statistics were conducted within PASW 18 for Windows (SPSS Inc., New York, NY) and JMP 8.0 (SAS Institute, Cary, NC) with a critical value of α= 0.05 for all analyses. Stable isotope ratios are presented as means ± standard deviation (SD).
Diet Modeling
Relative contributions of potential prey were determined using the Bayesian stable isotope mixing model, SIAR, which isotopic values of predator and prey and trophic enrichment factors (Δ) used as model inputs (Parnell et al. 2008, 2010). Previous mixing models have been limited by a number of issues, including limiting sources to the number of isotopes plus one and an inability to account for variability in input parameters. The Bayesian approach in SIAR circumvents these limitations by allowing for multiple dietary sources as well as associated uncertainties in both isotopic values and Δ (Parnell et al. 2010). As such, Bayesian mixing models are more robust in their result than other modeling approaches, generating potential dietary compositions as true probability distributions (Inger and Bearhop 2008, Moore and Semmens 2008, Parnell et al. 2008, Drago et al. 2010, Parnell et al. 2010).
Stable isotope ratios were entered for each individual whale, while prey values were entered as means with SDs for each prey species or group. SIAR also allows users to supply SDs for trophic enrichment factors as another means of accounting for variability. To date, there are few published estimates of enrichment factors of carbon and nitrogen for marine mammals and no published results for humpback whales. However, Hobson et al. (1996) reported factors of ∼1.3‰ for Δδ13C and ∼2.4‰ for Δδ15N for muscle tissue of captive harbor seals (Phoca vitulina), which have subsequently been used as factors in other marine mammal dietary and trophic level estimation studies (Das et al. 2004, Hammill et al. 2005, Herman et al. 2005). Other published enrichment factors for marine mammals range from 0.4 to 1.0 for Δδ13C and from 3.0 to 3.8 for Δδ15N (Todd 1997, Hobson et al. 2002, Hoekstra et al. 2002, Post 2002). Enrichment factors for this study were calculated as the mean of published values and were 0.9 and 3.2 were for δ13C and δ15N, respectively. The published values were used to calculate SD for enrichment factor input into SIAR models (0.46‰ for carbon and 0.60‰ for nitrogen, respectively). Potential diets of humpback whales were estimated for all years combined and by individual years (Model 1). Prey showing the smallest contributions in Model 1 results were then removed and the model was repeated with all other parameters remaining the same (Model 2). Results are presented as 95% credibility intervals (Bayesian confidence interval).
Results
Sampling Results
Between 2004 and 2006, 93 samples were collected from humpback whales within the study area. Sample sizes for each of the three years beginning in 2004 were 29, 42, and 22 (Table 1, Fig. 1). Sampling effort (number of days) was relatively even across years and the increase in sample size in 2005 was due primarily to an increase in the number of animals within the study area.
| n | Effort (d) | δ13C | δ15N | |
|---|---|---|---|---|
| 2004 | 29 | 24 | −17.3 ± 0.47 | 13.5 ± 0.55 |
| 2005 | 42 | 18 | −18.0 ± 0.43 | 13.4 ± 1.06 |
| 2006 | 22 | 15 | −18.2 ± 0.46 | 13.0 ± 0.68 |
| All | 93 | 57 | −17.9 ± 0.57 | 13.3 ± 0.86 |
A total of 116 samples from four fish species were collected for stable isotope analysis as humpback whale prey within the study area between 2003 and 2005 (Fig. 1). Most samples were of capelin (n= 51), followed by eulachon (n= 39), Pacific herring (n= 15) and juvenile walleye pollock (n= 11).
Stable Isotope Analysis
The mean value of δ13C for humpback whale skin was −17.9‰± 0.57 for all years combined and ranged from −17.3‰± 0.47 in 2004 to −18.2‰± 0.46 for 2006 (Table 1). The mean value of δ15N was 13.4‰± 0.86 for all years combined with a maximum mean value of 13.5‰± 0.55 in 2004 and a minimum of 13.0‰± 0.68 in 2006 (Table 1). These values are comparable to other values found for humpback whales (Todd et al. 1997, Gendron et al. 2001). Mean values of δ13C in humpback whale skin differed significantly among years (ANOVA, F2,90= 28.8, P < 0.001). Tukey's post hoc tests showed that δ13C values were significantly more enriched in 2004 than in 2005 and 2006 (Fig. 2). Mean values of δ15N declined across years, but differences were not significant (F2,90= 2.6, P= 0.08; Fig. 2).

Mean values (±SD) of δ13C and δ15N for Kodiak Island humpback whale skin for each of 3 yr and for all years combined. Letter groupings indicate years in which mean δ13C values were not significantly different.
Mean values of δ13C of humpback whale prey species varied from a high of −17.5‰ (±0.88) for eulachon to a low of −19.7‰ (±0.12) for adult euphausiids. Euphausiids also had the lowest mean value for δ15N (10.7‰± 0.27), while herring had the highest (13.5‰± 0.61).
Regression analysis showed that δ13C and δ15N significantly varied by total body length for capelin (r2= 0.20, P= 0.04), eulachon (r2= 0.48, P < 0.001), and pollock (r2= 0.93, P < 0.001), but not herring (r2= 0.36, P= 0.07). However, due to the small sample sizes for herring and pollock, we performed a power analysis to determine if our sample sizes were large enough to support regression results. Results showed that sample size for pollock (n= 11) exceeded the minimum sample size of 5, while the herring sample size (n= 15) was short of the necessary sample size of 21. Therefore, δ13C and δ15N may vary with body length for herring, but our sample size of 11 was not large enough to detect it. T-tests showed that neither slope from the herring regression analysis was significantly different than zero (t0.05,13= 2.16, P= 0.21 for δ13C and P= 0.07 for δ15N). Based on these results, capelin, eulachon, and pollock, but not herring, were divided into age classes based on regional age-at-length data. Capelin were divided into age-1 (<6 cm) and >age-1 (6–12 cm). Eulachon were separated as <age-3 (<10 cm) and ≥age-3 (≥10 cm). These classes were based on length-frequencies of fish caught during this study. Pollock less than 10 cm were classified as age-0, while those between 10 and 22 cm were classified as age-1 (Table 2, Fig. 3).1 Mean stable isotope ratios were calculated for these prey classes (Table 2). Mean values of δ13C were significantly different between prey (H6= 65.9, P < 0.001). Homogeneous subsets revealed age-1 capelin was significantly different than all others, with the remaining prey groups distributed among three additional subsets (Fig. 4). Mean values of δ15N were also significantly different (H6= 90.5, P < 0.001). Prey groups separated into four homogeneous subsets, with >age-1 capelin representing the only prey to be significantly different than all others (Fig. 4).
| Species | n | Class | Size range (cm) | δ13C | δ15N |
|---|---|---|---|---|---|
| Euphausiids | 12 | All | n/a | −19.7 ± 0.12 | 10.7 ± 0.27 |
| Pacific sand lance | 14 | All | <6 | −18.4 ± 0.58 | 11.5 ± 0.71 |
| Capelin | 9 | Age-1 | ≤6 | −19.8 ± 0.92 | 11.3 ± 0.45 |
| Capelin | 42 | >Age-1 | 6–12 | −18.4 ± 0.52 | 11.6 ± 0.40 |
| Eulachon | 10 | <Age-3 | <10 | −16.7 ± 0.26 | 13.2 ± 0.27 |
| Eulachon | 29 | ≥Age-3 | ≥10 | −17.8 ± 0.80 | 13.5 ± 0.56 |
| Herring | 15 | All | 14–30 | −17.6 ± 0.48 | 13.5 ± 0.61 |
| Pollock | 6 | Age-0 | <10 | −18.2 ± 0.09 | 11.3 ± 0.31 |
| Pollock | 5 | Age-1 | 10–22 | −17.0 ± 0.39 | 12.9 ± 0.23 |

Length (cm) frequencies of capelin, eulachon, and walleye pollock collected during mid-water trawl surveys near Kodiak Island, Alaska. Vertical black lines represent separation of size classes (see Table 2).
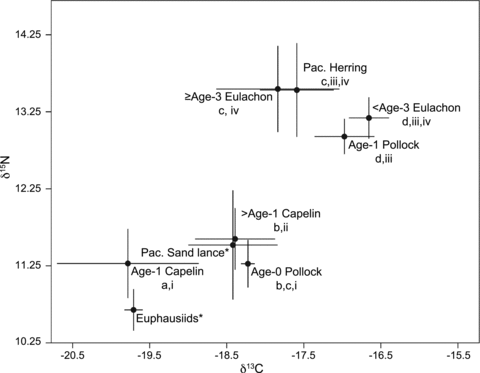
Mean values of δ13C and δ15N for potential Kodiak Island humpback whale prey. Samples were collected during mid-water trawl surveys. Letters indicate groupings for years in which mean δ13C values were not significantly different, while Roman numerals indicate years in which mean δ15N values were not significantly different as shown by post hoc tests. Species with an asterisk (*) are from Williams (2008) and were not included in variance testing.
Diet Modeling
Stable carbon and nitrogen isotope ratios of Kodiak Island humpback whales and potential prey were used in two SIAR Bayesian mixing models (Models 1 and 2) to model possible contributions of each prey group to the humpback whale diet for all samples combined and then each year separately (Fig. 5).
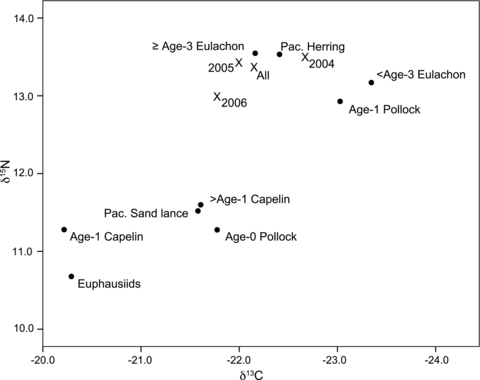
Values of δ13C and δ15N of humpback whale skin (x) and potential prey (•) used as input in the SIAR Bayesian mixing model.
When all humpback whale samples were combined, euphausiids and age-0 pollock were shown to be the predominant prey sources (mean: 39%, 95% credibility interval: 26%–51% and 36%, 17%–54%, respectively). However, other fish groups, such as age-1 capelin (4%, 0%–12%), Pacific sand lance (8%, 0%–22%), and >age-1 capelin (7%, 0%–21%) also made substantial contributions (Fig. 6). The remaining fish species had very small contribution ranges (means: 1%–2%). This general pattern held temporally, although there was some difference between years. The importance of euphausiids was greater in 2005 (38%, 16%–57%) and 2006 (40%, 16%–64%), than in 2004 (14%, 0%–27%). Small forage fish, such as age-0 pollock (25%, 1%–50%), Pacific sand lance (15%, 0%–32%), and >age-1 capelin (14%, 0%–30%), made larger contributions in 2004 than in other years (Fig. 6B–D). As a result, humpback whales in 2004 had more diversity in their diet (Fig. 6B). Prey contributions were similar in 2005 and 2006 (Fig. 6C–D). In no year were feasible contributions of age-1 pollock, Pacific herring, or eulachon significant (Fig. 6). As a result of their minor contributions, these fish were all removed as potential prey sources and the model was repeated with the remaining prey types only.
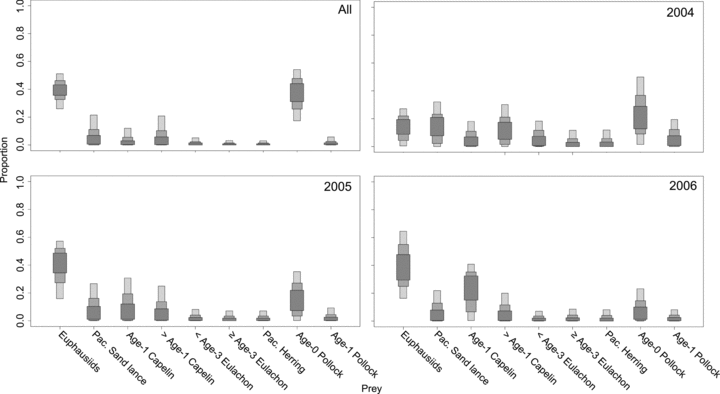
Results of SIAR Bayesian mixing models for Model 1 showing estimates (50%, 75%, and 95% credibility intervals) of diet compositions for humpback whales in all sampling years combined (A) and for 2004 (B), 2005 (C), and 2006 (D).
Reduction in the number of prey sources resulted in only small changes from Model 1. The most significant change was a reduction in the importance of euphausiids and an increase in age-0 pollock (Fig. 7A). Changes between the two models in feasible ranges of the other prey items were not consistent between years. For example, modeled ranges for >age-1 capelin decreased slightly for 2004 (from 14%, 0%–30% to 14%, 0%–38%) but increased for 2005 (from 10%, 0%–25% to 14%, 0%–30%) and 2006 (from 8%, 0%–20% to 12%, 0%–30%) (Fig. 7B–7 f7_legend_span">D).
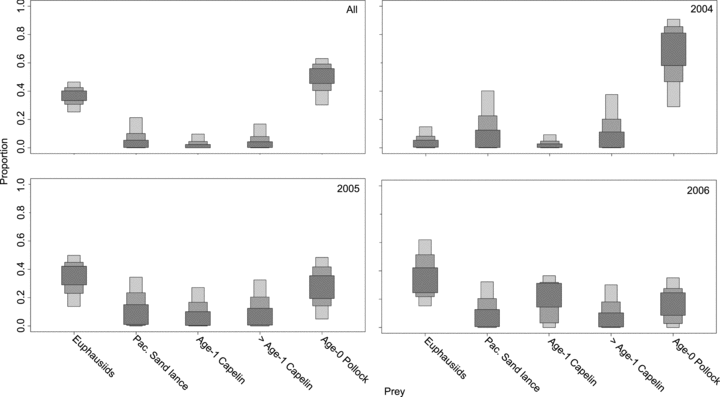
Results of SIAR Bayesian mixing models for Model 2 showing estimates (50%, 75%, and 95% credibility intervals) of diet compositions for humpback whales in all sampling years combined (A) and for 2004 (B), 2005 (C), and 2006 (D).
Discussion
Humpback whales have been called “fast maneuverers” as a result of their preference for fast-moving, schooling fish species (Woodward et al. 2006), though they are often labeled as generalists in their prey selection. Feasible diet compositions modeled by SIAR in this study support these assumptions, though they do suggest a higher reliance on euphausiids around the Kodiak Archipelago than the available fish species, such as capelin and juvenile pollock. Previous assessments of humpback whale diets have estimated that euphausiids comprise between 5% and 30% of the total diet (Perez and Mcalister 1993, Kenney et al. 1997), model results here are in general agreement with those values. Model results also suggest annual differences in prey choice (6, 7).
The range of potential diet contributions of fish species generated by the models supports previous studies of humpback whale foraging in the Kodiak area. Witteveen et al. (2006) estimated the removal of pollock, capelin, eulachon, sand lance, and herring by the regional population of humpback whales based on the assumption that consumption was proportional to the relative availability of these species. Stable isotope analysis supports this assumption for herring and eulachon, which represented some of the lowest proportional contributions in both the present and former studies (Witteveen et al. 2006). Herring and eulachon rarely represent the most available humpback whale prey resource due to their seasonal and spatial distribution around Kodiak Island.2 The distribution of herring is patchy and often isolated in bays on the west side of Kodiak, while eulachon are found at depths deeper than humpback whales tend to dive (Witteveen et al. 2008). Thus, the decision to repeat the SIAR model without these species may have resulted in a more accurate representation of the distribution of feasible solutions among the remaining prey species.
Some SIAR results may be confounded by the fact that the stable isotope ratios of some forage fish were not statistically different from one another. This may be particularly troubling for age-0 pollock and all capelin, since they often occupy a similar size range and are known to frequently cooccur. Overlap in the stable isotope ratios of some prey sources may account for discrepancy between SIAR model results and previous findings in Witteveen et al. (2008). This study showed an apparent preference for capelin over pollock when the availability of both species overlapped temporally and spatially. However, the ability of the SIAR models to incorporate SDs of source values reduces the impact of some of this uncertainty and, overall, results do indicate that both juvenile pollock and capelin be considered top prey sources for foraging humpback whales.
The relatively high contribution of sand lance does not agree with the previous diet study (Witteveen et al. 2006). It should be noted that the previous study relied exclusively on prey survey data and sand lance were not targeted by the acoustic equipment or mid-water trawl nets. Incorporating stable isotope analysis with traditional prey survey methodology may help to reduce the inadvertent exclusion of certain prey resources caused by sampling bias.
Model results suggest annual variation in the overall composition of humpback whale diets, perhaps a function of the fluctuation in the availability of preferred prey. The most consistent trend was an increase in the range of the feasible contribution made by euphausiids among years. With the increase in euphausiids came a decrease in the feasible contributions of forage fish. Although not statistically significant, mean δ15N decreased across years, indicating humpback whales may have been feeding at a lower trophic level (Table 1, Fig. 2). Foraging at a lower trophic level would logically correspond to an increase in the contribution of euphausiids to the diet, since they represent a lower trophic level when compared to most forage fish species. Evaluating regional prey abundance concurrently with stable isotope analysis of humpback whales and surveyed prey would help to determine if there is a relationship between availability and consumption. The high proportion of euphausiids in the 2006 diets, in particular, may have resulted from the fact that over half of the 2006 samples were collected in an area where humpback whales were observed feeding in lateral echelon formation, a behavior often associated with high concentrations of zooplankton (Jurasz and Jurasz 1979). As such, modeled diets may also reflect regional differences in prey selection, choice, or distribution and not simply annual variation.
Annual differences in diet results should be treated with some caution; however, as the years of prey collection (2003–2005) did not correspond directly with humpback whale sampling (2004–2006). The isotopic values of primary producers can vary on a seasonal or annual basis and can result in variation up the food chain (Hobson and Welch 1992, Hoekstra et al. 2002). Future concurrent humpback whale and prey sampling will help to elucidate the effects of the temporal differences.
Dietary information modeled in this study provided new insights into the potential composition of humpback whale diets. The application of stable isotope analysis in this manner will be further enhanced when combined with other methods of exploring cetacean foraging ecology, such as tagging and prey surveys. Developing diet models for other feeding groups of humpback whales will permit specific comparison of regional diets. The ability to describe and compare these diets with improved accuracy in terms of resource quality may be critical in determining the relative survival and reproductive success of distinct foraging populations. Stable isotope analysis proved to be a valuable and relatively simple means of investigating the feeding habits and prey preferences of free-ranging cetacean species and should be implemented in foraging studies when practical.
Footnotes
Acknowledgments
The authors wish to thank A. Fiske, J. Thomson, and C. Clark for their assistance in the field and in the laboratory. We also thank the crews of the F/V Alaska and the F/V Laura for collection of prey samples. M. B. Foster, J. Roth, D. Jenkins, A. Hirons, and C. Williams for providing data, technical advice, or manuscript suggestions. SI analysis was done by T. Maddox at the University of Georgia, Institute of Ecology. We are grateful to the reviewers of this manuscript, whose comments and suggestions greatly improved this manuscript. Humpback whale research was conducted under federal research permit #1049–1718 and University of Alaska Fairbanks IACUC #08–25. Support for stable isotope analysis was provided by NOAA grant #NA16FX1270 awarded to the University of Alaska Fairbanks. Additional funding was provided by the University of Central Florida (UCF) Board of Trustee's Doctoral Fellowship to B.H.W and a Research Enhancement Award from the Office of the Provost, UCF to G.A.J.W.


