Quantitative Analysis of RNA-mediated Protein–Protein Interactions in Living Cells by FRET
Abstract
Specific assembly of ribonucleoprotein complexes is essential in controlling various cellular functions including gene regulation. Diverse scaffolds containing proteins or nucleic acids could play key roles in stabilizing specific ribonucleoprotein complexes by enhancing protein–protein or RNA–protein interactions. One such example is the assembly of active RNA polymerase II transcription elongation complex originating from HIV-1 long terminal repeat promoter that involves HIV-1-encoded Tat protein and viral mRNA structure, trans-activation responsive RNA, and human CyclinT1 which is a subunit of the positive transcription elongation factor complex b. By using genetically encoded fluorescent proteins fused with Tat and human CyclinT1, here we demonstrate that human CyclinT1 was diffused throughout the nucleus and specific interactions between Tat and human CyclinT1 altered the localization of human CyclinT1 to specific nuclear foci. We also found that trans-activation responsive RNA enhanced protein–protein interactions between human CyclinT1 and Tat in living cells. Our results highlights the importance of trans-activation responsive RNA as a scaffold for stable and high affinity assembly of two protein partners to form a regulatory switch essential in HIV-1 gene regulation. RNA-mediated assembly of ribonucleoprotein complexes could be a general mechanism for stable ribonucleoprotein complex formation and a key step in regulating other cellular processes and viral replication. Furthermore, our results suggest that Tat interactions with human CyclinT1 change the nuclear location of positive transcription elongation factor complex b to modulate positive transcription elongation factor complex b function and transcription of cellular genes.
Recent advances in the genetically encoded fluorescent proteins technology have created new opportunities to investigate protein–protein interactions and to monitor mechanotransduction in live cells with these fluorescent probes (1,2). To carry out specific functions, protein–protein interactions are often enhanced or stabilized by various scaffolds, such as nucleic acids or proteins, to create large macromolecular assemblies in the cell. One such example is the assembly of a competent RNA polymerase II transcription elongation complex originating from the HIV-1 long terminal repeat (LTR) promoter (3). HIV-1 encodes a small regulatory protein, Tat, which is required for efficient transcription of viral genes. Tat enhances the processivity of RNA pol II elongation complexes that initiate transcription in the HIV (LTR) region. During elongation, Tat binds to a highly structured RNA element, trans-activation responsive (TAR) RNA, which is located at the 5′-end of nascent viral transcripts (4). Through these interactions with TAR RNA, Tat controls an early transcription elongation step that is sensitive to protein kinase inhibitors and requires the carboxyl-terminal domain (CTD) of the large subunit of RNA pol II (5). The HIV-1 transcriptional activation mechanism requires Tat interactions with the human Cyclin T1 (hCycT1) subunit of positive transcription elongation factor complex b (P-TEFb) that recruits the kinase complex to the pol II elongation machinery (5). P-TEFb is a key enzyme in the control of transcription elongation by RNA polymerase II in the cell (6). Recruitment of P-TEFb to TAR RNA is proposed to be both necessary and sufficient to activate transcription elongation from the HIV-1 LTR promoter (3). By employing fluorescent protein technology, here we have investigated the interactions between Tat and hCycT1 and have analyzed the effect of TAR RNA on the assembly of Tat-CycT1-TAR ternary complex in living cells.
Results and Discussion
To explore the interactions of Tat with hCycT1 in living cells by FRET, we constructed fluorescent fusions of the two proteins with either the red fluorescent protein (RFP) or the enhanced green fluorescent protein (EGFP). To ascertain that fusion of the fluorescent proteins did not interfere with the transcriptional functions of Tat or hCycT1, we studied HIV-1 LTR transactivation in HL3T1 and CHO-K1 cell lines by chloramphenicol acetyltransferase (CAT) reporter gene analysis (Figure 1). CAT enzymatic experiments showed that Tat-RFP was biologically functional and was able to transactivation and enhance CAT gene expression >25-fold in HL3T1 cells, a HeLa cell line derivative containing an integrated HIV-1 LTR promoter and a CAT reporter gene (Figure 1A). Tat-RFP expression levels were analyzed by immunoblotting demonstrating that Tat-RFP was efficiently expressed in HL3T1 cells (Figure 1B).
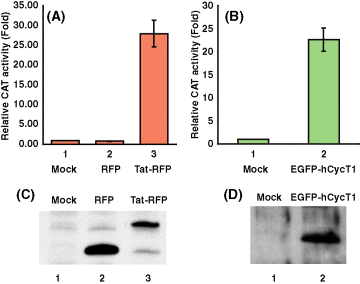
Functional analysis of Tat-RFP and EGFP-hCycT1 fluorescent fusion proteins in mammalian cells. (A) CAT activity expressed from the integrated HIV-1 long terminal repeats (LTR) of HL3T1 cells with DsRed1-N1 (RFP empty vector, lane 2) or Tat-RFP plasmid (lane 3) transfection. Enzymatic activity assays were performed and normalized as described in Materials and Methods. (B) Expression of Tat-RFP in HL3T1 cells as determined by immunoblotting using anti-RFP antibodies. Lane 1, cell lysates without plasmid transfection. Lanes 2 and 3, lysates of cells transfected with DsRed1-N1 (RFP) and Tat-RFP vectors, respectively. (C) CAT activity expressed from the transiently transfected HIV-1 LTR-CAT in CHO-K1 cells with Tat-RFP plasmid single transfection (lane 1) or with Tat-RFP and EGFP-hCycT1 plasmids co-transfection (lane 2). (D) Expression of EGFP-hCycT1 in CHO-K1 cells as determined by immunoblotting using anti-hCycT1 antibodies. Lane 1, cell lysates without transfection; lane 2, lysates of cells transfected with EGFP-hCycT1.
To analyze biologic activities of hCycT1-EGFP constructs, we established the functional assay in CHO-K1 cells that lack hCycT1 and activation of HIV-1 gene expression would require transfection of hCycT1 vectors in addition to Tat and LTR-CAT. The reason is as following, Chinese hamster cell line harboring endogenous CyclinT1 gene lacks a critical cysteine residue required for high affinity Tat interaction and Tat-mediated transactivation (3). We transfected CHO-K1 cells with HIV LTR-CAT, Tat-RFP, and hCycT1 vectors and quantified CAT enzymatic activities (see Materials and Methods). By co-transfection HIV LTR-CAT, Tat-RFP with EGFP-hCycT1, the CAT gene expression was enhanced to 25-fold (Figure 1C). These results show that the EGFP-hCycT1 clone is functional in mediating Tat transactivation (Figure 1C). EGFP-hCycT1 expression levels were analyzed by immunoblotting demonstrating that EGFP-hCycT1 was efficiently expressed in CHO-K1 cells (Figure 1D).
We next determined the effect of Tat on localization of hCycT1 in the nucleus of human cells. GFP-CycT1 was diffused throughout the nucleus in HL3T1 cells (Figure 2A). When we transfected HL3T1 cells with Tat-RFP and EGFP-CycT1, we observed a dramatic change in hCycT1 localization in the nucleus and most of the hCycT1 was co-localized with Tat in distinct foci (Figure 2B, top panel). To determine the effect of HIV-1 LTR on hCycT1-Tat interactions, we analyzed EGFP-CycT1 and Tat-RFP localization in HeLa cells. We obtained similar hCycT1-Tat co-localization results in both HeLa and HL3T1 cells (Figure 2B, top and middle panels) indicating that the presence of integrated HIV-LTR did not significantly altered Tat-CycT1 localization pattern in the nucleus. The change in hCycT1 localization required specific Tat-hCycT1 interactions because expression of a mutant Tat(C22G)-RFP, which does not interact with hCycT1, did not co-localize with hCycT1 (Figure 2B, lower panel). Together, these results establish that Tat specifically interacts with hCycT1 in the nucleus and alters the localization of hCycT1 at specific foci. Furthermore, these results suggest that specific Tat interactions with hCycT1 change the nuclear location of P-TEFb to modulate P-TEFb function and transcription of cellular genes.
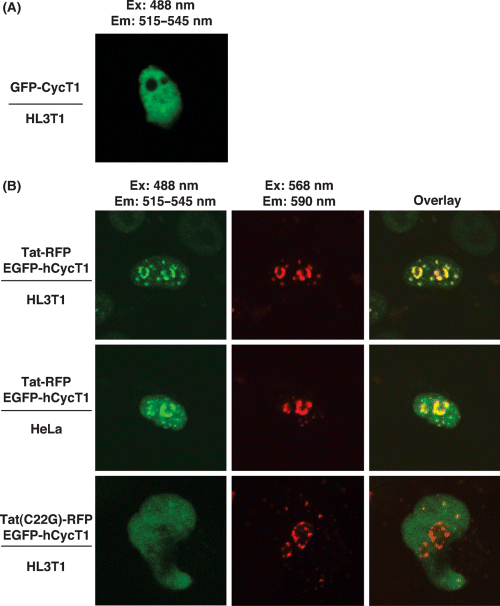
Specific Tat-hCycT1 interactions alter the nuclear localization of hCycT1. HeLa or HL3T1 cells were transfected with plasmids harboring either wild type Tat-RFP or mutant Tat(C22G)-RFP and EGFP-hCycT1 sequences. Fluorescence in living cells was visualized 48-h post-transfection by fluorescence confocal microscopy (Zeiss 410). EGFP-hCycT1 fluorescence was detected by exciting at 488 nm and recording by filter set from 515 to 545 nm. Tat-RFP fluorescence was detected by exciting at 568 nm and recording by filter set from 590 nm. (A) EGFP-hCycT1 is diffused throughout the nucleus in HL3T1 cells. (B) Localization of EGFP-hCycT1 and wild type Tat-RFP in HL3T1 (top panel) or HeLa (middle panel) cells. Localization of mutant Tat(C22G)-RFP with EGF-hCycT1 in HL3T1 cells is shown for comparison (lower panel).
To study the interaction between Tat-RFP and EGFP-hCycT1 in vivo, we designed fluorescence resonance energy transfer (FRET) experiments to determine the dissociation constant of Tat and hCycT1 complex. In this study, EGFP (donor) was fused to hCycT1 (EGFP-hCycT1) and RFP (acceptor) was fused with Tat(Tat-RFP). The EGFP and RFP pairs have excitation and emission properties favorable for FRET, as the emission wavelength of EGFP partially overlaps with the excitation wavelength of RFP. FRET would only be observed when Tat associated with hCycT1 (Figure 3A). In Figure 3B, EGFP-hCycT1 emission spectra of CHO-K1 cells transfected with fixed concentration of pEGFP-hCycT1 (donor in FRET) and various concentrations of Tat-RFP (acceptor in FRET) were recorded at 48-h post-transfection. The emission spectral peak at 507 nm represents the fluorescence intensity of EGFP-hCycT1. The FRET efficiency was determined by the quenching of the fluorescence intensity of EGFP-hCycT1 in the presence of Tat-RFP (Figure 3B). Expression levels of Tat-RFP and EGFP-hCycT1 in CHO-K1 cells were determined by immunoblotting using RFP and hCycT1 antibodies. As expression level of EGFP-hCycT1 keeps constant as concentration of Tat plasmid increased (Figure 3C), thus the decrease of EGFP-hCycT1 fluorescence intensity is not because of the lower transfection efficiency or protein expression level, but is a result of FRET between EGFP-hCycT1 and Tat-RFP (Figure 3C). Protein concentrations were determined by quantitative immunoblotting as described earlier (7) and in Materials and Methods. We were able to detect as little as 3 fmol of purified protein. This accuracy and sensitivity of detection limits allowed us to quantify Tat and hCycT1 present at very low levels and the processing of many samples rapidly and in parallel (see Materials and Methods for details). We did not detect the acceptor increase signal in FRET because of the spectral overlap between donor and acceptor absorption. The lower intensity of RFP signal at 583 nm could be due to two reasons: (i) the concentration of RFP is at least fivefold less than EGFP; (ii) the detector of fluorometer responses to red is much weaker than the green color. As we focus on the reduction of EGFP intensity, we did not use corrected fluorescence spectra in Figure 2B.
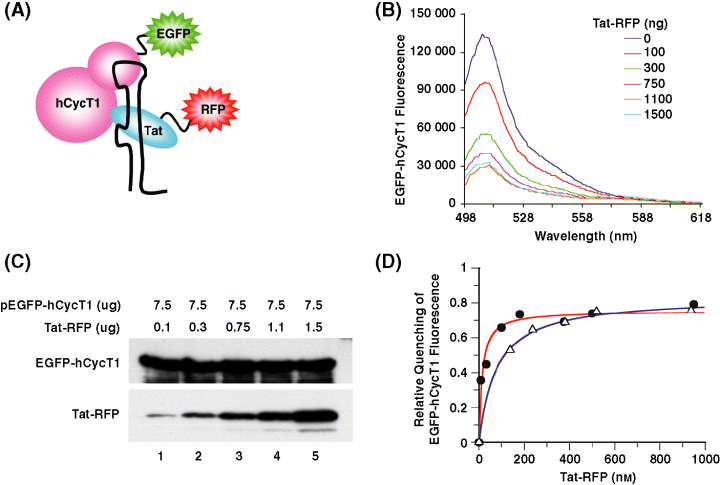
In vivo analysis of the interactions between Tat-RFP and EGFP-hCycT1 measured by FRET. (A) Schematic representation of the protein–protein interactions mediated by RNA. (B) EGFP-hCycT1 emission spectra in CHO-K1 cells transfected with fixed concentration of pEGFP-hCycT1 (donor) and various concentrations of Tat-RFP (acceptor). At 48-h post-transfection, suspension cultures were prepared and subjected to spectrophotometer measurement. The emission spectral peak at 507 nm represents the fluorescence intensity of EGFP-hCycT1. The FRET efficiency was determined by the quenching of the fluorescence intensity of EGFP-hCycT1 in the presence of Tat-RFP. (C) Expression levels of Tat-RFP and EGFP-hCycT1 in CHO-K1 cells as determined by immunoblotting using RFP and hCycT1 antibodies, respectively. (D) Quantitative analysis of the interactions between Tat-RFP and EGFP-hCycT1 measured by FRET in the absence (blue line and open triangles) and presence of HIV-1 TAR RNA (red line and solid circles). Relative EGFP-hCycT1 fluorescence quenching is plotted as a function of total Tat-RFP concentrations measured by quantitative Western blotting analysis (see Materials and Methods). The solid lines represent the best fit of the data by nonlinear regression to quadratic equation. The dissociation constant of 75 ± 9 and 13 ± 3 nm between Tat-RFP and EGFP-hCycT1 complex in the absence and presence of TAR RNA were obtained, respectively.

To determine the specificity of the interaction between Tat-RFP and EGFP-hCycT1 measured by FRET, several control experiments were performed. First, fluorescence quenching of EGFP-hCycT1 at 507 nm in the presence of wild type (solid circle) or mutant Tat-RFP (open circle) fusion proteins was monitored and plotted as a function of expressed Tat protein as illustrated in Figure 4. We used a Tat mutant harboring point mutants at 22 amino acid residue (Cys to Gly, C22G), which lacks a critical Cys residue required for high affinity interaction with hCycT1 (9) and this Tat(C22G)-RFP was unable to cause EGF-hCycT1 fluorescence quenching in our FRET analysis. Secondly, co-expression of EGP-hCycT1 with CMV-Tat-HA (5) harboring Tat sequence without RFP fusion did not show any quenching in the EGFP-hCycT1 fluorescence (data not shown). These results indicate that FRET occurred only in between the EGFP and RFP fluorophore pairs when Tat and hCycT1 interacted with each other.
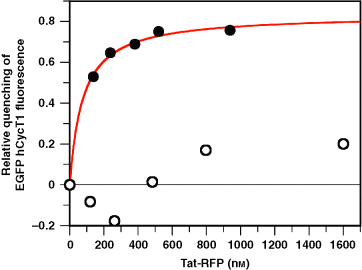
Specificity of the interactions between Tat-RFP and EGFP-hCycT1 measured by FRET. Fluorescence quenching of EGFP-hCycT1 at 507 nm in the presence of wild type (solid circles) or mutant Tat-RFP (open circles) proteins is shown. The solid lines represent the best fit of the data by nonlinear regression to quadratic equation as described above.
We next determined the effect of TAR RNA on Tat interactions with hCycT1 in living cells. We performed FRET analysis between Tat-RFP and EGFP-hCycT1 in cells transfected with HIV-LTR CAT plasmid. Fluorescence quenching of EGFP-hCycT1 at 507 nm as a function of the total Tat-RFP concentration in the presence of HIV TAR RNA sequence was measured (Figure 3D, filled circles). Our results demonstrate TAR RNA enhanced CycT1 and Tat interaction (≈6-fold) and formed a high affinity protein–protein complex with a KD of 13 ± 3 nm. These studies suggest that HIV-1 TAR RNA provides a platform or scaffold to assemble a higher order ribonucleoprotein (RNP) complex necessary for transcriptional activation by Tat. RNA-mediated assembly of RNA–protein complexes could be a general mechanism for stable RNP complex formation and a key step in regulating other cellular processes and viral replication.
To further establish the specificity of Tat-CycT1 interactions in our studies, we used RNAi-mediated silencing of Tat and analyzed its effect on FRET in vivo. EGFP-CycT1 signal was efficiently quenched in the presence of Tat-RFP and this quenching in EGFP-CycT1 signal was relieved when siRNA was transfected with Tat-RFP. In the presence of Tat siRNA, EGFP fluorescence intensity reached near the signals obtained in the absence of Tat-RFP (Figure 5A). Tat knockdown efficiencies by siRNA were confirmed by immunoblotting that showed efficient depletion of Tat by siRNA (Figure 5B, compare lanes 3 and 4). Taken together, these results demonstrate that FRET observed in living cells between EGFP-hCycT1 and Tat was due to specific protein–protein interactions and TAR RNA enhanced hCycT1-Tat interactions.
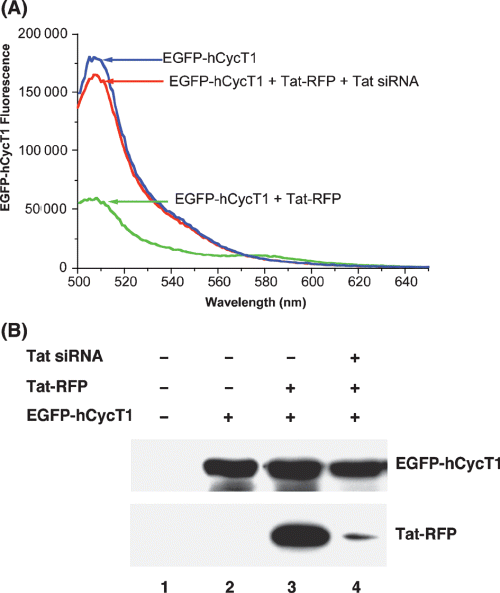
Recovery of EGFP-hCycT1 fluorescence at 507 nm by siRNA-mediated knockdown of Tat-RFP in CHO-K1 cells. (A) Fluorescence emission spectra of EGFP-hCycT1 (blue), EGFP-hCycT1 with Tat-RFP (green), and EGFP-hCycT1 with Tat-RFP and Tat siRNA (red). (B) Efficient depletion of Tat-RFP by Tat siRNA. After transfection with indicated expression vectors and siRNA, cell extracts were prepared and protein contents were resolved by SDS-PAGE and visualized by immunoblotting using hCycT1 and RFP antibodies as described previously (12). hCycT1 and RFP immunoblotting confirmed the expression of EGFP-hCycT1 (lanes 2–4) and Tat-RFP (lanes 3) in CHO-K1 cells. Tat siRNA efficiently depleted Tat expression in cells (compare lanes 3 and 4).
Significance
RNA–protein interactions dictate the formation of specific RNP complexes which are essential in controlling various cellular functions including gene regulation. Assembly of stable RNP complexes utilizes an array of protein–protein and RNA–protein interactions. One such example is the assembly of active RNA polymerase II transcription elongation complex originating from HIV-1 LTR promoter that involves HIV-1 encode Tat protein and viral mRNA structure, TAR RNA, and human CyclinT1 (hCycT1) which is a subunit of the P-TEFb. In this report, we investigated interactions between Tat and hCycT1 and determined the effect of RNA structure on these protein–protein interactions. By using genetically encoded fluorescent proteins, we quantitatively performed FRET in living cells. Our results show that CycT1 localization was specifically changed by Tat in the nucleus and CycT1-Tat interactions were significantly enhanced by the presence of TAR RNA. These studies provide a new strategy to study RNA-mediated protein–protein interactions in living cells and suggest that RNA-mediated assembly of RNP complexes could be a general mechanism important in regulating other cellular processes and progression of disease states.
Materials and Methods
Plasmids harboring the human CycT1 and HIV-1 Tat sequence
EGFP-hCycT1 plasmids were constructed by fusing the cDNA sequence of human CycT1 with DNA sequences of EGFP-C1, harboring EGFP (Clontech, Mountain View, CA, USA). Tat-RFP plasmids were constructed by fusing the DNA sequence of HIV-1 Tat with DNA sequences of DsRed1-N1, harboring coral (Discosoma spp.)-derived RFP, per the manufacturer's recommendation (Clontech). BamHI and HindIII restriction sites were used during the construction of plasmids. For control experiments, Tat(C22G)-RFP, harboring point mutation at the 22 residue of its amino acid sequence (cysteine to glycine) were also constructed by the same strategy. Cytomegalovirus (CMV) promoter controlled the expression of EGFP-hCycT1 and Tat-RFP fusion proteins, which were visualized in living cells by fluorescence confocal microscopy (Zeiss 410, Thornwood, NY, USA). EGFP-hCycT1 and Tat-RFP fusion protein expression was quantified by directly exciting the EGFP or RPF fluorophore in living cells and measuring fluorescence as described below.
Culture and transfection of cells
HeLa cells and HL3T1 cells, a HeLa cell line derivative containing an integrated HIV-1 LTR promoter and CAT reporter gene were maintained at 37 °C in Dulbecco's modified Eagle's medium (DMEM, Invitrogen, Carlsbad, CA, USA) supplemented with 10% fetal bovine serum (FBS), 100 unit/mL penicillin and 100 μg/mL streptomycin (Invitrogen). CHO-K1 cells were maintained at 37 °C in F12 medium, supplemented also with 10% FBS, 100 unit/mL penicillin and 100μg/mL streptomycin (Invitrogen). Cells were regularly passaged at subconfluence and plated at 70% confluency 16 h before transfection. Lipofectamine (Invitrogen)-mediated transient transfections of hCycT1- and Tat-harboring plasmids were performed as described by the manufacturer for adherent cell lines. For HeLa cells, a standard transfection mixture containing 1 μg Tat-RFP plasmid, 1 μg EGFP hCycT1 and 10 μL lipofectamine in 1 mL serum-reduced OPTI-MEM (Invitrogen) was added to each 35 mm well. For CHO-K1 cells, a standard transfection mixture containing 7.5 μg EGFP-hCycT1 and various concentration of wild type or mutant Tat-RFP plasmids (ranging from 25 ng to 1.5 μg), and 36 μL lipofectamine in 6 mL serum-reduced OPTI-MEM (Invitrogen) was added to each 100 mm plates. Cells were incubated in transfection mixture for 6 h and further cultured in antibiotic-free DMEM or F12 medium.
CAT enzymatic assay
About 2 μg DsRed1-N1 (empty vector harboring RFP) or Tat-RFP and 0.5 μg Luciferase reporter plasmids (pAL) were co-transfected into HL3T1 cells at 70% confluency in 60 mm dishes. Luciferase reporter gene provides an internal control. Cells were harvested at 48-h post-transfection and lysed by sonication in 300 μL Reporter lysis buffer (Promega, Madison, WI, USA) as described above. About 200 μL extracts prepared from transfected cells will incubate with 14C-labeled chloramphenicol (0.5 μCi per reaction, 10 μCi per experiment) and acetyl coenzyme A (1 mg/mL) at 37 °C for 16 h. The mixture was than extracted with equal volume of xylene and washed by equal volume of ddH2O. Acetylated forms of chloramphenicol partition into the organic phase, whereas the non-acetylated chloramphenicol and acetyl coenzyme A remain in the aqueous phase. The amount of 14C-labeled chloramphenicol converted to the acetylated form can then be measured in a liquid scintillation counter. For internal control, luciferase gene expression was measured by luciferase assay kit following the vendor's instructions (Promega). Transactivation activity of Tat-RFP was determined by CAT activity.
In vivo fluorescence analysis
HeLa cells were co-transfected with either wild type Tat-RFP or mutant Tat(C22G)-RFP plasmid and 1 μg EGFP hCycT1 by a lipofectamine-mediated method as described above except that cells were cultured on 35 mm plates with coverslip glass bottoms (MatTek Corporation, Ashland, MA, USA) instead of standard 6-well. Fluorescence in living cells was visualized 48-h post-transfection by fluorescence confocal microscopy (Zeiss 410). EGFP-hCycT1 fluorescence was detected by exciting at 488 nm and recording by band pass filter set from 515 to 545 nm. Tat-RFP fluorescence was detected by exciting at 568 nm and recording by long pass filter set from 590 nm.
FRET analysis in living cells
CHO-K1 cells were transfected with fixed concentration of pEGFP-hCycT1 and various concentrations of wild type Tat-RFP or mutant Tat(C22G)-RFP plasmid in 100 mm plates as described above. At 48-h post-transfection, cells were washed twice with PBS (Invitrogen) and then once with 2 mL trypsin. Cells were than subjected to trypsin treatment at room temperature for 2–5 min until the cells detached from the plates. Another 8 mL of F12 medium was than added to stop the trypsin reaction. Cells were collected by centrifugation at 216 × g at room temperature. After removing the trypsin-containing medium, cells were suspended in PBS buffer and subjected to fluorescence measurements (Photon Technology International, Birmingham, NJ, USA). Suspension culture was maintained by gently stirring on the magnetic stirring plates equipped in the spectrophotometer. The slit widths were set at 4 nm for both excitation and emission. All experiments were carried out at room temperature. Fluorescence of GFP in living cells was detected by exciting at 488 nm and recording the spectra from 498 to 650 nm. The spectrum peak at 507 nm represents the fluorescence intensity of GFP. Fluorescence of RFP in the same living cell culture was detected by exciting at 568 nm and recording from 588 to 650 nm; the spectrum peak at 583 nm represents the fluorescence intensity of RFP. The FRET efficiency was determined by the quenching of the fluorescence intensity of EGFP-hCycT1 in the presence of Tat-RFP.
Quantitative Western blotting and measurement of protein concentrations
Cells subjected to spectrophotometer measurements were collected by centrifugation and quick frozen in liquid nitrogen and lysed in ice-cold reporter lysis buffer (Promega) containing protease inhibitor (complete, EDTA-free, 1 tablet/10 mL buffer; Roche Molecular Biochemicals, Mannheim, Germany). After clearing the resulting lysates by centrifugation, protein in clear lysates was quantified by Dc protein assay kit (Bio-Rad, Hercules, CA, USA). Proteins in 60 μg of total cell lysate were resolved by 10% SDS-PAGE, transferred onto a polyvinylidene difluoride membrane (PVDF; Bio-Rad), and immunoblotted with antibodies against hCycT1 (Santa Cruz, CA, USA) and anti-RFP monoclonal antibody (Clontech). To determine the absolute amounts of proteins in cells, an external standard was prepared. Recombinant RFP was prepared as GST fusion proteins expressed by Escherichia coli. Recombinant P-TEFb complex (including two component: hCycT1 and CDK9) was prepared by baculoviral expression system (10,11). Dilution series of purified RFP and purified P-TEFb were prepared and resolved in SDS-PAGE. Following transfer to a PVDF membrane, the membrane was washed, blocked, and subjected to an immunoaffinity procedure with an anti-RFP monoclonal antibody (Clontech) or anti-hCycT1 antibody (Santa Cruz) and appropriate peroxidase-conjugated secondary antibody IgG. Bound IgG was detected by chemiluminescence, followed by scanning and quantitation (NIH image, Bethesda, MD, USA). Typically, in an immunoblotting experiment, each lane contains 60 μg total cell lysates from each suspension culture which has been subjected to spectrophotometer measurement. As determined by Bio-Rad protein quantification kit, 1 × 10⁶ HeLa cells equals to 195 μg total protein (average of four independent experiments). Given the average cell nuclei volume is 1050 μm3, the volume of 1 × 10⁶ cells is 1.05 μL. As chemiluminescence signal intensity of Tat-RFP in immunoblotting is equal to the signal intensity obtained from 1 ng purified RFP, thus the concentration of Tat-RFP in that particular suspension culture is equal to 106.732 nm [(1 ng/29 000 Da) × (195/60)/1.05 μL].
Acknowledgments
We thank Drs Bryan Cullen, K.-T. Jeang, Katherine Jones, B. M. Peterlin, and David Price for reagents. This work was supported by a grant from the NIH.


