Growth Inhibition Occurs Independently of Cell Mortality in Tomato (Solanum lycopersicum) Exposed to High Cadmium Concentrations
Supported by the Fonds pour la Recherche dans l'Industrie et l'Agriculture (FRIA) and the Fond Spécial pour la Recherche (FSR) from the Catholic University of Louvain.
Abstract
In order to analyze the adaptation potential of tomato shoots to a sudden increase in Cd concentration, tomato plants (Solanum lycopersicum L. var. Ailsa Craig) were exposed under controlled environmental conditions to a high dose of this heavy metal (250 μM CdCl2) in nutrient solution for 7 and 14 d. Both root and shoot growth was completely inhibited but all plants remained alive until the end of the treatment. Cell viability remained unaffected but the activity of the mitochondrial alternative pathway was stimulated by Cd stress at the expense of the cytochrome pathway. Cadmium concentration was higher in roots than in shoots and a decrease in the rate of net Cd translocation was noticed during the second week of stress. Cadmium decreased both leaf conductance (gl) and chlorophyll concentration. However, the effect on net CO2 assimilation remained limited and soluble sugars accumulated in leaves. Photochemical efficiency of PSII (Fv/Fm) was not affected despite a decrease in the number of reaction centers and an inhibition of electron transfer to acceptors of PSII. It is concluded that tomato shoot may sustain short term exposure to high doses of cadmium despite growth inhibition. This property implies several physiological strategies linked to both avoidance and tolerance mechanisms.
Cadmium is a widely spread pollutant incorporated into agricultural soils through phosphate fertilizers, sewage sludge, and atmospheric fallout from industrial and urban activities. When accumulating in plant tissues, Cd affects various morphological, physiological and biochemical processes, the most pronounced effect being growth inhibition in relation to photosynthesis decrease, restriction of water and nutrient uptake, decrease in the activity of numerous enzymes and induction of oxidative stress (Sanità di Toppi and Gabbrielli 1999; Poschenrieder and Barcelò 1999; Sandalio et al. 2001; Sobkowiak and Deckert 2003; Ruan et al. 2005). In tomato, exposure to Cd induces a decrease in chlorophyll concentration and PSII efficiency (Baszyński et al. 1980), an alteration in the phospholipid composition (Verdoni et al. 2001), in the plant mineral nutrition (Ouariti et al. 1997) and in the root ultrastructural properties (Djebali et al. 2002), but it is not clear which symptom has the most deleterious effect on plant growth.
Growth inhibition by itself is not necessarily an exhaustive criterion of injury since some physiological strategies leading to stress resistance in terms of survival may also contribute to growth inhibition (Delpérée et al. 2003; Lutts et al. 2004). In spite of the considerable amount of published reports on the subject, the fundamental mechanism of heavy metal phytotoxicity has not yet been fully characterized and is still an open question. It has been demonstrated that even under highly polluted conditions Cd concentration in the soil solution remains lower than 10 μM (Sauvé et al. 2000). Thus, in most cases, plants suffer from stress resulting from a progressive increase of Cd concentration in the shoots. Moreover, in most species, a consistent part of the absorbed heavy metals is retained in the roots, which may therefore suffer from Cd stress more quickly than the shoots. Hence, most studies dealing with Cd impact on plants consider long-term exposure to low Cd doses (Djebali et al. 2002; Zornoza et al. 2002).
Ederli et al. (2004) recently demonstrated that the plant response to Cd results from the coordination of different physiological strategies: there is accordingly an obvious necessity to undertake an integrated approach in order to gain a better understanding of Cd effect on plant growth and survival. Almansouri et al. (1999) showed that, as far as mineral toxicities are concerned, the relative importance of those strategies may be influenced by the kinetics of stress imposition. To the best of our knowledge, no data are available concerning the ability of tomato shoots to cope with a sudden burst of heavy metals. Although not directly relevant from field conditions, such study may afford valuable information concerning the resistance potential of the shoots to heavy metal stress. In vitro cultures have been used by some authors to submit plant tissues to high stress intensity (Gabbrielli et al. 1995) but these systems do not fully reflect the whole plant behavior, especially in the case of photosynthetic properties and water status, which are strongly influenced by the morphological integrity of the individuals. The use of high external Cd concentration to overcome the root sequestration and allow a massive translocation of Cd to the shoots may thus appear as the less invasive method to induce a rapid increase of toxic ions in the leaves.
The aim of the present work was to assess whether plant growth inhibition of Cd-treated tomato occurs before or after any stress-induced decrease in plant cell viability. For this purpose, plant growth, photosynthesis and water status were quantified in relation to Cd accumulation and cell viability in plants exposed for 7 and 14 d to a high external concentration of cadmium (250 μM CdCl2) in a nutrient solution.
Results
Plant growth and cell viability
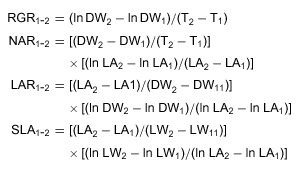
All plants remained alive during the time course of the experiment, but growth was drastically reduced in response to Cd. After only 1 week of exposure to 250 μM CdCl2, the number of leaves per plant (LN) and leaf area (LA) values as well as dry weight (DW) of both leaves and roots were lower for treated plants comparatively to controls (Table 1). A mean of three leaves appeared during the 2 weeks of treatment in Cd-treated plants, but those leaves did not extend and remained rather small. As a consequence, the LA value remained almost similar to the value observed at the time of stress imposition. Both leaves and root dry weights were reduced by 90% after 2 weeks of exposure to 250 μM CdCl2 comparatively to controls and their mean relative growth rate (RGR) were significantly affected by Cd, after 1 week of stress (Figure 1). The shoot/root ratio, however, was not significantly affected. Cadmium induced a decrease in both net assimilation rate (NAR) and leaf area ratio (LAR) values (Figure 2). A significant decrease in the specific leaf area (SLA) was noticed after only 2 weeks of treatment.
| Time (days) | Cadmium (μM) | Leaves DW (g) | Roots DW (g) | PH (cm) | LN | LA (cm2) |
|---|---|---|---|---|---|---|
| 0 | 0 | 0.09 ± 0.01 | 0.039 ± 0.006 | 2.42 ± 0.12 | 3.8 ± 0.2 | 40.0 ± 7.2 |
| 7 | 0 | 0.40 ± 0.04 | 0.096 ± 0.009 | 5.14 ± 0.30 | 6.8 ± 0.3 | 188.6 ± 16.3 |
| 250 | 0.13 ± 0.02*** | 0.036 ± 0.006*** | 3.96 ± 0.04** | 5.2 ± 0.3** | 40.4 ± 5.4*** | |
| 14 | 0 | 1.68 ± 0.40 | 0.304 ± 0.047 | 12.14 ± 0.76 | 10.2 ± 0.2 | 522.3 ± 42.5 |
| 250 | 0.19 ± 0.02** | 0.047 ± 0.006** | 4.58 ± 0.13*** | 6.8 ± 0.4*** | 54.8 ± 3.2*** |
- Each value is the mean of 10 replicates ± standard error. For a given time, asterisks indicate that there was a significant difference between means. Levels of significance: *P < 0.05; **P < 0.01; ***P < 0.001.

Relative growth rate (RGR; in g·g−1·d−1) of roots (A) and shoots (B) of tomato (Solanum lycopersicum cv. Ailsa Craig) in relation to the duration of exposure to Cd stress.Each histogram is the mean of 10 replicates and asterisks indicate the level of significance. *P < 0.05; **P < 0.01; ***P < 0.001.
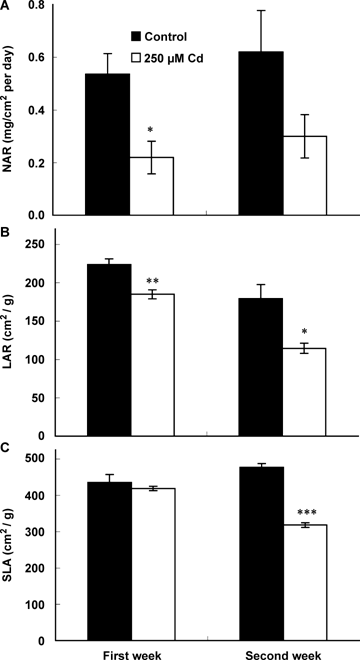
Net assimilation rate (NAR; A), leaf area ratio (LAR; B) and specific leaf area (SLA; C) of tomato (Solanum lycopersicum cv. Ailsa Craig) in relation to the duration of exposure to Cd stress.Each histogram is the mean of 10 replicates and asterisks indicate the level of significance. *P < 0.05; **P < 0.01; ***P < 0.001.
Cell viability was estimated on the basis of 2,3,5-triphenyltetrazolium chloride (TTC) reduction to formazan, which directly reflects mitochondrial activity. It is noteworthy that TTC reduction was hardly affected by Cd stress (Figure 3): after 1 week of treatment, the cell viability index remained unchanged and it only slightly decreased after 2 weeks of treatment, such a decrease being significant for leaves only. The use of specific inhibitors (potassium cyanide (KCN): inhibitors of the cytochrome pathway; salicylhydroxamic acid (SHAM): inhibitor of the alternative pathway) allowed us to quantify the relative effect of stress on the two components of the mitochondrial electron transport chain. When residual TTC reduction detected in the presence of those inhibitors are expressed as a percentage of total TTC reduction determined for each treatment in the absence of KCN and SHAM (Figure 3), it then appeared that SHAM drastically reduced formazan synthesis in Cd-treated plants but had no effect on control plants. Conversely, KCN had a greater effect on TTC reduction from control plants than from Cd-treated organs and such an effect was more marked in the roots than in the leaves. These observations suggest that the alternative oxidase pathway was stimulated in a stressed plant while the cytochrome pathway was inhibited.
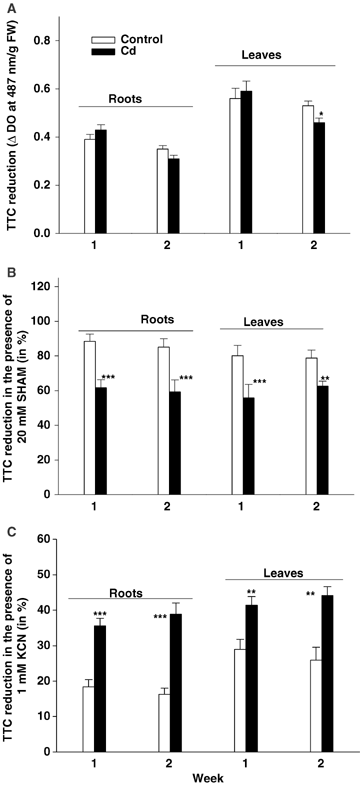
Cell viability index (2,3,5-triphenyltetrazolium chloride (TTC) reduction in ΔDO at 487 nm/g fresh weight (FW)) of tomato (Solanum lycopersicum cv. Ailsa Craig) (A).Residual TTC reduction detected in the presence of salicylhydroxamic acid (SHAM) 20 mM (B) or potassium cyanide (KCN) 1 mM (C) are expressed in percentage of the total TTC reduction determined for each treatment in the absence of inhibitors. Each histogram is the mean of six replicates. For a given duration of treatment and a given organ, asterisks indicate the level of significance. *P < 0.05; **P < 0.01; ***P < 0.001.
Cadmium accumulation and plant water status
In control plants, Cd was found as traces in roots, leaves and stems (between 0.002 and 0.150 mg Cd/g DW). As shown in Figure 4, most of the absorbed Cd was retained within the roots. Between days 7 and 14, there was no additional Cd accumulation in stems although accumulation still occurred in leaves. The transport rate (J) decreased during the second week of treatment (0.67 and 0.25 mg Cd·g−1 DW·d−1 after the first and the second week of treatment, respectively), indicating that the shoot part of the plant was saturating. In contrast, the intake rate (IR) of cadmium increased during the same period (0.51 and 2.39 mg Cd·g−1 DW·d−1).
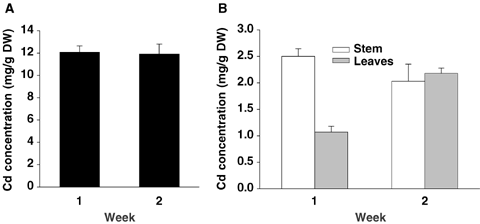
Cadmium concentration in roots (A), and shoots (B) of tomato (Solanum lycopersicum cv. Ailsa Craig) in relation to the duration of exposure to Cd stress.Each histogram is the mean of 10 replicates and vertical bars are standard errors. Note that vertical axes for roots and shoots have different scales.
Shoot water potential (ψw; Table 2) of control plants remained constant throughout the treatments while it decreased after 1 week of stress exposure in treated plants. Cadmium also induced a decrease in the leaf water content. Osmotic potential (ψcorr) decreased with the age of the leaf: cadmium induced a strong decrease in ψcorr, after 7 d of treatment, comparatively to controls. Considering the mean value obtained for ψw and ψcorr, the turgor potential of the third leaf dropped to a value close to 0.25 MPa. Instantaneous transpiration estimated on the third leaf increased with the age of the leaf, but cadmium had no significant effect on this parameter.
| Time (days) | CdCl2 (μM) | ψw (MPa) | ψcorr (MPa) | WC (%) | E (mmol ·m−2·s−1) |
|---|---|---|---|---|---|
| 0 | 0 | −0.397 ± 0.039 | −0.577 ± 0.015 | 88.89 ± 1.29 | 3.68 ± 0.22 |
| 7 | 0 | −0.348 ± 0.043 | −0.415 ± 0.011 | 93.48 ± 0.33 | 4.43 ± 0.16 |
| 250 | −0.543 ± 0.019** | −0.788 ± 0.014*** | 90.23 ± 0.84** | 4.76 ± 0.38 | |
| 14 | 0 | −0.313 ± 0.019 | −0.661 ± 0.007 | 93.71 ± 0.15 | 5.83 ± 0.52 |
| 250 | −0.445 ± 0.020** | −0.724 ± 0.012*** | 91.75 ± 0.35*** | 6.06 ± 0.67 |
- Each value is the mean of 10 replicates ± standard error. For a given time, asterisks indicate that there was a significant difference between means. Levels of significance: *P < 0.05; **P < 0.01; ***P < 0.001.
Photosynthesis-related parameters
Mean values of chlorophyll concentration are indicated in Table 3 for pooled leaves of individual plants. During the time course of the experiment, chlorophyll concentration increased with the age of the plant. Exposure of seedlings to cadmium induced a decrease in both Chl a and Chl b concentration in the leaf tissue comparatively to controls. Such a deleterious effect of cadmium increased with the duration of exposure. Indeed, the chlorophyll concentration decreased by 31.7 and 57.4% after 7 and 14 d of treatment, respectively, but the ratio Chl a/b remained unaffected. Carotenoid concentration also decreased in response to cadmium exposure after 2 weeks of treatment. Leaf conductance (gl) was strongly decreased by cadmium: the recorded decrease estimated on the third leaf was 88.03% and 80.81% after 7 and 14 d, respectively (Figure 5). The effect of the heavy metal on the net assimilation rate of CO2 (A) was clearly lower (reduction of 56.25% and 33.33% after 7 and 14 d, respectively (Figure 5B)). The instantaneous water use efficiency estimated on the basis of the ratio net assimilation rate of CO2/transpiration rate (A/E) also slightly decreased (36.55% and 45.33% after 7 and 14 d, respectively), although the difference to controls remained non significant from a statistical point of view after 1 week of treatment (Figure 5C). Free total soluble sugars concentration (TSS; Table 3) increased in response to Cd in both roots (68.3% and 68.8% after 7 and 14 d) and leaves (46.9 and 31.5%) comparatively to controls. No significant effect of Cd was recorded for chlorphyll fluorescence parameters after 7 d (detailed data not shown). After 2 weeks of exposure to Cd, the Fv/Fm ratio was similar to controls but the mean performance index (PI) was significantly reduced in Cd-treated plants (Table 4). In contrast, absorbance per cross section (ABS/CS) and the dissipation of energy per cross section (DI0/CS) increased in cadmium-treated plants. The rate of primary photochemistry per cross section (TR0/CS) was not affected by cadmium stress while the electron transport per cross section (ET0/CS) and the number of reaction centers by cross section (RC/CS) decreased.
| Time (days) | Cadmium (μM) | Chl a (mg/g FW) | Chl b (mg/g FW) | Carotenoids (mg/g FW) | TSS (mg/g FW) |
|---|---|---|---|---|---|
| 0 | 0 | 1.097 ± 0.022 | 0.365 ± 0.015 | 0.255 ± 0.022 | 3.83 ± 0.02 |
| 7 | 0 | 1.528 ± 0.028 | 0.522 ± 0.006 | 0.309 ± 0.013 | 3.13 ± 0.05 |
| 250 | 1.043 ± 0.147* | 0.354 ± 0.051* | 0.273 ± 0.013*** | 5.27 ± 0.53* | |
| 14 | 0 | 1.717 ± 0.006 | 0.637 ± 0.031 | 0.334 ± 0.041 | 3.03 ± 0.10 |
| 250 | 0.731 ± 0.011** | 0.247 ± 0.006*** | 0.227 ± 0.007*** | 8.16 ± 0.17*** |
- Each value is the mean of three replicates ± standard error. For a given time, asterisks indicate that there was a significant difference between means. Levels of significance: *P < 0.05; **P < 0.01; ***P < 0.001.
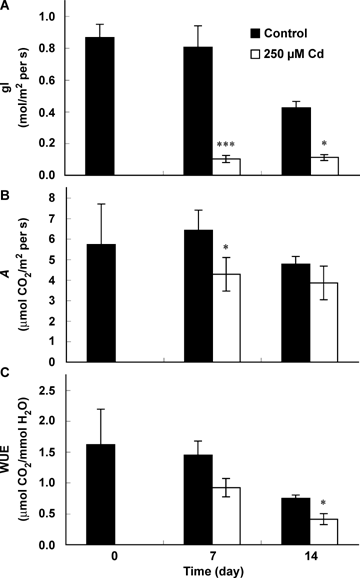
Leaf conductance (gl) (A), photosynthetic rate (A) (B) and water use efficiency (WUE) (C) of tomato (Solanum lycopersicum cv. Ailsa Craig) in relation to the duration of exposure to Cd stress.Each histogram is the mean of 10 replicates and asterisks indicate the level of significance. *P<0.05; **P<0.01; ***P<0.001.
| Time (day) | Cadmium (μM) | Fv/Fm | ABS/CS | TR0/CS | ET0/CS | DI0/CS | RC/CS0 | PI |
|---|---|---|---|---|---|---|---|---|
| 0 | 0 | 0.839 ± 0.001 | 270.9 ± 5.3 | 227.5 ± 4.5 | 147.0 ± 2.7 | 43.4 ± 0.8 | 160.6 ± 2.6 | 5.83 ± 0.11 |
| 7 | 0 | 0.846 ± 0.001 | 273.8 ± 5.7 | 231.8 ± 4.8 | 151.4 ± 3.7 | 42.0 ± 0.9 | 159.1 ± 2.9 | 6. 24 ± 0.25 |
| 250 | 0.839 ± 0.002 | 278.4 ± 6.3 | 233.6 ± 5.2 | 155.0 ± 3.5 | 44.8 ± 1.2 | 161.7 ± 4.2 | 6.06 ± 0.23 | |
| 14 | 0 | 0.843 ± 0.001 | 284.5 ± 4.6 | 239.8 ± 3.8 | 155.6 ± 2.8 | 44.6 ± 0.9 | 165.0 ± 2.2 | 5.83 ± 0.18 |
| 250 | 0.817 ± 0.016 | 322.4 ± 12.9** | 250.0 ± 4.3 | 135.4 ± 7.1*** | 72.4 ± 9.8*** | 145.1 ± 4.8*** | 3.14 ± 0.42*** |
- Each value is the mean of 20 replicates ± standard error. For a given time, asterisks indicate that there was a significant difference between means. Levels of significance: *P < 0.05; **P < 0.01; ***P < 0.001.
Lipid peroxidation
The levels of malondialdehyde (MDA, an indicator of lipid peroxidation; Figure 6) in the roots decreased throughout the duration of the experiment in both controls and Cd-treated plants and were not significantly affected by heavy metal. The level of MDA in the leaf tissues was clearly higher in Cd-treated plants than in controls after both 7 and 14 d of treatment.
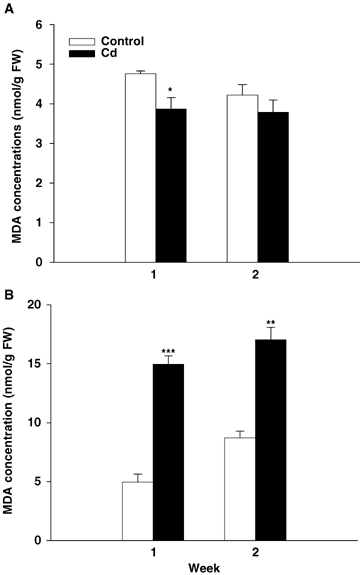
Malondialdehyde (MDA) concentration in roots (A) and leaves (B) of tomato (Solanum lycopersicum cv. Ailsa Craig) in relation to the duration of exposure to Cd stress.Each histogram is the mean of 10 replicates and asterisks indicate the level of significance: *P < 0.05; **P < 0.01; ***P < 0.001.
Discussion
The present study suggests that the survival rate of tomato plants exposed to a high external Cd concentration (250 μM) for a short period (14 d) may remain unaffected while growth was completely inhibited. Indeed, Cd induced a clear decrease in RGR of both shoots and roots, but no plant died during the time course of the experiment and the cell viability index did not decrease in roots and was only marginally affected in leaves. It may therefore be hypothesized, that under our experimental conditions, growth inhibition did not result from a decrease in cell viability.
Cadmium toxicity results (at least partly) from secondary stresses such as water stress (Barcelò and Poschenrieder 1990; Poschenrieder and Barcelò 1999) and oxidative stress (Sanità di Toppi and Gabbrielli 1999; Sandalio et al. 2001). Considering the high external dose of Cd used in the present study, accumulation of this heavy metal in the shoots was higher than values commonly reported for tomato exposed to Cd toxicity (Baszyński et al. 1980; Ouariti et al. 1997; Verdoni et al. 2001; Djebali et al. 2002) but our stressed plants remained able to perform osmotic adjustment and stomatal closure to reduce the effect of Cd on the leaf water status. Moreover, stressed plants also appeared able to decrease the cadmium translocation rate during the second week of stress independently of its rate of intake and thus displayed a typical “excluding” strategy. Roots accumulate higher amounts of Cd: however, only a marginal difference among treatments was recorded for root MDA concentration. Despite the maintenance of cell viability, our results also show that a shift occurred for electron mitochondrial transport from the cytochrome to the alternative oxidase pathways in the leaves. This can help in the stabilization of the reduction state of the ubiquinone pool and then attenuate the formation of reactive oxygen species in mitochondria (Millenaar et al. 1998; Parsons et al. 1999). Since alternative pathway results from the transfer of electron to O2 via route branching at the ubiquinone level, the phosphorylation sites of the cytochrome path are by-passed and it is energetically inefficient. Our results are therefore in line with the data of Florez-Sarasa et al. (2007) who showed that the relative growth rate was highly dependent on the activity of the cytochrome pathway, which was clearly inhibited in our Cd-treated plants.
Beside cell death, growth inhibition may also result from an inhibition of cell division, a decrease in the rate of cell elongation or both processes occurring simultaneously. New leaves still appeared during the stress period, although at a lower rate than in control plants, and this suggests that the activity of the meristems was not abolished. In contrast, the fact that the leaf area remained quite low in stressed plants suggests that cell elongation was drastically reduced. Although osmotic adjustment may help in turgor maintenance, turgor pressure dropped to a value close to 0.25 MPa which may somewhat contribute to a decrease in cell elongation. An effect of heavy metals on the physical properties of cell walls could, however, not be excluded, especially if we consider that sequestration of heavy metals in apoplasm has been reported as a strategy to avoid heavy metal toxicity within the cell (Zornoza et al. 2002). Barceló and Poschenrieder (1990) already reported that Cd toxicity may induce a decrease in cell wall extensibility at the mesophyll level, while Ederli et al. (2004) reported a Cd-induced increase in lignin content at the cell wall level in Phragmites australis.
We showed that cadmium mainly affected LAR, but that NAR decrease was not significant from a statistical point of view, confirming that leaf expansion was the main growth limiting factor. In this respect, growth appears to limit photosynthesis (probably through sugar accumulation (Table 3)) rather than the opposite. Since SLA did not decrease in our stressed plants until the second week of treatment, it may be inferred that the leaf mass ratio (the fraction of total plant biomass allocated to the leaves) decreased in Cd-treated plants. Inhibition of photosynthesis under stress conditions is commonly attributed to stomatal or to non-stomatal causes. We observed a sharp decrease in leaf conductance occurring already after 7 d of stress (Figure 5C). Such a reduction, in addition with the observed reduction in LA, may be considered as an avoidance mechanism, which minimizes water losses. The decrease in leaf conductance was one of the most pronounced effects induced by Cd but its effect on A values was limited from a relative point of view, suggesting that in our plant material, even in control conditions, other parameters constitute the rate limiting step of photosynthesis processes. Similarly, a decrease in gl also had a limited effect on the instantaneous transpiration rate (E) (Table 2). This could be due to the fact that a reduced gl also increases leaf temperatures and leaf-to-air vapor pressure differences, which both counteract the decrease in leaf conductance (Farquhar et al. 1989).
Toxic effects of Cd have also been attributed to a decrease in pigment concentration and/or to modification in photosystem architecture. In our work, both Chl a and Chl b decreased to similar extents and the Chl a/Chl b ratio thus remained more or less constant. This contrasts with the results of Baszyński et al. (1980) who reported an increase in this ratio. Cadmium was indeed found to inhibit the chlorophyll synthesis (Stobart et al. 1985; Horvath et al. 1996) or to activate its enzymatic degradation (Somashekaraiah et al. 1992). In barley, Stobart et al. (1985) reported that Cd mainly affects Chl b biosynthesis through its negative effect on the synthesis of 5-aminolevulinic acid and on the stability of the complex of protochlorophyll reductase with its substrate. According to Ferretti et al. (1993), Cd effect on Chl a/Chl b ratio strongly depends on the external dose of this heavy metal used during the experimental approach. Carotenoids also assume crucial functions in the photosynthetic process, mainly in relation to the protection of photosystems. Carotene concentration decreased in our Cd-treated plants, but such a decrease occurred later and was more limited from a relative point of view than the decrease recorded for chlorophyll content so that the decrease in carotenoid concentration could not be considered as the primary cause of chlorophyll sensitivity to Cd, as was reported by Krupa et al. (1987) in radish seedlings.
In the present study, Cd had no obvious effect on the ratio of the maximal variable fluorescence to the maximum level of chlorophyll fluorescence (Fv/Fm). It may therefore be inferred that PSII was protected from gross ultrastructural and functional modification; a stress-induced increase in oxidative defenses may play a crucial role in this respect (Mazhoudi et al. 1997; Sandalio et al. 2001). Nevertheless, a constant value for Fv/Fm does not imply that PSII was not affected at all by heavy metal. In Phragmites australis, Pietrini et al. (2003) reported that both F0 and Fm values decreased in response to Cd as a consequence of non-radiative energy dissipation in the pigment bed or from transfer to PSI, but that these modifications did not lead to significant modifications in the Fv/Fm ratio. Quantification of the performance index using the JIP method (Strasser and Strasser 1995) allowed us to discriminate more accurately among the various steps of light harvesting and electron flow (Table 4). A decrease in PI was noticed after only 2 weeks of stress, whereas the chlorophyll concentration decreased after 1 week of treatment. The number of functional reaction centers per cross section (RC/CS0) decreased after 2 weeks, at a time when carotenoid concentration also decreased. Reaction centers of PSII are multisubunit pigment-protein complexes containing membranes D1 and D2 protein, P680, additional chlorophylls, pheophytins, carotenoid and plastoquinones bound to membrane proteins. According to Franco et al. (1999), the decrease in the number of active PSII centers may be caused by changing the equilibrium between photoinhibition, D1 synthesis and D1 degradation: Cd interferes with the degradation of the D1 protein by a protease and the damaged D1 protein cannot be replaced. In contrast, Cd had no effect on the trapping phase (TR0/CS) suggesting that the efficiency of energy capture at the level of the remaining active reaction centre was not affected. Similarly, the light harvesting complex by itself was not affected and ABS/CS even increased in Cd-treated plants. In this respect, the increase in energy lost as heat during excitation transfer (DI0/CS) may be linked to the necessity to avoid an excess of oxidative stress under conditions when subsequent trapping was not improved. In contrast, the transfer of electron to the early electron acceptors of PSII was affected, as indicated by a decrease in ET0/CS after 2 weeks of stress. The inhibition of the acceptor (reducing) site of PSII by heavy metals may occur at the secondary quinone acceptor (QB) (Mohanty et al. 1989) or between pheophytin and QA (Yruela et al. 1993).
The present study focused on the short-term response of tomato to high external Cd concentrations. There is no doubt that a longer exposure to such a high dose would lead to the death of the treated plants since 250 μM Cd should be regarded as a lethal dose. Nevertheless, despite a complete growth inhibition, several strategies seem to be used by the plants to reduce the effect of Cd during the time course of our experiment. The decrease in the net transport of Cd and in osmotic potential to avoid heavy metal toxicity, and dehydration may be considered as an avoidance strategy, while tolerance mechanisms should also be used by the plant to cope with the accumulated Cd in relation to protection of the photosystems and management of oxidative stress.
Materials and Methods
Plant material and culture conditions
Tomato seedlings (Solanum lycopersicum L. var. Ailsa Craig (TGRC Davis, CA, USA)) were germinated on a compost substrate (50% white peat, 50% black peat, 1 000 g fertilizer PG-Mix (14-16-18)/m3). After 15 d, 120 seedlings were fixed on polystyrene plates and transferred on polypropylene containers (one plant per container) holding 1.2 L of aerated modified Hoagland-nutrient solution (Lefèvre et al. 2005). The nutrient solution was renewed every 3 d.
Plants were kept in a controlled chamber at 20–22 °C with a 16:8 h light : dark regime and under a relative humidity of 78 ± 5%. The photosynthetic photon fluence rate (PPFR) at the plant canopy level was of 130–180 μmol·m−2·s−1 (HPIT 400 Watts, Philips Lighting S.A., Brussels, Belgium). Seven days after transfer, 80 plants (at the four or five leaves stage) were exposed to 250 μM CdCl2 in nutrient solution. Plants were harvested at the time of stress imposition, after 7 and 14 d of exposure, respectively.
Growth parameters
At the three sampling time, LN and plant height (PH) were estimated on 10 plants per treatment. Leaves, roots and stems were immediately weighed to determine fresh weight (FW) and then desiccated at 70 °C for 48 h prior to DW estimation. LA was determined by an Image Analysis System (Delta-T Devices Ltd, Cambridge, UK) coupled to WinDias software.
Cell viability
Cell viability was determined on six plants per treatment (roots and third leaf) as previously described (Lutts et al. 2004): tissue samples were excised, quickly rinsed in deionised water containing 0.05% Tween 20 and incubated at 30 °C in darkness in 0.5% TTC dissolved in 50 mM K2HPO4, pH 7.0 for 15 h. Samples were then incubated in 3 mL ethanol 94% at 80 °C After centrifugation at 5 000g for 1 min, extracted formazan was quantified spectrophotometrically at 487 nm. The viability index is defined as the absorbance measured per gram of fresh tissue. In order to quantify the respective proportion of the cytochrome and the alternative respiratory pathways, TTC reduction was also analyzed in the presence of 1 mM KCN or 20 mM SHAM or both inhibitors according to Lutts et al. (2004).
Water relations measurements
Mean water content (WC) was expressed, using the values obtained for fresh and dry weights of all of the different parts of the plant (ten plants). Midday osmotic potential (ψs) was determined from the third leaf (numbered acropeticaly) of ten seedlings, cut in small segments, frozen in liquid nitrogen and stored at −80 °C. Leaf tissues were thawed and centrifuged at 15 000g for 15 min at 4 °C to extract the cell sap. Osmotic potential of the cell sap was measured using a vapor pressure osmometer (model 5500, Wescor Inc., Logan, UT, USA) and converted from mosmol/Kg to MPa using the Van't Hoff equation. In order to take into account the putative loss of water in stressed tissues, osmotic potential was readjusted according to ψcorr = ψs × (WCS/WCC) where WCS and WCC are the water content of stressed and control plants, respectively. Mean ψcorr was calculated from 10 seedlings per treatment.
Midday leaf water potentials (ψw) were measured with a Scholander pressure chamber (PMS instruments Co., Corvallis, OR, USA) from the second leaf (numbered acropeticaly) of seedlings and expressed in MPa. Mean ψw was calculated from 10 seedlings per treatment.
The midday abaxial leaf conductance (gl) was measured from the second and the third leaves of seedlings with an automatic porometer (model AP4, Delta-T-Devices Ltd, Cambridge, UK). Mean gl was calculated from five plants per treatment and expressed in mol·m−2·s−1.
Cadmium analysis and transport
Fifty milligrams of desiccated samples (DW) corresponding to each type of organ (roots, stems and pooled leaves) were digested in 4 mL of HNO3 (35%; v/v). Minerals were suspended in 10 mL of HCl (0.1 M), stirred, filtered and stored at −20 °C until analysis using atomic absorption spectrometry (spectrAA-300 VARIAN Inc., CA, USA).

Photosynthetic parameters
Chlorophyll fluorescence measurements were carried out in situ using a portable fluorimeter Handy Plant Efficiency Analyser (PEA, Hansatech, King's Lynn, UK). The recordings were carried out on the third mature leaf. Measurements (10 per treatment) were carried out on the middle part of the abaxial side of the leaves. Leaf portion was acclimated to darkness over 30 min. Fluorescence was measured at 12 bit resolution and excited by six light emitting diodes providing a saturating beam of actinic red light (650 nm, 600 W/m2, 3 200 μmol·m−2·s−1). Maximum yield of photochemistry (Fv/Fm), absorbance per cross section (ABS/CS, antenna size), number of reaction center in cross section (RC/CS), rate of primary photochemistry per cross section (TR0/CS0), electron transport per cross section (ET0/CS), as well as the dissipation energy per cross section (DI0/CS) and the performance index (PI) were measured according to the JIP method of Strasser and Strasser (1995), which implies the measurement of a fast fluorescence transient with a 10 μs resolution in a time span of 40 μs to 1 s to allow the dynamic measurement of a photosynthetic sample at a given physiological state.
Instantaneous CO2 assimilation rate (A) and instantaneous transpiration rate (E) were determined on the third mature leaf of 10 plants by monitoring depletion of CO2 and H2O using a portable Infra Red Gas analyzer (Type LCA4, Bioscientific Ltd, UK). In order to gain information on the influence of Cd on the efficiency of carboxylation independently of stomatal regulation, a saturating CO2 concentration was used (CO2 concentration of air entering the chamber ranged from 1 426 to 1 459 volume per million (vpm) over the experiment. Leaf temperature in the cuvette during measurements ranged from 23–24 °C. Mean A expressed in μmol CO2·m−2·s−1 and mean E expressed in mmol H2O·m−2·s−1 were determined from 10 plants for each treatment.
For pigment quantification, pooled leaves from ten plants were harvested, frozen in liquid nitrogen and kept at −80 °C until analysis. Chlorphyll (Chl a and Chl b) and total carotenoid (xanthophylls+ß-carotene) concentrations were determined using 100 mg of FW grounded in a prechilled mortar in the presence of 8 mL acetone 80% (v:v). After complete extraction, the mixture was filtered and the volume adjusted to 10 mL with cold acetone. The absorbance of the extract was read at 663.2, 646.8 and 470 nm using a Beckman DU640 spectrophotometer and pigment concentrations were calculated according to Lichtenthaler (1987).
For free soluble sugar extraction, 1 g of frozen samples (10 pooled plants) was ground in liquid nitrogen to a fine powder and then extracted with 4 mL of 70% ethanol in water (v:v). Extracts were centrifuged for 15 min at 6 000g and 4 °C. Total soluble sugars in the supernatant were estimated according to Yemm and Willis (1954) and were expressed in mg of glucose equivalent per unit of fresh weight.
Oxidative damages
The level of lipid peroxidation was measured as 2-thiobarbituric acid-reactive substances (mainly MDA). Frozen samples (0.25 g from 10 pooled plants) were homogenized with a pre-chilled mortar and pestle with 5 mL of ice-cold 5% (w/v) trichloroacetic acid (TCA) and centrifuged at 12 000 g for 15 min and at 4 °C. Assay mixture containing a 2-mL aliquot of supernatant and 2 mL of 0.67% (w/v) thiobarbituric acid was heated to 100 °C for 30 min and then rapidly cooled to 4 °C in an ice-bath. After centrifugation (10 000g for 1 min at 4 °C), the supernatant absorbance was read (532 nm) and values corresponding to non-specific absorption (600 nm) were subtracted. MDA concentration was calculated using its molar extinction coefficient (155·mM−1·cm−1).
Statistical analysis
Each experiment was, at minimum, repeated twice and all lead to statistically similar results. Data presented hereafter are from one single experiment. Data were compared by analysis of variance (ANOVA) using the SAS software (SAS Institutes, Tervuren, Belgium). General mean values were compared using the Scheffé method.
(Handling editor: Zhi-Zhong Gong)
Acknowledgements
The authors are grateful to B. Van Pee for valuable technical assistance and to Dr B. Delvaux and Mrs A. Iserentant for her help in the quantification of Cd.


