Associations of Body Mass Index and Weight Loss with Mortality in Transplant-Waitlisted Maintenance Hemodialysis Patients
Abstract
A body mass index (BMI) below morbid obesity range is often a requirement for kidney transplant wait-listing, but data linking BMI changes to mortality during the waitlist period are lacking. By linking the 6-year (7/2001–6/2007) national databases of a large dialysis organization and the Scientific Registry of Transplant Recipients, we identified 14 632 waitlisted hemodialysis patients without kidney transplantation. Time-dependent survival models examined the mortality predictability of 13-week-averaged BMI, pretransplant serum creatinine as a muscle mass surrogate and their changes over time. The patients were on average 52 ± 13 years old, 40% women and had a BMI of 26.9 ± 6.3 kg/m2. Each kg/m2 increase of BMI was associated with a death hazard ratio (HR) of 0.96 (95%CI: 0.95–0.97). Compared to the lowest creatinine quintile, the 4th and 5th quintiles had death HRs of 0.75 (0.66–0.86) and 0.57 (0.49–0.66), respectively. Compared to minimal (< ± 1 kg) weight change over 6 months, those with 3 kg–<5 kg and ≥5 kg weight loss had death HRs of 1.31 (1.14–1.52) and 1.51 (1.30–1.75), respectively. Similar associations were observed with creatinine changes over time. Transplant-waitlisted hemodialysis patients with lower BMI or muscle mass and/or unintentional weight or muscle loss have higher mortality in this observational study. Impact of intentional weight change remains unclear.
Abbreviations:
-
- BMI
-
- body mass index
-
- CI
-
- confidence interval
-
- ESRD
-
- end-stage renal disease
-
- HD
-
- hemodialysis
-
- HR
-
- hazard ratio
-
- IQR
-
- interquartile range
-
- MHD
-
- maintenance hemodialysis
-
- MICS
-
- malnutrition-inflammation-complex syndrome
-
- nPCR
-
- normalized protein catabolic rate
-
- nPNA
-
- normalized protein nitrogen appearance
-
- PTH
-
- parathyroid hormone
-
- SRTR
-
- Scientific Registry of Transplant Recipients
-
- TIBC
-
- total iron binding capacity
-
- WBC
-
- white blood cell
Introduction
Kidney transplantation is the treatment of choice in patients with end-stage renal disease (ESRD), since patients with functioning renal grafts have both survival benefits (1) and better quality of life (2) compared to transplant-waitlisted patients on maintenance dialysis. Approximately 80 000 (20%) of the 400 000 U.S. dialysis patients are currently on transplantation waiting lists, although each year only 16 500 of these patients receive a renal transplant (3,4). At least half of these patients receive a deceased kidney, which currently requires a wait period of 3–6 years in most regions of the United States (3). During this period, up to 40% of the transplant-waitlisted dialysis patients die (5). Hence, identifying the modifiable risk factors of poor survival during the waitlist period is of immense importance. Nevertheless, dialysis patients on transplant waiting lists have indeed better survival than their nonlisted counterparts, which may be related to the waitlist patient's having less severe comorbidities (6).
Obesity, defined as a body mass index (BMI) >30 kg/m2, is associated with increased morbidity and mortality in the general population (7). Overweight and obesity are highly prevalent in patients at the time of kidney transplantation (8). However, maintenance hemodialysis patients have exhibited an ‘obesity paradox’, where higher BMI is associated with greater survival, as seen in numerous observational studies (9–12). Indeed, most transplant centers may suspend wait-listing of obese patients with a BMI above 30 or 35 kg/m2 and refer them for weight reduction procedures such as bariatric surgery as a contingency for the transplant surgery (13). In a recent report BMI≥35 kg/m2 was the third most common reason to deny patient active transplant wait-listing, affecting approximately 10% of potential renal transplant candidates (14). However, consequences of obesity or changes in weight during the period of wait-listing, which usually last 4–7 years in the United States, remain unclear (15,16). Weight changes prior to transplantation may be transient, especially since most renal transplant recipients experience weight gain following a successful kidney transplant (17). Hence, weight loss before transplantation might not alleviate the risk of obesity after transplantation.
Previous studies of obesity in kidney transplant recipients used solely BMI to define obesity (18–21), but BMI is unable to differentiate between adiposity and muscle mass (12). Reduced muscle mass (sarcopenia) is a predictor of mortality in dialysis patients (22). Sarcopenia deteriorates skeletal, respiratory and cardiac muscle function, compromising the vital functions of these organ systems. It also restricts muscle-based oxidative metabolism leading to decreased antioxidant defense (23). To better characterize patients’ nutritional status, additional parameters such as waist circumference or serum creatinine have been suggested (24). Serum creatinine may better reflect muscle mass under steady-state conditions compared to BMI (22,24–26).
We examined associations of BMI, pretransplant serum creatinine as a surrogate marker of muscle mass, and changes in weight with mortality in a large national cohort of transplant-waitlisted dialysis patients. We hypothesized that higher BMI and serum creatinine are associated with better survival during the wait-listing period and that losing weight; especially losing muscle mass while on the wait-list is associated with elevated mortality risk in this population.
Materials and Methods
Patients
We linked data of all renal transplant recipient listed in the Scientific Registry of Transplant Recipients (SRTR) up to June 2007 to the list of individuals with chronic kidney disease stage 5, who underwent maintenance hemodialysis (MHD) treatment from July 2001 to June 2007 in any of the outpatient dialysis facilities of a U.S.-based large dialysis organization (DaVita Inc., prior to its acquisition of former Gambro dialysis facilities). We identified 14 632 DaVita MHD patients, who were transplant waitlisted but who did not receive any kidney transplantation for up to 6 years. The study was approved by the Institutional Review Committees of both Los Angeles Biomedical Research Institute at Harbor-UCLA and DaVita Clinical Research. Because of the large sample size, the anonymity of the patients studied and the nonintrusive nature of the research the requirement for informed consent was waved.
Clinical and demographic measures
The creation of the national DaVita MHD patient cohort has been described previously (27–32). To minimize measurement variability, all repeated measures for each patient during any given calendar quarter, i.e. over a 13-week or 3-month interval, up to the end of the study or death, were averaged and the quarterly means in each of the 20 calendar quarters were used in time-dependent analyses. In addition to quarterly laboratory values, posthemodialysis dry weight (to calculate averaged BMI) was also recorded. Each patient had up to 39 recoded posthemodialysis weight measurements corresponding to thrice-weekly MHD treatments. All values were averaged into one single quarterly value per patient per each calendar quarter.
We divided BMI into six a priori selected categories (12–19.99 kg/m2, 20–22.99 kg/m2, 23–24.99 kg/m2, 25–29.99 kg/m2, 30–34.99 kg/m2 and 35–60 kg/m2). These increments were consistent with those selected in our previous study (33). As dialysis dose has an impact on serum creatinine we used the Kt/V adjusted serum creatinine in all of our analysis. We divided adjusted serum creatinine into five a priori selected categories (<7.3 mg/dL, 7.3–<9.3 mg/dL, 9.3–< 11.0 mg/dL, 11.0–<13.0 mg/dL and ≥ 13.0 mg/dL). We also calculated the percentage of change in weight over the first 6 months of the cohort in 9460 MHD patients. Based on these data we divided weight change into seven a priori selected categories (change in weight: ≤−5 kg, −5 kg–<−3 kg, −3 kg–<−1 kg between –1 kg and +1 kg, 1 kg–<3 kg, 3 kg–<5 kg and ≥ 5 kg). Similarly, we divided the change of adjusted serum creatinine into five a priori selected categories (<(−1) mg/dL, (−1)–(0.2) mg/dL, (−0.2)–1.2 mg/dL, 1.2–2.4 mg/dL and ≤ 2.4 mg/dL). Dialysis vintage was defined as the duration of time between the first day of dialysis treatment and the day of death or end of the study.
Laboratory measures
Blood samples were drawn using uniform techniques in all of the DaVita dialysis clinics and were transported to the DaVita Laboratory in Deland, Florida, typically within 24 h. All laboratory values were measured by automated and standardized methods in the DaVita Laboratory. Most laboratory values were measured monthly, including serum urea, creatinine, albumin, calcium, phosphorus, bicarbonate and total iron binding capacity (TIBC). Serum ferritin and intact PTH were measured at least quarterly. Hemoglobin was measured at least monthly in essentially all patients and weekly to bi-weekly in most patients. Most blood samples were collected predialysis with the exception of the postdialysis serum urea nitrogen that was obtained to calculate urea kinetics. Kt/V (single pool) was calculated using urea kinetic modeling equations as described elsewhere (34). Albumin-corrected calcium was calculated by subtracting 0.8 mg/dL for each g/dL serum albumin below 4.0 g/dL (35).
Statistical methods
Time-dependent Cox survival models were employed to examine the associations of calendar-quarterly BMI and the percentage of change in weight over 6 months with survival. Nonlinear and linear associations were assessed using fractional polynomials and restricted cubic splines. To examine the combined mortality predictability of the changes in dry weight and adjusted serum creatinine over the 6 year cohort, we added the patient's ranked percentile change in these two measures. Patients were ranked −100 to 0 for a decrease or 0 to +100 for an increase in percentile change of these laboratory values, using methodology we have recently developed as previously described (30). Subsequently we analyzed the mortality predictability of the created ‘joint’ weight and serum creatinine percentile scores, i.e. a number between −200 and +200 for each hemodialysis patient. In an attempt to mitigate the impact of the regression to the mean phenomena, all survival models that examined the ‘change’ as a mortality predictor were also controlled for the baseline weight or adjusted serum creatinine
In our survival analysis the patients were followed until death, other censoring events including loss of follow-up or end of the follow-up period, whichever happened first. For each analysis, three models were examined based on the level of multivariate adjustment:
- (I)
A minimally adjusted model that included mortality data, and entry calendar quarter (q1 through q20);
- (II)
Case-mix adjusted models that included all of the above plus age, gender, race and ethnicity (African Americans and other self-categorized Blacks, Non-Hispanic Whites, Asians, Hispanics and others), diabetes mellitus, categories of dialysis vintage (<6 months, 6 months to 2 years, 2–5 years and ≥5 years), primary insurance (Medicare, Medicaid, private and others), marital status (married, single, divorced, widowed and other or unknown), the standardized mortality ratio of the dialysis clinic during entry quarter, dialysis dose as indicated by Kt/V (single pool), presence or absence of a dialysis catheter and residual renal function during the entry quarter, i.e. urinary urea clearance; smoking status and comorbidities (cancer, cardiac arrest, cardiac failure, ischemic heart disease, dysrhytmia, myocardial infarction, pericarditis, HIV, peripheral vascular disease, pulmonary disease) and
- (III)
Malnutrition-inflammation-complex syndrome (MICS) adjusted models which included all of the covariates in the case-mix model as well as 10 surrogates of nutritional status and inflammation, including 11 laboratory variables with known association with clinical outcomes in HD patients: (1) serum albumin, (2) serum TIBC, (3) serum ferritin; (4) serum phosphorus, (5) serum calcium, (6) serum bicarbonate, (7) peripheral white blood cell count (WBC), (8) lymphocyte percentage, (9) hemoglobin and (10) nPCR as an indicator of daily protein intake, also known as the normalized protein nitrogen appearance (nPNA).
As death and transplantation are competing events, the association of BMI and weight change with two outcomes was assessed by means of semiparametric time-dependent competing-risks regression analyses in sensitivity analysis (36). In these analyses we examined the entire waitlisted DaVita cohort (n=29 140) including patients who were transplanted and those who remained on the waiting list throughout the follow-up period.
Sporadically missing covariate data were imputed by the last value carried forward method. Most analyses were carried out with STATA version 11.1 (STATA Corporation, College Station, TX, USA).
Results
The original 6-year (7/2001–6/2007) national database of all DaVita patients included 164 789 adult subjects. This database was linked via unique identification number to the national SRTR registry that included all transplant-waitlisted patients and renal transplant recipients up to 06/2007 (see Figure 1). Out of 65 386 DaVita MHD patients who were identified in the SRTR database, 18 185 MHD patients were listed for kidney transplantation between 7/2001 and 7/2007. After excluding those without electronically recorded age data (n = 626), outlier BMI (probably due to wrong height values, n = 1818), subjects who interrupted MHD treatment (n = 2444) and those without electronically recorded age at the base quarter (n = 61) there were 14 632 MHD patients who met all inclusion and exclusion criteria and who remained on MHD throughout the observation period. These patients were followed until death, loss of follow up or survival until June 30, 2007, as recorded in the SRTR and DaVita databases. Among the 14 632 observed waitlisted MHD patients with a median follow-up time of 907 days, there were 5060 deaths (35%). Table 1 compares the demographic, clinical and laboratory characteristics of the 14 632 wait-listed MHD patients in the 6-year DaVita cohort across the BMI categories. Higher BMI was associated with older age, higher prevalence of diabetes and higher serum creatinine level. As shown in Table 1, the crude mortality was lowest in the highest BMI category (>35 kg/m2).
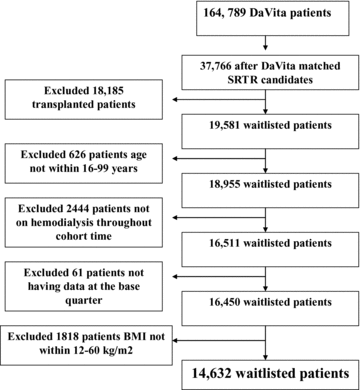
Flow chart of the patient selection.
| BMI range (kg/m2) | <20.0 | 20–<22 | 22–<25 | 25–<30 | 30–<35 | ≥35.0 | P-for trend |
|---|---|---|---|---|---|---|---|
| N [%] | 1523 [11] | 1795 [12] | 3108 [21] | 4274 [29] | 2348 [16] | 1584 [11] | N/A |
| Age (years) | 49 ± 14 | 50 ± 13 | 52 ± 13 | 53 ± 12 | 52 ± 11 | 50 ± 11 | <0.001 |
| Deaths [and crude death rate] | 788 [52] | 780 [43] | 1160 [37] | 1308 [31] | 665 [28] | 359 [23] | <0.001 |
| Gender (% women) | 51 | 41 | 36 | 36 | 41 | 48 | 0.122 |
| Race (% black) | 34 | 32 | 34 | 34 | 39 | 42 | <0.001 |
| Diabetes mellitus (%) | 30 | 34 | 40 | 44 | 50 | 51 | <0.001 |
| BMI (kg/m2) | 18.3 ± 1.4 | 21.1 ± 0.6 | 23.5 ± 0.8 | 27.2 ± 1.4 | 32.2 ± 1.4 | 39.5 ± 4.3 | <0.001 |
| Weight (kg) | 51 ± 8 | 61 ± 8 | 68 ± 9 | 78 ± 11 | 93 ± 13 | 111 ± 19 | <0.001 |
| Myocardial infarction (%) | 2 | 2 | 3 | 3 | 4 | 3 | 0.015 |
| Ischemic heart disease (%) | 6 | 6 | 8 | 8 | 11 | 7 | <0.001 |
| Heart failure (%) | 10 | 10 | 12 | 15 | 18 | 16 | 0.002 |
| Peripheral vascular disease (%) | 4 | 4 | 5 | 5 | 5 | 6 | <0.001 |
| Pulmonary disease (%) | 3 | 2 | 1 | 1 | 2 | 3 | <0.001 |
| Serum creatinine (mg/dL) | 8.6 ± 2.9 | 9.4 ± 3.0 | 9.6 ± 3.0 | 9.7 ± 2.9 | 10.1 ± 3.0 | 10.0 ± 3.1 | <0.001 |
| Hemoglobin (g/dL) | 12.0 ± 1.4 | 12.0 ± 1.4 | 12.1 ± 1.3 | 12.2 ± 1.3 | 12.2 ± 1.2 | 12.1 ± 1.1 | <0.001 |
| Serum phosphate (mg/dL) | 5.7 ± 1.7 | 5.8 ± 1.6 | 5.7 ± 1.5 | 5.7 ± 1.5 | 5.9 ± 1.5 | 6.0 ± 1.5 | <0.001 |
| Serum ferritin (ng/mL) (median (IQR)) | 571 (319–873) | 520 (295–807) | 525 (283–795) | 520 (311–771) | 524 (314–746) | 508 (293–743) | <0.001 |
| Serum albumin (g/dL) | 3.6 ± 0.6 | 3.8 ± 0.5 | 3.8 ± 0.5 | 3.9 ± 0.4 | 3.9 ± 0.4 | 3.8 ± 0.4 | <0.001 |
| WBC (x103/l) | 7.3 ± 3.0 | 7.1 ± 2.5 | 7.0 ± 2.5 | 7.1 ± 2.5 | 7.3 ± 2.2 | 7.5 ± 2.1 | 0.001 |
- Values in parentheses represent the proportion of the HD patients in each BMI category. Values in brackets indicate the crude death rate in the indicated group during the 6 years of observation.
- IQR: interquartile range.
Using the Cox regression model to calculate death HR before adjustment and after adjustment for case-mix and additional MICS variables, each one kg/m2 increase in BMI was associated with a death HR (and 95% confidence interval) of 0.96 (0.95–0.96), 0.95 (0.94–0.95) and 0.96 (0.95–0.97), respectively (p < 0.001). The association of BMI categories with the waitlisted risk of death is shown in Figure 2 and Table 2. As shown in Table 2, compared to the BMI of 22 to <25 kg/m2 (reference), the case-mix adjusted death risk in wait-listed MHD patients with a BMI of 25–30 kg/m2 was 26% lower (p < 0.001). The BMI >35 kg/m2 group had a 40% lower death risk after adjusting for both case-mix and MICS variables (p < 0.001). Cubic spline analyses confirmed a linear association between lower BMI values and higher death risk, especially with BMI levels below 40–45 kg/m2 (Figure 2).
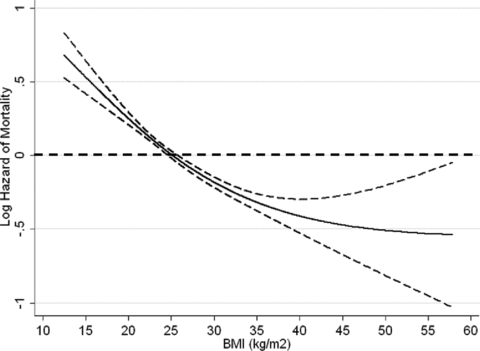
Hazard ratios (95% confidence intervals) of mortality across the BMI variable, using Cox regression analyses in 14 632 long-term MHD-waitlisted patients who were observed over a 6-year observation period (7/2001–6/2007).
| Body mass index (kg/m2) | Minimally adjusted | Case-mix adjusted* | Case-mix and MICS adjusted** | |||
|---|---|---|---|---|---|---|
| HR (95% CI) | p-Value | HR (95% CI) | p-Value | HR (95% CI) | p-Value | |
| <20 | 1.40 (1.28–1.54) | <0.001 | 1.51 (1.36–1.68) | <0.001 | 1.22 (1.09–1.37) | <0.001 |
| 20–<22 | 1.17 (1.07–1.28) | 0.001 | 1.26 (1.13–1.41) | <0.001 | 1.16 (1.04–1.30) | 0.008 |
| 22–<25 (ref.) | 1.0 | n/a | 1.0 | n/a | 1.0 | n/a |
| 25–<30 | 0.81 (0.75–0.88) | <0.001 | 0.74 (0.67–0.81) | <0.001 | 0.79 (0.71–0.87) | <0.001 |
| 30–<35 | 0.77 (0.70–0.84) | <0.001 | 0.69 (0.61–0.77) | <0.001 | 0.76 (0.67–0.86) | <0.001 |
| ≥35 | 0.61 (0.54–0.69) | <0.001 | 0.56 (0.48–0.65) | <0.001 | 0.60 (0.52–0.71) | <0.001 |
The association of adjusted serum creatinine with the waitlisted risk of death is shown in Figure 3 and Table 3. As shown in Table 3, compared to lowest adjusted serum creatinine quintile (reference), the case-mix and MICS adjusted death risk in wait-listed MHD patients with the 4th and 5th quintiles of adjusted serum creatinine were 25% and 43% lower (p < 0.001), respectively. Cubic spline analyses confirmed a linear association between lower adjusted serum creatinine values and higher death risk (Figure 3).
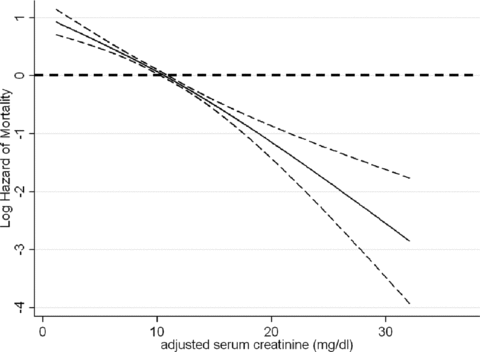
Hazard ratios (95% confidence intervals) of mortality across the adjusted serum creatinine variable, using Cox regression analyses in 11 346 long-term MHD-waitlisted patients who were observed over a 6-year observation period (7/2001–6/2007).
| Adjusted serum creatinine (mg/dL) | Minimally adjusted | Case-mix adjusted* | Case-mix and MICS adjusted** | |||
|---|---|---|---|---|---|---|
| HR (95% CI) | p-Value | HR (95% CI) | p-Value | HR (95% CI) | p-Value | |
| <7.3 | 2.60 (2.38–2.85) | <0.001 | 2.03 (1.81–2.27) | <0.001 | 1.51 (1.33–1.72) | <0.001 |
| 7.3–<9.3 | 1.52 (1.38–1.67) | 0.001 | 1.40 (1.25–1.56) | <0.001 | 1.24 (1.11–1.40) | <0.001 |
| 9.3–< 11.0 (ref.) | 1.0 | n/a | 1.0 | n/a | 1.0 | n/a |
| 11.0–<13.0 | 0.68 (0.60–0.75) | <0.001 | 0.77 (0.68–0.87) | <0.001 | 0.75 (0.66–0.86) | <0.001 |
| ≥13.0 | 0.45 (0.40–0.51) | <0.001 | 0.57 (0.50–0.66) | <0.001 | 0.57 (0.49–0.66) | <0.001 |
Examining the survival of the waitlisted MHD patients whose baseline dry weight changed over the upcoming 6 months, each 1 kg decrease in baseline dry weight was associated with a death hazard ratio of 1.06 (1.05–1.07), 1.06 (1.05–1.08) and 1.05 (1.04–1.06), in unadjusted and case-mix and MICS adjusted models (p < 0.001), respectively. Cubic spline models confirmed the aforementioned linear association (Figure 4). In change weight categorical analyses, compared to the patients with a relatively stable dry weight (weight change within ±1 kg over 6 months), the groups with 3–5 kg and more than 5 kg weight loss had 31% and 51% higher adjusted death risk, whereas patients who gained more than 5 kg weight reported 20% better survival (Table 4). Examining the mortality predictability of weight loss across different subgroups of patients, weight loss above 5 kg over 6 months was associated with elevated mortality risk in virtually all examined subgroups including those with a baseline >30 kg/m2 (Figure 5).
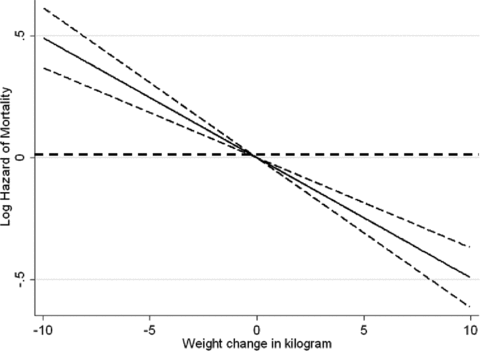
Hazard ratios (95% confidence intervals) of mortality across the weight change variable, using Cox regression analyses in 14 632 long-term MHD-waitlisted patients who were observed over a 6-year observation period (7/2001–6/2007).
| Change of weight | Minimally adjusted | Case-mix adjusted* | Case-mix & MICS adjusted** | |||
|---|---|---|---|---|---|---|
| HR (95% CI) | p-Value | HR (95% CI) | p-Value | HR (95% CI) | p-Value | |
| ≤(−5 kg) | 1.68 (1.48–1.90) | <0.001 | 1.71 (1.48–1.98) | <0.001 | 1.51 (1.30–1.75) | <0.001 |
| (−3 kg)–<(−5 kg) | 1.55 (1.36–1.76) | <0.001 | 1.50 (1.30–1.73) | <0.001 | 1.31 (1.14–1.52) | <0.001 |
| (−3 kg)–<(−1 kg) | 1.25 (1.13–1.38) | <0.001 | 1.20 (1.07–1.34) | 0.001 | 1.09 (0.97–1.22) | 0.136 |
| (−1 kg)–1 kg (ref.) | 1.0 | n/a | 1.0 | n/a | 1.0 | n/a |
| 1 kg–<3 kg | 0.98 (0.89–1.08) | 0.68 | 0.93 (0.83–1.04) | 0.20 | 0.91 (0.81–1.01) | 0.08 |
| 3 kg–<5 kg | 0.91 (0.79–1.04) | 0.16 | 0.83 (0.71–0.98) | 0.02 | 0.83 (0.71–0.98) | 0.02 |
| ≥ 5 kg | 0.93 (0.79–1.09) | 0.35 | 0.84 (0.70–1.00) | 0.06 | 0.80 (0.67–0.96) | 0.02 |
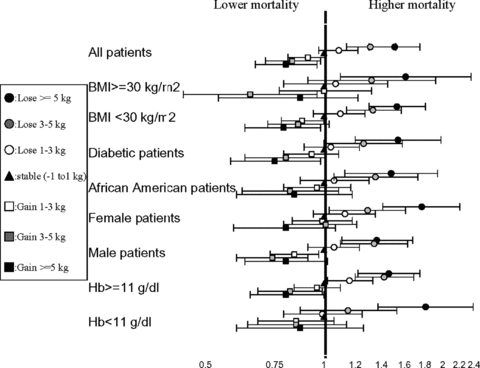
Hazard ratios (95% confidence intervals) mortality across the weight change variable, using Cox regression analyses in various subgroups of patients.
Examining the survival of the waitlisted MHD patients whose baseline adjusted serum creatinine changed over the upcoming 6 months, compared to the patients with a relatively stable adjusted serum creatinine ((−0.2)–1.2 mg/dL change over 6 months), the groups with 0.2–1 mg/dL and more than 1 mg/dL decreasing in adjusted serum creatinine had 27% and 38% higher adjusted death risk, whereas patients whose adjusted serum creatinine increased more than 2.4 mg/dL reported 13% better survival (Table 5). Cubic spline models confirmed the aforementioned linear association (Figure 6).
| Change of adjusted serum creatinine (mg/dL) | Minimally adjusted | Case-mix adjusted* | Case-mix and MICS adjusted** | |||
|---|---|---|---|---|---|---|
| HR (95% CI) | p-Value | HR (95% CI) | p-Value | HR (95% CI) | p-Value | |
| ≤(−1) | 1.17 (1.06–1.30) | 0.003 | 1.41 (1.26–1.58) | <0.001 | 1.38 (1.23–1.56) | <0.001 |
| (−1)–<(−0.2) | 1.16 (1.05–1.29) | 0.004 | 1.33 (1.19–1.49) | <0.001 | 1.27 (1.13–1.43) | <0.001 |
| (−0.2)–1.2 (ref.) | 1.0 | n/a | 1.0 | n/a | 1.0 | n/a |
| 1.2–<2.4 | 0.94 (0.84–1.05) | 0.255 | 0.97 (0.86–1.10) | 0.645 | 1.02 (0.89–1.15) | 0.812 |
| 2.4–< | 0.81 (0.72–0.91) | <0.001 | 0.85 (0.74–0.98) | 0.022 | 0.87 (0.75–0.99) | 0.045 |
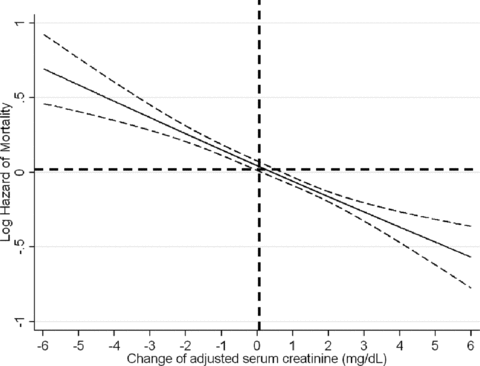
Hazard ratios (95% confidence intervals) of mortality across the change of adjusted serum creatinine variable, using Cox regression analyses in 11 346 long-term MHD-waitlisted patients who were observed over a 6-year observation period (7/2001–6/2007).
We examined the mortality predictability of combinations of dry weight and muscle mass (represented by adjusted serum creatinine) in our hemodialysis patients as shown in Figure 7. Low muscle mass combining with high body weight (high proportion of body fat) was associated with worse survival. High muscle mass with low body weight (low proportion of body fat) was associated with better survival (Figure 7). We examined the mortality predictability of combinations of concurrent changes in dry weight and muscle mass (represented by changes in adjusted serum creatinine) over the first 6 months in our hemodialysis patients as shown in Figure 8. Concurrent drop or rise in both dry weight and serum creatinine were associated with worse and better survival, respectively (Figure 8).
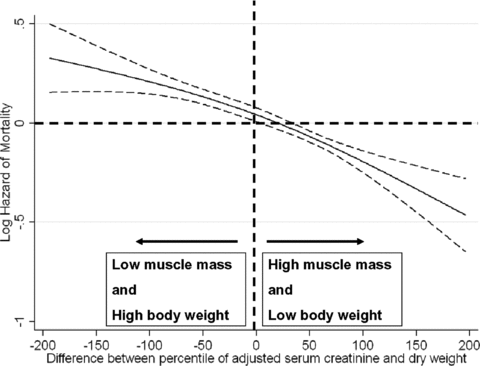
Cubic splines models of Cox proportional regression to examine the mortality predictability of the combinations of the dry weight and in adjusted serum creatinine levels over a 6-year observation period (7/2001–6/2007). The Y-axis shows the logarithm of the risk ratio of all-cause mortality over 6 years based on a multivariable Cox regression spline model, adjusted for case-mix. Dashed lines are 95% point wise confidence levels. Each patient received a percentile score between −100 and +100 according to the percentile rank of the change in dry weight or adjusted serum creatinine. The difference between adjusted serum creatinine concentration and dry weight in each patient also resulted in a number between −200 and +200.
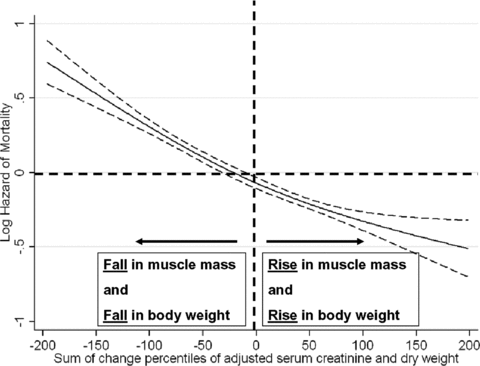
Cubic splines models of Cox proportional regression to examine the mortality predictability of the combinations of the changes in dry weight and in adjusted serum creatinine levels over a 6-year observation period (7/2001–6/2007). The Y-axis shows the logarithm of the risk ratio of all-cause mortality over 6 years based on a multivariable Cox regression spline model, adjusted for case-mix. Dashed lines are 95% point wise confidence levels. Each patient received a percentile score between −100 and +100 according to the percentile rank of the change in dry weight or adjusted serum creatinine. The sum of the two percentile scores for each patient resulted in a number between −200 and +200.
Higher BMI and weight gain were also associated with better survival when analyzed in our total population in competing risk regression analysis (Appendix Table A1), where transplantation was a competing event.
Discussion
In this historical prospective study of 14 632 waitlisted MHD recipients who were followed for up to 6 years, BMI showed an inverse association with mortality. High BMI, including extremely high BMI, was associated with better survival than normal or lower BMI. Additionally losing weight while on a transplant waiting list was inversely correlated with mortality, in that there was a 20% increased risk of death in patients who lost more than 5 kg, compared to patients who had a stable weight. The weight loss-mortality association was also observed in patients with a BMI above 30 kg/m2. Higher serum creatinine, a likely surrogate of larger muscle mass, is independently and incrementally associated with greater survival even after extensive multivariate adjustment for available surrogates of nutritional status and inflammation. Additionally, the patients with high muscle mass and low body weight reported the best survival. The concordant combination of the changes in these two body composition surrogates, if in the same direction, maintained the same graded death-predictability.
Obese ESRD patients who seek kidney transplantation are frequently advised to loose weight prior to transplant surgery (14). However, 40% of waitlisted patients died (5) while waiting for a deceased kidney as long as 3–6 years in most regions of the United State (3). Even though obesity is associated with deleterious outcomes in the general population, in MHD patients the association between BMI and mortality appears in the opposite direction, a phenomenon known as ‘obesity paradox’ or ‘reverse epidemiology’ (9–11,33). However, it is possible that healthier MHD patients such as the waitlisted population would not follow these counterintuitive associations. Our findings indicate that high BMI is associated with survival advantages even in the transplant-waitlisted MHD patients. Additionally, losing weight while awaiting transplantation was associated with an incremental drop in survival in the pretransplant period. This association was also present in obese MHD patients whose BMI is above 30 kg/m2 and in whom weight loss interventions may typically be recommended as a prerequisite for the transplant surgery.
The association between pretransplant (waitlisted) BMI and post-transplant outcomes is controversial. Previous reports have described conflicting associations between BMI and various post-transplant outcomes in kidney transplant recipients (18–21). Earlier studies in obese patients have shown higher risk of postoperative complications (16) including postsurgical wound infections (37). Lentine et al. reported higher incidence of cardiovascular (heart failure and atrial fibrillation) and early postoperative (wound infection or dehiscence) complications in obese patients (15). Moreover, weight changes prior to transplantation may be transient, as most patients especially those with large pretransplant weight declines often experience significant weight gain following surgery with a functional allograft (17). Hence a decrease in BMI before transplantation might not alleviate early risk after transplantation, while it may mitigate the risk of survival during the wait-listing period. Other studies did not find any association between pretransplant BMI and post-transplant outcomes (17, 38–40). Chang et al. (41) reported that obesity per se was not associated with poorer kidney transplant outcomes, although it was associated with factors that may lead to poorer graft and patient survival. Additionally, Zaydfudim et al. (42) reported that pretransplant overweight and obese status did not affect physical quality of life after kidney transplantation. A recent study suggested that significant decrease in BMI before transplantation had no positive effect on survival after transplantation (17).
Although BMI is often used as an indicator of nutritional status, it does not differentiate skeletal muscle mass from fat mass (43). A recent study in 792 hemodialysis patients found survival advantages of higher muscle mass (22). Hence, whereas higher BMI may be related to larger muscle mass, more body fat or both, it may be argued that if fat is good, muscle is better (44,45). In the present study, we found higher muscle mass before transplantation is a strong predictor of better outcomes. Given our present data indicating that high BMI and high muscle mass may be associated with greater survival in wait-listed patients, we suggest that high BMI itself should not be considered a contraindication for kidney transplantation.
The concept of the altered risk factor pattern or ‘reverse epidemiology’ as seen in the obesity paradox may appear counterintuitive, especially since obesity is an established risk factor for poor outcomes in the general population. Nonetheless, given the consistency of the observations, there must be conditions in these populations which render them more resistant to poor outcomes when high BMI is present. Several explanations have been suggested (46,47), including a more stable hemodynamic status in obese individuals (48), higher concentration of tumor necrosis factor alpha receptors in obesity (49), neurohormonal alterations of obesity (50), endotoxin-lipoprotein interaction (51), reverse causation (52), survival bias (53), time discrepancies among competitive risk factors (over- vs. under-nutrition) (53) and the overwhelming effect of malnutrition inflammation complex on traditional cardiovascular risks (54). Since the majority of MHD patients in the United States die within 5 years of commencing dialysis treatment (55), the long-term effects of conventional risk factors on future mortality must be overwhelmed by the short-term effects of these or other risk factors intrinsic to dialysis populations, such as under-nutrition and inflammation. Indeed, it may be that dialysis patients do not live long enough to die of the consequences of overnutrition, since they die much faster from protein-energy wasting (56–58). Hence, obesity, by proving more nutritional reserve, protects them against early death (10). Our study should be qualified for its observational nature. Weight loss may not be intentional, and our study cannot differentiate between intentional and spontaneous weight loss. Moreover, a major weakness of our study is that we are not aware of the potential reasons for weight loss or change such as intercurrent illness or interventions such as diet, exercise, weight loss medication or other. Like all observational studies, ours also cannot prove causality between predictors and outcomes. Another limitation in our study is that we are not aware if any specific selection criteria were varied across the transplant units and if specific reasons were given as to why patients did not receive kidney transplant during the 6 year follow up. Additionally, CRP is not available in our dataset, since it is not routinely measured in the U.S. dialysis patients. To the best of our knowledge our study is the first which describes an association between BMI, pretransplant serum creatinine and weight changes and survival in transplant-waitlisted MHD patients. Our study is notable for its large sample size, and extended numbers of important covariates accounted for in the multivariate analyses.
Conclusions
Low BMI or serum creatinine, as a surrogate marker of muscle mass and their decrease over time are associated with increased death risk in transplant-waitlisted MHD patients. A 20% higher death risk is observed in patients losing more than 5 kg of dry weight compared to patients with stable weight. Compared to the lowest serum creatinine quintile, the 4th and 5th quintiles had death HR of 0.75 (0.66–0.86) and 0.57 (0.49–0.66), respectively. Controlled trials are needed to examine the effects of intentional pretransplant weight loss on pre- and post-transplant outcomes.
Acknowledgment
The abstracts of this paper were presented orally during the American Society of Nephrology (ASN) annual conferences, November 2–7, 2009, San Diego, CA. We express our sincere appreciation to the teammates in nearly 1600 DaVita clinics who work every day, not only to take care of patients, but also to ensure the extensive data collection on which our work is based. We thank DaVita Clinical Research® (DCR) for providing the clinical data, analysis and review for this research project and for advancing the knowledge and practice of kidney care.
Funding source: The study was supported by Dr. Kalantar-Zadeh's research grants from the American Heart Association grant (0655776Y), the National Institute of Diabetes, Digestive and Kidney Disease of the National Institute of Health (R01 DK078106); a research grant from DaVita Clinical Research and a philanthropic grant from Mr. Harold Simmons. Additionally, Dr. Miklos Zsolt Molnar received grants from the National Research Fund (NKTH-OTKA-EU 7KP-HUMAN-MB08-A-81231), was also supported by the János Bolyai Research Scholarship of the Hungarian Academy of Sciences (2008–2011), and is a recipient of the Hungarian Eötvös Scholarship (MÖB/66-2/2010).
Conflict of Interest
The authors of this manuscript have conflicts of interest to disclose as described by the American Journal of Transplantation. Drs. Nissenson and Krishnan are employees of DaVita. Dr. Kalantar-Zadeh is the medical director of DaVita Harbor-UCLA/MFI in Long Beach, CA. Other authors have not declared any conflict of interest.
Appendix
For each analysis, three models were examined based on the level of multivariate adjustment:
- (I)
A minimally adjusted model that included mortality data, and entry calendar quarter (q1 through q20);
- (II)
Case-mix adjusted models that included all of the above plus age, gender, race and ethnicity (African Americans and other self-categorized Blacks, Non-Hispanic Whites, Asians, Hispanics and others), diabetes mellitus, categories of dialysis vintage (<6 months, 6 months–2 years, 2–5 years and ≥5 years), primary insurance (Medicare, Medicaid, private and others), marital status (married, single, divorced, widowed and other or unknown), the standardized mortality ratio of the dialysis clinic during entry quarter, dialysis dose as indicated by Kt/V (single pool), presence or absence of a dialysis catheter, and residual renal function during the entry quarter, i.e. urinary urea clearance and
- (III)
Malnutrition-inflammation-complex syndrome (MICS) adjusted models which included all of the covariates in the case-mix model as well as 10 surrogates of nutritional status and inflammation, including 11 laboratory variables with known association with clinical outcomes in HD patients: (1) serum albumin, (2) serum TIBC, (3) serum ferritin, (4) serum phosphorus, (5) serum calcium, (6) serum bicarbonate, (7) peripheral white blood cell count (WBC), (8) lymphocyte percentage, (9) hemoglobin and (10) nPCR as an indicator of daily protein intake, also known as the normalized protein nitrogen appearance (nPNA).
| Cox analysis | Competing risk | |||||
|---|---|---|---|---|---|---|
| Minimally adjusted | Case-mix adjusted* | Case-mix and MICS adjusted** | Minimally adjusted | Case-mix adjusted* | Case-mix and MICS adjusted** | |
| HR (95% CI) | HR (95% CI) | HR (95% CI) | SHR (95% CI) | SHR (95% CI) | SHR (95% CI) | |
| BMI (+1 kg/m2) | 0.969 (0.964–0.973) | 0.948 (0.943–0.953) | 0.964 (0.959–0.969) | 0.961 (0.956–0.966) | 0.937 (0.931–0.943) | 0.957 (0.953–0.961) |
| Weight change (+1 kg) | 0.991 (0.989–0.992) | 0.957 (0.948–0.967) | 0.969 (0.959–0.979) | 0.948 (0.937–0.958) | 0.949 (0.939–0.960) | 0.964 (0.953–0.975) |
- In the competing risk analyses the transplantation was defined as competing risk. All p values were lower than 0.001.


