Over-Expression of AIF-1 in Liver Allografts and Peripheral Blood Correlates with Acute Rejection after Transplantation in Rats
Abstract
Early and accurate detection of acute cellular rejection (ACR) is important in the management of liver allograft recipients. We hypothesized that expression of allograft inflammatory factor (AIF)-1 would be associated with liver allograft rejection as previous studies have shown that a relationship exists between kidney and heart transplantation. Indeed using rat orthotopic transplant models we found that the expression of allograft inflammatory factor-1 (AIF-1) can be detected in both allograft and peripheral blood leukocytes with peak levels detected 7 days following liver transplantation. Interestingly, AIF-1 expression increased 2-fold in acutely rejecting liver allografts compared to chronically accepted livers on days 5, 7 and 10 after transplantation. AIF-1 expression in peripheral blood leukocytes was also significantly greater in the rejection model than in the acceptance model. Flow cytometric analysis of peripheral blood leukocytes demonstrated that AIF-1 was expressed in ED2-positive cells, a marker for Kupffer cells. In vitro studies showed that AIF-1 expression in Kupffer cells was up-regulated by coculture with Th1 cytokines. However, neither LPS nor Escherichia coli (E. coli) administration had an affect on AIF-1 expression. These data indicate that high levels of AIF-1 expression reflect aggressive liver allograft rejection and suggest a role for monitoring AIF-1 in peripheral blood leukocytes as a monitor for increased immunosuppression.
Introduction
Early and accurate detection of acute cellular rejection (ACR) is important for the successful management of hepatic allograft recipients. Graft surveillance by protocol biopsy is the principal method for evaluating immunologic status. However, liver biopsy is an invasive procedure with recognized complications, and establishment of the diagnosis of cellular rejection remains elusive. A specific, reproducible, objective and rapid and quantitative marker is needed to detect the early development of ACR and manage immunosuppression.
Allograft inflammatory factor-1 (AIF-1) is a novel hydrophilic polypeptide, which functions across species barriers. AIF-1 was cloned from activated macrophages in human and rat allogeneic heart grafts undergoing chronic rejection. It is not present in normal or syngeneic cardiac grafts (1). Using immunohistochemical analyses it has been reported that AIF-1 is expressed in rat intestinal dendritic cells and Kupffer cells (KC). AIF-1 mRNA expression has also been demonstrated in human liver, colon, small intestine and atherosclerotic plaques (2,3). The expression of AIF-1 mRNA is increased in macrophages activated by interferon-γ (IFN-γ) (4), a cytokine released by Th1 cells, which mediate when the T-cell immune response is more aggressive. AIF-1 transcript levels are significantly decreased in allografted animals that receive immunosuppression (5). Thus, increasing evidence indicates there is a strong association between AIF-1 generation and a virulent allograft inflammatory process.
We hypothesized that increased expression of AIF-1 would be a biomarker for liver allograft rejection equivalent to the associations reported for heart (6) and kidney (7). To test this hypothesis, measurements of AIF-1mRNA and AIF-1 protein were made in rats receiving syngeneic liver grafts, grafts destined to be rejected and grafts accepted despite a MHC barrier.
Materials and Methods
Animals
Male Lewis (RT11) and DA (RT1ab) rats were purchased from Harlan Sprague-Dawley (Indianapolis IN,) and used at 8–12 weeks of age. The animals were maintained in a pathogen-free facility of The Johns Hopkins Medical Institutions. The animals were cared for according to the NIH guidelines and under a protocol approved by the Johns Hopkins University Animal Care Committee.
Orthotopic liver transplantation
Orthotopic liver transplantation (OLT) was performed as described by Kamada and Calne (8) with minor modifications. The hepatic artery was not reconstructed. Syngeneic liver transplantation was done with Lewis to Lewis, (OLTS); the chronic acceptance model used Lewis into DA, (OLTA); and the model of allograft rejection used DA into Lewis, (OLTR). Allograft survival was determined by recipient survival and rejection was confirmed histologically. We have reported that recipient rats in the rejection model died in about 2 weeks after transplantation (9). In contrast, the recipient rats in the syngeneic and acceptance models can survive for more than 1 year.
Administration of lipopolysaccharide or Escherichia coli (E. coli): Lipopolysaccharide (LPS) (4 mg/kg) (E. coli serotype 0111:B4) (Sigma, St. Louis, MO) suspended in saline was injected via the tail vein. E. coli (ATCC 25922) was obtained from ATCC (Rockville, MD), and rats were given intra-peritoneal injections of 1 mL of saline containing 6.5 × 10⁸ CFU of E. coli. Control animals received saline. Liver tissue and blood were collected from anesthetized rats at each time point after injection.
KC isolation
KC were isolated as described previously (10). Briefly, KCs were obtained by 0.05% collagenase perfusion of the liver, isopycnic sedimentation in two-step Percoll gradient (25% and 50% Percoll) and selective adherence of the cells to plastic flasks. This technique of cell isolation yielded, on average, 40–60 million KCs per liver, with 90–95% viability, as determined by trypan blue exclusion. The cells showed typical macrophage morphologic features, stained positively for non-specific esterase and both ED1 and ED2 (antibodies purchased from Serotec Inc, Raleigh, NC) and phagocytosed 1-μm Latex beads. Purity of the KC fraction was consistently greater than 95% determined by phagocytosed beads, and greater than 90% were positive for ED-2 by flow cytometry. Isolated KCs were cultured in RPMI 1640 medium with 10% fetal bovine serum (FBS) for 4 h, and then maintained in a medium containing 0.5% FBS for 12 h before stimulation.
Stimulation of KCs by concanavalin-A-activated T-lymphocytes
Suspensions of splenic cells were prepared by passage through a 50-μm stainless steel screen.
Erythrocytes were lysed with Tris–ammonium chloride. The remaining cell pellet was washed with media and further purified by passage over nylon wool columns (11). After a 1-h rest, the number of T-lymphocytes was activated by the addition of 2.5 μg/mL concanavalin-A (Con-A) and cultured at 37°C in an incubator with 5% CO2 for 48 h. KC (1 × 10⁵) prepared as seeded into the Millipore culture plate inserts (Millipore Corporation, Bedford, MA) and cultured with 5 × 10⁵ activated T-lymphocytes without changing the media were used during activation.
Stimulation of KC by beads, E. coli, lipopolysaccharide and several cytokines
Recombinant rat interleukin (IL)-2, interleukin (IL)-4, interleukin (IL)-10, IFN-γ and tumor necrosis factor-α (TNF-α) were purchased from BioSource International (Camarillo, CA). For stimulation, 1 × 10⁶ KCs were exposed to 1 × 10⁷ polystyrene beads (diameter 1.1 μm) (Sigma), 1 × 10⁷E. coli, 1 μg/mL LPS, 10 ng/mL IL-2, 10 ng/mL IL-4, 20 ng/mL IL-10, 10 ng/mL IFN-γ or 20 ng/mL TNF-α in 75 cm2 flask. The cultures were maintained for 6 h.
Reverse transcription-PCR analysis: Whole liver specimens were kept frozen at −80°C until homogenized for RNA extraction using a QIAamp Kit (Qiagen, Santa Clara, CA). For peripheral blood leukocytes the QIAblood Kit (Qiagen) was used. The manufacturer's instructions were followed. First-strand cDNA synthesis was then performed on 5 μg of total RNA using the Superscript First-Strand Synthesis system for RT-PCR (Invitrogen, Carlsbad, CA) according to the manufacturer's instructions. The sequences of the primer pairs used for the PCR are shown in Table 1. After a 5-min pre-denaturation step at 94°C, the reactions were cycled 27 (liver tissue and KCs) or 30 (blood) times for AIF-1, 30 times for ED2, 30 times for INF-γ, 30 times for TNF-α or 25 times for glyceraldehyde-3-phosphate-dehydrogenase (GAPDH), for 30 s each at 94°C, 58°C and 72°C. The final cycle was followed by a 3-min elongation step at 72°C. Amplified products were separated on 1.5% agarose gels and visualized with ethidium bromide staining. The intensity of each band was quantified using Scion Image software (Scion Corp, Frederic, MD) and used to quantify AIF-1, ED2, IFN-γ or TNF-α/GAPDH ratios.
| Primer name | Sequence (5′-3′) |
|---|---|
| AIF-1 FP | AGCCCAGCAGGAAGAGAGGT |
| AIF-1 RP | TGGGGGACCAGTTGGCTTCT |
| ED2 FP | TGGCTG GGGACGCCATAACT |
| ED2 RP | AGGGGCTGGCTTGTCTCTGT |
| INF-γ FP | CACGCCGCGTCTTGGTTTTG |
| INF-γ RP | CCTCGAACTTGGCGATGCTC |
| TNF-α FP | TCCAGAACTCCAGGCGGTGT |
| TNF-α RP | GGCAAATCGGCTGACGGTGT |
| GAPDH FP | CAGGGAAGATGGTGAGCATT |
| GAPDH RP | CTGCTCCTCTGTCATTTCAG |
- FP = forward primer, RP = reverse primer.
Western blot analysis
KC proteins were extracted, and whole cell extracts were subjected to 10% sodium dodecylsulphate-polyacrylamide gel electrophoresis. Resolved proteins were transferred to a nitrocellulose membrane and incubated with monoclonal anti-AIF-1 antibody (BMA Biomedicals, Augst, Switzerland) and followed with horseradish peroxidase-conjugated secondary antibody (Amersham Pharmacia Biotech, Piscataway, NJ) (1:1000). Peroxidase activity was visualized with the ECL kit (Amersham Pharmacia Biotech) according to the manufacturer's instructions.
Histopathological analysis
Cut sections were prepared from frozen tissue for ED2 staining or formalin-fixed paraffin-embedded tissues for AIF-1 and CD3 staining. Each representative section was stained with hematoxylin and eosin (HE), and immunohistochemical stains were performed with the avidin-biotin-peroxidase complex method, using Vectastain ABC kits (Vector Laboratories, Burlingame, CA). The following antibodies were used: monoclonal anti-AIF-1 antibody (BMA Biomedicals) (1:100); monoclonal anti-ED2 (Serotec Inc.) (1:100) and polyclonal anti-CD3 (Santa Cruz Biotechnology, Santa Cruz, CA) (1:100). The antibodies were incubated either at 4°C overnight (AIF-1 and CD3) or at room temperature for 2 h (ED2). For each liver, four fields were examined at 400× magnification and the number of AIF-1 or CD3-positive cells was counted. The results were then grouped to obtain the average for each sample. Double staining of AIF-1 and CD3 was also performed by immunofluorescent stains. The secondary antibody used was fluorescein isothiocyanate (FITC)-conjugated anti-mouse IgG (Jackson ImmunoResearch, West Grove, PA); cyanine 2-conjugated anti-goat IgG (Jackson ImmunoResearch) (1:500).
Flow cytometric analysis
Single-cell suspensions (2 × 10⁶) of peripheral blood leukocytes were prepared by Ficoll-hypaque (Sigma) density gradient and analyzed by three-color flow cytometry using a fluorescence-activated cell sorter (FACS) (BD Bioscience, San Jose, CA). The following antibodies were used in this study: Phycoerythrin-conjugated monoclonal anti-rat ED1 and ED2 (Serotec Inc.), FITC-conjugated monoclonal anti-rat RT1Aa,b (BD Bioscience), monoclonal anti-AIF-1 antibody (BMA Biomedicals) and PerCP-conjugated anti-mouse IgG2a+b isotype (BD Bioscience). These data were acquired and processed using CELL Quest software (BD Bioscience).
Analysis of alanine aminotransaminase and asparate aminotransaminase activity: Liver injury was estimated by measurement of serum alanine aminotransaminase (ALT) and asparat aminotransaminase (AST) levels using an automated enzyme assay.
Statistics
The results were expressed as mean values ± SEM of n-independent experiments. Analysis was performed by Student's t-test with p < 0.05 considered significant. The analysis was performed with StatView 4.5 statistical software (Abacus Concepts Inc. Berkeley, CA).
Results
AIF-1 mRNA expression in chronically accepted and acutely rejecting models of liver transplantation
AIF-1 mRNA was detected at low levels in non-transplanted DA and Lewis livers (Figure 1A). In the syngeneic liver transplantation model, AIF-1 mRNA expression was only slightly increased compared to non-transplanted livers, and reached a peak value at 3 days after transplantation. In contrast, AIF-1 mRNA expression increased in both acutely rejecting and chronically accepted liver allografts, peaking at 7 days after transplantation. However, AIF-1mRNA levels were twice as high in acutely rejecting liver allografts as in chronically accepted livers on days 5, 7 and 10 after transplantation (Figure 1B). AIF-1mRNA expression in liver allografts paralleled the expression of INF-γ mRNA, the level of which was also significantly greater in the rejection model compared to the acceptance model (Figure 1C). Serum levels of both ALT (Figure 1D) and AST (data not shown) were significantly increased at 3, 5, 7 and 10 days after liver transplantation. While there was no significant difference in serum ALT levels between rejecting and accepting models at 3, 5 and 7 days after transplantation, the serum ALT levels were 3–4 times higher in the rejecting model at 10 days after liver transplantation.
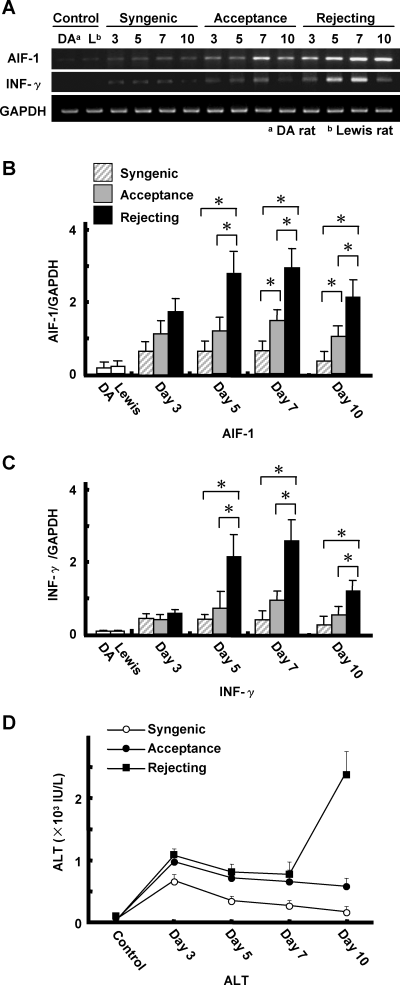
AIF-1, IFN-γ mRNA expression in liver grafts and serum ALT levels after transplantation. RT-PCR was performed on normal rat livers or liver grafts with AIF-1, INF-γ and GAPDH primers. Each lane represents RNA extracted and pooled from three samples (A). Plot of AIF-1 mRNA GAPDH mRNA ratios demonstrating the increases found in the rejecting hepatic allograft specimens, which peaked on day 7, and were significantly higher than in accepted allografts or syngeneic transplanted livers at days 5, 7 and 10 after transplantation. AIF-1 mRNA levels were greater in the acceptance model compared to the syngeneic transplant at days 7 and 10 after transplantation (*p < 0.05) (B). The INF-γ GAPDH mRNA ratios, paralleled AIF-1 mRNA expression (C). Serum ALT levels did not discriminate between accepting and rejecting until day 10 (D). Values are mean ± SEM of three or four samples.
The expression of AIF-1 protein in Kupffer cells and its association with increased T-cell infiltration in acutely rejecting liver allografts
To localize the expression of AIF-1 protein in transplanted hepatic allografts, liver tissues were analyzed by histology and immunostaining. Figure 2A shows a representative result in normal livers of immunohistochemistry staining for AIF-1 protein and ED2-positive cells, which label resident macrophages including Kupffer cells. AIF-1-positive cells were weakly scattered in the hepatic sinusoidal areas, and anti-AIF-1 staining was localized to ED2-positive Kupffer cells. In the acutely rejecting liver allografts 7 days after transplantation, massive mononuclear cellular infiltration was recognized in the portal areas with disruption of liver architecture (Figure 2B). However, similar findings were also present in the accepting liver (Figure 2C). In fact, the number of AIF-1-positive cells was equal. The major difference between the rejecting and accepting grafts was the increase of AIF-1-positive cells in the sinusoids (Figure 2B,C).
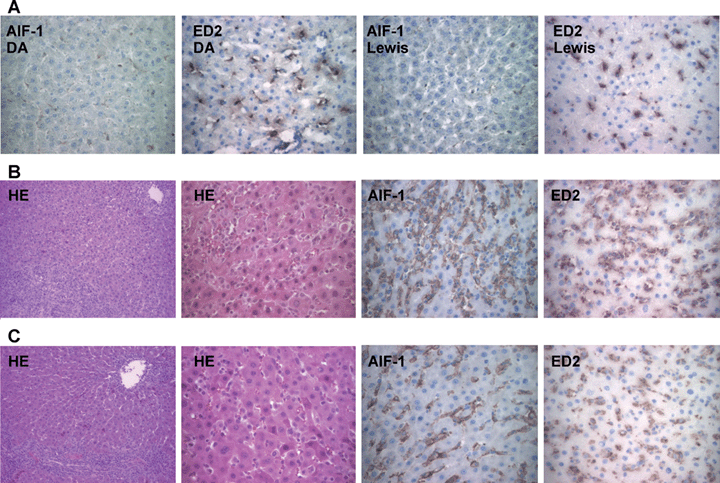
The histopathology and immunohistochemical staining of liver allografts. Non-transplanted livers. AIF-1-positive cells were weekly scattered in the sinusoidal areas of normal DA and Lewis livers, and AIF-1 staining occurred on ED2-positive cells. AIF-1 or ED2-positive cells show brown (A). Acute rejecting liver allografts 7 days post-OLT. HE staining shows mononuclear cellular infiltration in the expanded portal area and disruption of hepatic architecture. Immunohistochemical staining shows increased infiltration of AIF-1-positive cells in hepatic sinusoids compared with accepted liver allografts, and AIF-1 staining localized in ED2-positive cells (B). Accepted liver allografts 7 days post-OLT. HE staining shows expended portal area with inflammatory infiltration. Immunohistochemical staining shows increased number of AIF-1 and ED2-positive cells in hepatic sinusoids compared with non-transplanted livers (C). HE: original magnification, 100× or 250×. Immunohistochemistry: original magnification, 250×.
Immunofluorescence double staining (Figure 3A) and immunohistochemistry staining (Figure 3B) for AIF-1 and CD3 (which labels T cell) were performed to determine whether AIF-1 expression correlated with the infiltration of CD3 T cells in hepatic sinusoids. The number of AIF-1 and CD3-positive cells residing within sinusoids of accepting (n = 3) and rejecting liver allografts (n = 3) was counted and the results were averaged. AIF-1-positive cells and CD3-positive cells were significantly increased in a time-dependent fashion in hepatic sinusoids in acutely rejecting liver allografts after liver transplantation. The increased number of AIF-1-positive cells paralleled the increase in CD3-positive cells (Figure 3B). However, the number of AIF-1 and CD-3-positive cells was minimally increased in the accepting livers on day 3 and there was little increase on days 5, 7 and 10 post-transplantation. At these time points the numbers of AIF-1 and CD3-positive cells were two times greater in acute rejecting liver allografts than in chronically accepted liver allografts.
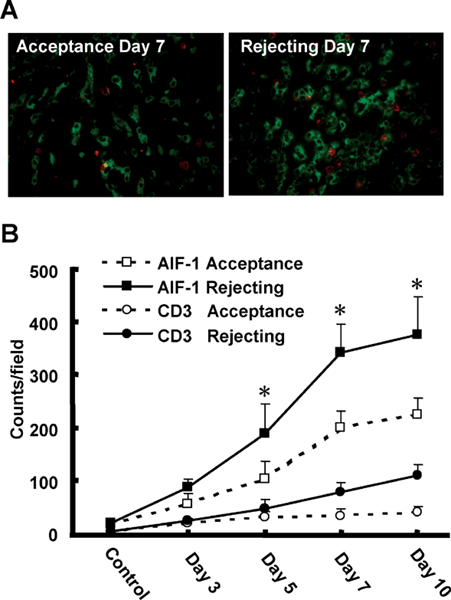
Analysis of AIF-1 and CD3-positive cells in liver allografts. Double immunofluoresence staining of AIF-1 and CD3 in allograft livers 7 days post-OLT. The left panel shows liver sections from accepted allografts, and the right panel shows liver sections from acute rejecting allografts. CD3-positive cells observed in sinusoidal areas were less abundant than were AIF-1-positive cells in both panels. Original magnification, 400× (A). Quantitative analysis of AIF-1 and CD3-positive cells in liver allografts. In each liver section, four parenchymal fields were examined at 400× magnification and the number of positive cells was counted. The number of AIF-1-positive cells in the rejecting hepatic allografts was increased on post-transplant days 3, 5, 7 and 10. In the accepted allografts, AIF-1 cells, although more abundant than in controls were strikingly less prevalent compared to the rejecting livers on days 5, 7 and 10 (*p < 0.05) (B). Values are mean ± SEM of 12 samples (4 from each of three livers).
Increased expression of AIF-1 in circulating peripheral blood macrophages correlated with acute rejection of liver allografts after transplantation
The expression of AIF-1 mRNA in peripheral blood cells derived from syngeneic and allogeneic liver transplantation models were measured by RT-PCR analysis. Figure 4A,B shows that the mRNA of AIF-1 can be detected at very low levels in peripheral blood cells derived from non-transplanted DA or Lewis rats. However, following allogeneic liver transplantation, the expression of AIF-1 mRNA was significantly increased in peripheral blood leukocytes, peaking 7 days after transplantation. The expression of AIF-1 mRNA in peripheral blood was significantly greater in the acutely rejecting model compared to the chronic acceptance model on days 5 and 7 after liver transplantation. ED2 mRNA levels in peripheral blood were also significantly increased after liver transplantation and paralleled the increase in AIF-1 mRNA expression (Figure 4C). Levels of mRNA of both AIF-1 and ED2 were significantly greater in the acute rejection model than in the acceptance model (Figure 4B,C).
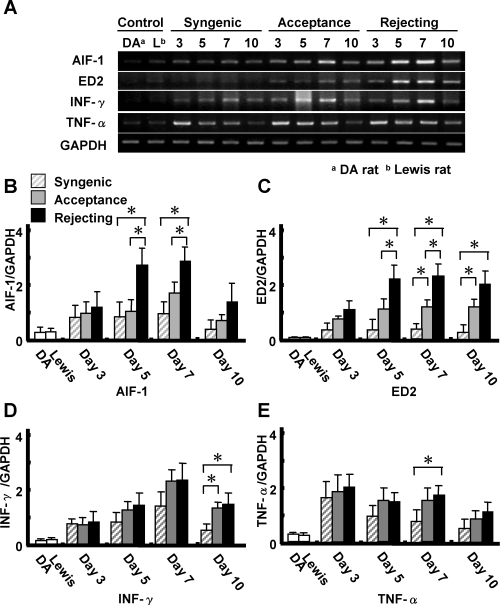
Expression of AIF-1, ED2, IFN-γ and TNF-α mRNA in peripheral blood cells after liver transplantation. RT-PCR was performed in peripheral blood cells with AIF-1, ED2, IFN-γ, TNF-α and GAPDH primers. AIF-1 mRNA was detectable at low levels in controls (A). AIF-1 mRNA levels in the rejection model was increased after transplantation, peaked on day 7 and were significantly higher than in the acceptance model on days 5 and 7 (*p < 0.05) (B). ED2 mRNA levels were also increased after liver transplantation and paralleled the increase in AIF-1 mRNA expression. ED2 mRNA levels in both rejection and acceptance models were greater than in the syngeneic transplantation model at 7 and 10 days after transplantation (C). IFN-γ mRNA levels in peripheral blood were significantly increased after transplantation, however, there was no significant difference between the rejection model and the acceptance model (D). TNF-α mRNA levels in peripheral blood were also significantly increased after transplantation, however, there was no significant difference between the rejection model and the acceptance model (E). Values are mean ± SEM of three or four samples.
While there was no difference in mRNA expression of AIF-1 between the accepting and syngeneic transplants, ED-2 expression was increased in the accepting model at 7 and 10 days after transplantation (Figure 4C). IFN-γ and TNF-α mRNA levels in peripheral leukocytes were also significantly increased after liver transplantation. However, there was no difference between the rejection model and acceptance model (Figure 4D,E). TNF-α mRNA levels in peripheral blood were higher in both allogeneic transplantation models compared to the syngeneic transplants on day 7 (Figure 4E). The difference between syngeneic and allogeneic IFN-γ mRNA levels was greatest at 10 days after transplantation (Figure 4D).
The phenotypes of AIF-1-positive cells were studied by flow cytometry using antibodies specific for AIF-1, ED1 and ED2. Kupffer cells are ED1- and 2-positive while ED1 is a marker for circulating monocyte/macrophages. Figure 5 shows few AIF-1 and ED2-positive cells in peripheral blood in normal DA or Lewis rats (Figure 5A). On 7 days after liver transplantation, the number of both AIF-1+ED1+ and AIF-1+ED2+ cells was increased. Interestingly, most of the ED2-positive cells expressed AIF-1, and only a small portion of ED1-positive cells expressed AIF-1. The number of AIF-1-positive cells in peripheral blood (Figure 5C) was two times greater in the acutely rejecting model than in the chronic acceptance model (Figure 5B). These results indicate that AIF-1 expression in peripheral blood macrophages was significantly increased in the acute rejecting model of liver transplantation.
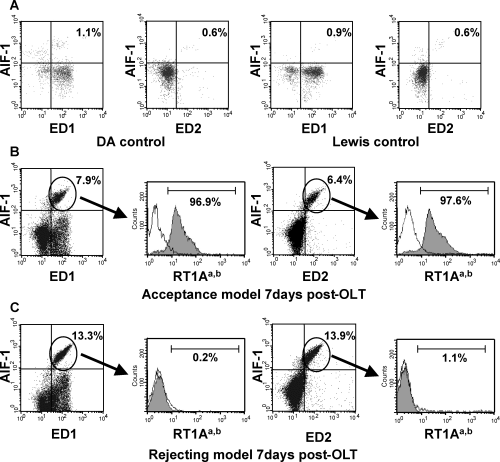
Flow cytometric analysis of AIF-1-positive cells in peripheral blood. Peripheral blood was collected via tail vein 7 days after liver transplantation. In parallel, peripheral blood monocytes were analyzed by three-color flow cytometry using anti-AIF-1, anti-ED1, anti-ED2 and anti-RT1Aa,b (anti-DA MHC-1) antibodies. Peripheral blood cells from non-transplanted DA or Lewis rats showed few AIF-1+ cells (A). Peripheral blood cells from recipients in the acceptance model (Lewis into DA) on day 7 after liver transplantation displayed abundant AIF+ ED1+ and ED2+ cell of host phenotype (B). Peripheral blood cells from recipients in the rejection model (DA into Lewis) on day 7 after liver transplantation, which failed to show the AIF-1, ED1+ ED2+ cells as belonging to the graft (C).
The origin of these AIF-1-positive cells was studied using anti-DA rat MHC-I antibody (RT1Aa,b) staining. Figure 5B shows that AIF-1+ED1+ or AIF-1+ED2+ cells in peripheral blood recovered from the acceptance of the allogeneic liver transplantation model (Lewis into DA) stained positive for RT1Aa,b. In contrast, AIF-1+ED1+ or AIF-1+ED2+ cells recovered from the acute rejecting model (DA into Lewis) were RT1Aa,b-negative (Figure 5C). These results suggest that after liver transplantation the majority of AIF-1-positive cells in peripheral blood are recipient-derived macrophages. Since the majority of AIF-1-positive cells was ED2 cells, recipient-derived macrophages in peripheral blood destined to become ‘resident‘ may be the principal source of increased expression of AIF-1.
Increased expression of AIF-1 in KC is induced by Th1 cytokines, and is not affected by LPS or phagocytosis
To elucidate the potential mechanisms, which might contribute to the stimulation if AIF-1 in acutely rejecting hepatic allografts, we determined whether AIF-1 expression in KCs, the major population of hepatic resident macrophages, was up-regulated by T-cell-derived cytokines in vitro. Figure 6A shows that AIF-1 mRNA was detectable at low levels in cultured KCs controls. AIF-1 mRNA levels were significantly increased 3 and 6 h after KC were non-contact cocultured with Con-A-activated T cells. Western blot analysis (Figure 6B) shows that AIF-1 protein levels were also remarkably increased 12 h after KC were non-contact cocultured with activated T cells. We then determined whether specific T-cell cytokines can up-regulate AIF-1 mRNA expression in KC. Figure 6C shows that AIF-1 expression in KCs was significantly increased in the presence of IL-2 or INF-γ. However, IL-4, IL-10 or TNF-α had no affect on KC AIF-1 mRNA expression. These results suggest that AIF-1 expression in KCs was up-regulated preferentially by Th1-derived cytokines. Finally, we determined whether AIF-1 expression was stimulated by KC activation secondary to phagocytosis of bacteria or LPS exposure. Figure 6D shows that beads, E. coli and LPS failed to change KC AIF-1 mRNA expression.
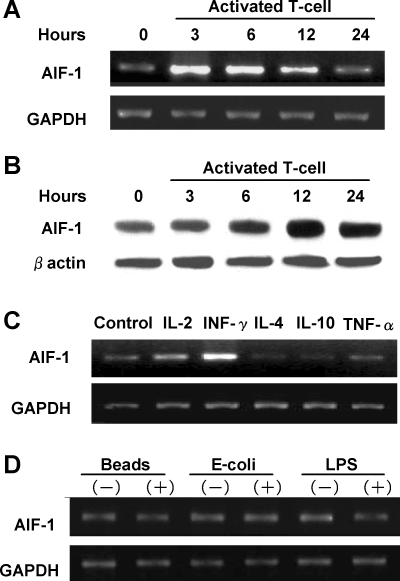
Up-regulation of AIF-1 expression in KC. AIF-1 mRNA expression in KC cocultured without contact with con-A-stimulated activated T cells for 3, 6, 12 and 24 h. Control samples remained untreated. KC AIF-1 mRNA was increased after 3 and 6 h compared with controls but decreased thereafter (A). AIF-1 expression in KC cocultured with activated T cells analyzed by Western blot. AIF-1 protein levels were increased significantly after 12 h (B). Cytokine-induced AIF-1 expression in KC. KC were stimulated with IL-2 (10 ng/mL), INF-γ (10 ng/mL), IL-4 (10 ng/mL), IL-10 (20 ng/mL) or TNF-α (20 ng/mL) for 6 h. INF-γ and IL-2 were capable of inducing AIF-1 mRNA, whereas IL-4, IL-10 and TNF-α had no significant effect (C). Effects of phagocytosis of polystyrene beads or E. coli and LPS exposure on AIF-1 expression in KC. KC were cocultured with polystyrene beads (1 × 10⁷, diameter 1.1 μm), E. coli (1 × 10⁷) or LPS (1μg/mL) for 6 h. AIF-1 mRNA expression was quantified by RT-PCR. AIF-1 expression in KC was not altered under these conditions (D).
Administration of LPS or E. coli does not alter AIF-1 expression in the liver and peripheral blood: To determine whether AIF-1 expression can be altered by non-rejection inflammatory states in vivo, we measured AIF-1 mRNA expression in animals treated by the administration of either LPS or E. coli. The administration of LPS or E. coli had no significant effect on AIF-1 mRNA levels in liver (Figure 7A) and peripheral blood leukocytes (Figure 7B).
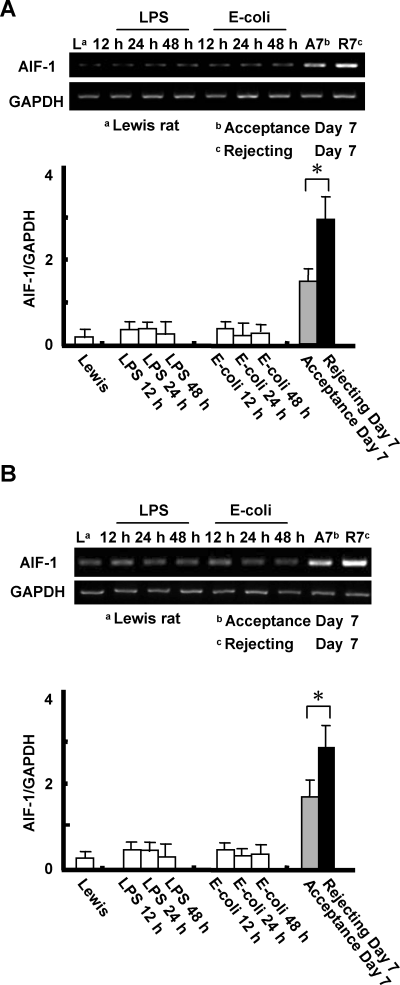
Effect of LPS or E. coli administration on AIF-1 expression in the liver and peripheral blood. LPS (4 mg/kg) was injected via tail vein and E. coli (6.5 × 10⁸ CFU) were administrated by intra-peritoneal injection. Liver tissues and blood were collected at various time points after injection. There was no significant effect noted. AIF-1 mRNA expression in the liver tissues (A). AIF-1 mRNA expression in peripheral blood. By comparison the levels of mRNA in transplant models are also shown to demonstrate the striking difference (B). Values are mean ± SEM of three or four samples.
Discussion
AIF-1 expression has been correlated with renal (7) and cardiac allograft rejection (6). Autieri et al. (6) studied 157 myocardial biopsies and correlated the mRNA ratios of AIF-1/GAPDH with standard rejection grades. There was a highly significant correlation. Moreover, persistent expression heralded coronary arterial disease. Although now recognized to be a part of the aggressive allograft response, AIF-1 has also been found in human atherosclerotic plaques, and in vitro studies have shown its ability to stimulate smooth muscle cell proliferation (12). The role of AIF-1 has not been elaborated in liver transplant rejection, which provided the impetus for the studies we report. Protein and mRNA expression was evaluated in three models of transplantation in the rat: an acutely rejecting DA to Lewis combination, an accepting Lewis to DA combination and a syngeneic Lewis to Lewis combination. Our aim was to determine whether measurements of AIF-l protein and/or mRNA would discriminate between the trauma of the transplant, a reversible rejection and an irreversible rejection.
We found very few cells positive for AIF-1 mRNA in the normal or syngeneic liver transplants. AIF-1 mRNA was increased significantly in both accepting and rejecting livers. However, in rejecting livers mRNA AIF-1 levels were four times greater than in the syngeneic transplants and double that found in the grafts, which were accepted (Figure 1B). INF-γ mRNA levels paralleled AIF-1 levels. Histochemical stains identifying the AIF-1 protein demonstrated equivalent numbers of AIF-1+ cells in the inflamed portal areas, but striking differences in the sinusoids (Figure 2) where there were also increased numbers of KC-like cells (ED2+). Direct counting (Figure 3B) of cells in the liver parenchyma showed that AIF-1+ cells were more prevalent in the rejecting grafts than in the accepting grafts, and the numbers were four times greater than infiltrating lymphocytes (CD3+). Administration of LPS and E. coli failed to increase AIF-1 mRNA (Figure 7). These findings make a strong case that an expanded population of KC are producing AIF-1, and that the quantity of these cells influences the outcome of liver transplants in this rat model.
Also noteworthy was the finding that the expression of AIF-1mRNA and ED2 mRNA found in the liver parenchyma was reflected in peripheral blood leukocytes. Levels of mRNA peaked at day 7 and were significantly higher in the rejecting than in the accepting models. Levels of mRNA specific for TNF-α and IFN-γ did not discriminate between the accepting and rejecting grafts. When cells were sorted by ED2 or AIF-1 phenotype by FACS and studied for donor or host origin, the results were unequivocal (Figure 5B,C) demonstrating the host origin of these cells.
The specificity of AIF-1 activation was studied further in vitro with cultured KCs (Figure 6). The supernatant from Con-A stimulated T cells, IL-2 and IFN-γ stimulated mRNA AIF-1 production. Cultures containing IL-4, IL-10, TNF-α, polystyrene beads and E. coli failed to stimulate mRNA production.
In contrast to heart transplants where AIF-1 production has a logical role in the etiology of chronic coronary vascular disease by means of its ability to cause smooth muscle proliferation (12,13), the causal relationship between our finding of increased numbers of sinusoidal macrophages making AIF-1 and acute liver rejection is obscure. It is likely that the quantity of these interesting cells marks an aggressive immune response. Finding large numbers of these cells of host origin in the peripheral blood coinciding with their appearance in the liver suggests host-to-donor traffic and raises interesting questions about their fate in the acceptance model, which at this point are open only to speculation.


