Melatonin ameliorates methionine- and choline-deficient diet-induced nonalcoholic steatohepatitis in rats
Abstract
Abstract: Nonalcoholic steatohepatitis (NASH) may progress to advanced fibrosis and cirrhosis. Mainly, oxidative stress and excessive hepatocyte apoptosis are implicated in the pathogenesis of progressive NASH. Melatonin is not only a powerful antioxidant but also an anti-inflammatory and anti-apoptotic agent. We aimed to evaluate the effects of melatonin on methionine- and choline-deficient diet (MCDD)-induced NASH in rats. Thirty-two male Wistar rats were divided into four groups. Two groups were fed with MCDD while the other two groups were fed a control diet, pair-fed. One of the MCDD groups and one of the control diet groups were administered melatonin 50 mg/kg/day intraperitoneally, and the controls were given a vehicle. After 1 month the liver tissue oxidative stress markers, proinflammatory cytokines and hepatocyte apoptosis were studied by commercially available kits. For grading and staging histological lesions, Brunt et al.’s system was used. Melatonin decreased oxidative stress, proinflammatory cytokines and hepatocyte apoptosis. The drug ameliorated the grade of NASH. The present study suggests that melatonin functions as a potent antioxidant, anti-inflammatory and antiapoptotic agent in NASH and may be a therapeutic option.
Introduction
Nonalcoholic steatohepatitis (NASH) is a chronic disorder that is increasingly recognized as being very common. NASH has a potential to progress to advanced fibrosis and cirrhosis. A proven medical treatment for NASH, prior to cirrhosis, is not available. Oxidative stress, excessive hepatocyte apoptosis and toxins are implicated as the main factors in the pathogenesis of progressive NASH [1–3].
Steatosis, as the first-hit, is an early component in the pathogenesis of NASH. Oxidative stress and mitochondrial damage are implicated later in the pathogenesis to initiate inflammation, as the second-hit. Current data underline the importance of free radical damage in the pathogenesis of NASH [1–4]. It is well known that hepatic and plasma inflammatory and oxidative stress-related parameters are correlated with clinical and histological findings. Treatment approaches that improve the oxidant status may have beneficial effects in NASH pathology [3–6].
Melatonin (N-acetyl-5-methoxytryptamine), a secretory product of the pineal gland is a powerful endogenous antioxidant. Exogenous application of this molecule leads to a remarkable decline in oxidative stress by directly neutralizing the hydroxyl radicals. In addition, melatonin is also indirectly effective by enhancing the levels of potential antioxidants such as glutathione peroxidase, superoxide dismutase (SOD), and glutathione (GSH) [7, 8].
The cytostatic effect of melatonin is due to its ability to inhibit cell proliferation. This feature may also lead to an inhibition of inflammation, apoptosis, and oxidative stress caused by polymorphonuclear leukocytes. Melatonin also preserves the integrity of the mitochondria and helps to maintain cell functions and survival [7, 9]. Melatonin has been widely used as a protective agent against a wide variety of processes such as aging, cancer and also liver diseases [10]. In this study, the effect of melatonin on methionine- and choline-deficient diet (MCDD)-induced NASH in rats was evaluated as a new therapeutic choice.
Materials and methods
The study was approved by the Animal Research Review Committee of Marmara University School of Medicine, Istanbul, Turkey.
Materials
The pelleted MCDD and the MCDD supplemented with choline bitartrate (2 g/kg) and dl-methionine (3 g/kg) (control diet) were custom-made by Harlan Teklad (Madison Ltd, Madison, WI, USA). Melatonin was supplied by Sigma Chemical Co. (Deisenhofen, Germany). Cytokine kits [enzyme-linked immunosorbent assay (ELISA), rat interleukin (IL)-1β and tumor necrosis factor (TNF)-α; R&D Systems Europe, Oxfordshire, UK; ELISA, rat IL-6; Diaclone Research, Besancon, France], superoxide dismutase (SOD) kit (Randox-Ransod, Crumlin, Co. Antrim, UK), TdT-nitric acid, perchloric acid (Merck, Darmstadt, Germany), FragEL™ DNA Fragmentation Detection Kit (Calbiochem, San Diego, CA, USA), were all purchased.
Animals
Thirty-two male Wistar rats, between 12 and 14 weeks of age and weighing 190–270 g, were obtained from Marmara University Animal Research Laboratory. The animals were kept at a constant temperature (22 ± 1°C) under a 12-hr light/dark cycle, in the same unit. All animals received humane care in compliance with the National Institutes of Health criteria for laboratory animals. All rats were weighed at the same time, and food and water were monitored daily throughout the study period. Control-diet groups were pair-fed to match the food intake of the MCDD-fed groups. Rats had free access to water.
Study groups and design
Two groups of rats were fed MCDD for 4 weeks, while control rats were pair-fed with an identical diet to which choline bitartrate and methionine were added [11]. Of each of the diet groups one was administered melatonin 50 mg/kg/day intraperitoneally, and the controls were given a vehicle. The four groups were as follows: (1) the saline group was given a control diet and injected saline (n = 8); (2) the melatonin group was injected melatonin, fed with control diet (n = 8); (3) the MCDD group was fed with MCDD, injected saline (n = 8); and (4) the MCDD + melatonin group was injected melatonin, fed with MCDD (n = 8).
After an overnight fast, the animals were weighed and killed at the end of week 4. Serum samples were obtained by centrifugation of trunk blood (4024 g, 10 min, 4°C). The livers and spleens were removed and weighed. After sampling for histological assessment, livers were snap-frozen in liquid nitrogen. Serum and liver samples were stored at −80°C for laboratory assays.
Tissue homogenization
Liver samples were weighed and homogenized in 0.15 m NaCl to determine reactive oxygen species (ROS). The liver tissue homogenates were diluted with 0.15 m NaCl up to 20%. Tissue homogenates were sonicated two times for 30-s intervals at 4°C. After sonication, homogenates were centrifuged at 4024 g for 10 min or at 20,124 g for 15 min. Aliquots of the supernatants were used for studies. Protein content of the tissue aliquots was determined by the method of Lowry et al. [12].
Biochemical parameters
Plasma levels of alanine transaminase (ALT), aspartate transaminase (AST), alkaline phosphatase (ALP), bilirubin, total cholesterol, and triglyceride were determined spectrophotometrically with a Roche 917 R autoanalyzer (Roche, Boehringer, Mannheim, Germany) using commercial kits.
Oxidative stress parameters
Measurements of thiobarbituric acid-reactive species (TBARS) were performed according to Yagi [13]. Liver tissues were homogenized in icy trichloroacetic acid (TCA) (10%) solution and then centrifuged. The superficial liquid portion was mixed with equal volume of TBARS (0.67%) and heated at 90°C for 15 min. TBARS were measured according to absorbance at 532 nm and expressed as nmol/100 mg protein. Glutathione levels were measured spectrophotometrically using 5,5′-dithio-bis-2-nitrobenzoic acid method [14]. Results were calculated as mg/g protein. SOD levels were measured by using commercial kits (Randox-Ransod, Crumlin, Co., Antrim, UK) and expressed as U/100 mg protein.
Cytokine tests
Rat serum TNF-α, IL-1β and IL-6 levels were analyzed with commercially available enzyme immunoassay kits. Analyses of all samples, standards, and controls were run in duplicate. The principal methodology for this immunoassay was the same for all cytokines. Analyses of all samples, standards, and controls were run in duplicate. The coefficients of intra- and interassay variations for TNF-α, IL-1β, and IL-6 were 4.2%/6.7%, 4.1%/7.9%, and 4.0%/6.9% (n = 10), respectively.
Histopathology
Samples for histological evaluation were obtained from the left and right lobe of each rat liver in a standard way. Histopathological examinations were performed blinded. Using light microscopy, a single pathologist graded the necroinflammation and steatosis levels from sections of formalin-fixed, paraffin-embedded samples that were stained with H&E and periodic-acid Schiff with diastase. Masson’s trichrome and Gomory’s reticulin stains were analyzed for fibrosis and architectural changes. For grading and staging the histological lesions, the modification system of Brunt et al. was used [15]. Lobular inflammation grade was determined semiquantitatively by counting the inflammatory foci per 20 high-power fields (HPF) (20×) with a 20× ocular (0 or 1, 1 or 2/20×; 2, ≤4/20×; 3, >4/20×) of a light microscope in H&E-stained tissue specimens [15]. Additionally, necroinflammation was quantified histologically by counting inflammatory foci, arbitrarily defined as groups of five or more leukocytes in 20 consecutive HPFs (40× objective), and this value gave the inflammatory rate. After counting the number of inflammatory cells within each inflammatory focus, we determined the activity of inflammation by taking the average of inflammatory cells per inflammatory foci. The rate of steatosis was determined quantitatively as the ratio of lipid-laden hepatocytes to total hepatocytes counted in three hepatocyte plates from the portal to the central zone in three different areas. The overall grade of steatohepatitis was determined by considering the rate of steatosis and the grade of portal and lobular inflammation.
Determination of apoptosis
DNA fragmentation was detected by the labelling of DNA breaks in apoptotic nuclei in paraffin-embedded tissue sections using a TdT-FragEL™ DNA fragmentation detection kit (Calbiochem®) [16]. Labelled cells were counted in six HPF, three periportal and three pericentral; and apoptotic index is given as the labelled cells per one HPF (400×).
Statistical analysis
All results are expressed as mean ± standard errors. Numerical data were analyzed by Kruskal–Wallis test. Significant differences revealed by multigroup comparisons were further analyzed by Dunn’s test. Nominal data were analyzed by chi-squared test or Fisher’s exact test with Yates correction. P-values <0.05 were accepted as significant.
Results
Melatonin lowered AST, ALT and ALP levels in the MCDD + melatonin group compared with the MCDD group (Table 1). Total bilirubin and albumin levels of the groups were not statistically different. The mean liver malondialdehyde (MDA) levels of the MCDD-treated rats were significantly higher than those in the MCDD + melatonin animals; they were also higher than levels in the saline- and melatonin-injected animals (Fig. 1). The mean hepatic GSH and SOD levels of MCDD rats were significantly lower than the MCDD + melatonin-, saline-, and melatonin only-injected rats (2, 3).
| Saline | Melatonin | MCDD | MCDD + melatonin | P | |
|---|---|---|---|---|---|
| AST (U/L) | 171 ± 10 | 158 ± 17 | 311 ± 25 | 176 ± 13 | <0.01 |
| ALT (U/L) | 43 ± 3 | 47 ± 4 | 155 ± 21 | 101 ± 9 | <0.01 |
| Alkaline phosphatase (U/L) | 520 ± 43 | 532 ± 32 | 1327 ± 161 | 805 ± 118 | <0.01 |
| Total bilirubin (mg/dL) | 0.13 ± 0.01 | 0.12 ± 0.01 | 0.14 ± 0.02 | 0.13 ± 0.02 | >0.05 |
| Albumin (g/dL) | 3.8 ± 0.7 | 3.9 ± 0.7 | 3.8 ± 0.7 | 3.9 ± 0.7 | >0.05 |
- Values are given as mean ± standard error.
- MCDD, methionine- and choline-deficient diet.
- Plasma AST, ALT and alkaline phosphatase levels in the MCDD fed rats were significantly higher than the MCDD + melatonin (P < 0.05) treated rats, the saline rats and the melatonin rats (P < 0.01, for both).
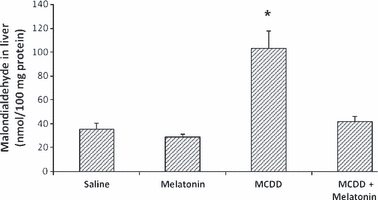
Tissue malondialdehyde levels. Results are mean ± standard errors. *P < 0.001 versus other three groups (MCDD, methionine- and choline-deficient diet).
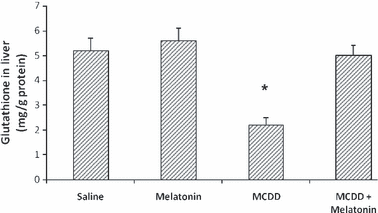
Tissue glutathione levels. Results are mean ± standard errors. *P < 0.001 versus other three groups (MCDD, methionine- and choline-deficient diet).
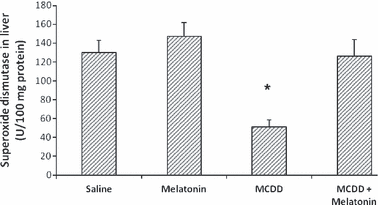
Tissue superoxide dismutase levels. Results are mean ± standard errors. *P < 0.001 versus other three groups (MCDD, methionine- and choline-deficient diet).
The mean IL-1β, IL-6, and TNF-α levels of the MCDD rats were significantly higher than in the MCDD + melatonin-, the saline-, and melatonin only-treated rats (Fig. 4). The saline and melatonin groups had normal liver histological findings (Fig. 5A). MCDD caused prominent steatohepatitis in the untreated MCDD group. In both studies, administration of MCDD alone led to grade 3 liver steatosis. Panacinar steatosis with extreme mononuclear inflammation foci was prominent in the MCDD group. Melatonin treatment improved inflammation in MCDD-induced NASH. The MCDD + melatonin group showed steatosis in zone 3 and rare inflammatory foci scored as grade 2 steatohepatitis (Fig. 5B,C). The median inflammatory foci and total inflammatory cells in the MCDD versus MCDD + melatonin groups were 2 versus 1 (P = 0.01) and 29 versus 5.1 (P < 0.01) in the study, respectively. Mason’s trichromium staining did not reveal any fibrosis in the study.
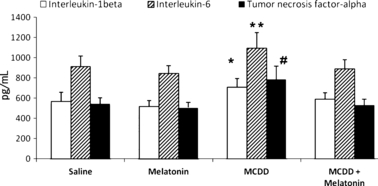
Serum cytokine levels. Results are mean ± standard errors. *P < 0.001 versus other three groups, **P < 0.01 versus other three groups; #P < 0.001 versus other three groups (MCDD, methionine- and choline-deficient diet).
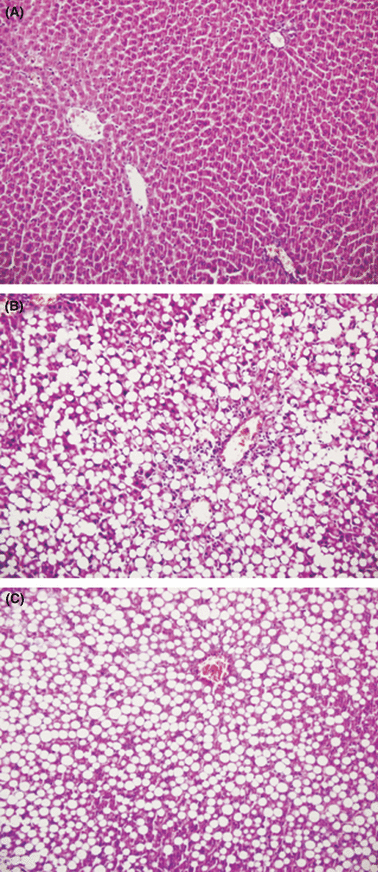
Normal liver architecture in the saline and melatonin groups (A). Methionine- and choline-deficient diet (MCDD)-induced nonalcoholic steatohepatitis (NASH) in the liver (B). There is panacinar steatosis with extreme mononuclear inflammation foci scored as grade 3 steatohepatitis in the MCDD group (HE, 100×) (B). Melatonin improved inflammation in MCDD-induced NASH. This figure shows steatosis in zone 3 and rare inflammatory foci scored as grade 2 steatohepatitis in the MCDD + melatonin group (HE, 100×) (C).
Methionine- and choline-deficient diet feeding increased the number of TUNEL-positive cells significantly (P < 0.001, 6, 7). The apoptotic index was prominent mainly in zone 3 in the MCDD group. Melatonin decreased the number of TUNEL-positive cells significantly in liver specimens in the MCDD + melatonin group when compared with the MCDD group (P < 0.01, 6, 7).
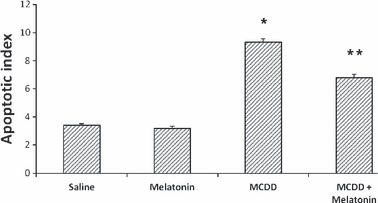
Tissue apoptotic index levels. Results are mean ± standard errors. *P < 0.001 versus other three groups, **P < 0.05 versus the saline and melatonin groups (MCDD, methionine- and choline-deficient diet).

Melatonin decreased hepatocyte apoptosis in the nonalcoholic steatohepatitis model. TUNEL-positive hepatocytes with markedly brown pyknotic nuclei (brown dot) showed apoptosis in the liver sections. The saline and melatonin groups (A), the methionine- and choline-deficient diet (MCDD) group (B), the MCDD+ melatonin group (C) (magnification 400×).
Discussion
Nonalcoholic steatohepatitis is a chronic disorder that is increasingly recognized as being very common. The current pathogenesis of NASH involves the two-hit hypothesis. In this theory, an initial metabolic disturbance causes steatosis, and the second pathogenic stimulus such as free radical damage, lipid peroxidation, toxins and cytokines triggers inflammation and drives progression to NASH [1, 17]. Although simple steatosis does not carry a clear risk, steatohepatitis has a risk of progressive liver disease. In our previous studies, we observed that, some diet models cannot equally reproduce the steatosis and inflammation of NASH [18]. However, MCDD feeding has been a very reliable and equally reproducible method of NASH development [2, 3, 19, 20].
Currently there is no proven medical treatment for NASH. Certain antioxidants such as vitamin E and N-acetylcysteine have been reported to have beneficial effects mainly in reducing serum transaminases in patients with NASH [5, 6]. In our previous study, we reported protective effects of melatonin against liver injury in experimental animals induced by dimethylnitrosamine [7]. The role of melatonin in improving liver damage relates basically to direct free-radical scavenging [21] and also regulation of gene transcription for antioxidant enzymes [22]. Melatonin has been found to possess higher antioxidant efficiency than vitamin E and GSH, which are known as powerful antioxidants [23, 24]. In this study we tested the hypothesis that melatonin ameliorates NASH in animal model.
In the current study, 4 weeks of MCDD feeding caused an equally comparable NASH pathology in the study animals. Up to 66% of hepatocytes were affected by steatosis and the inflammation was moderate in the lobular zone in accordance with our previous studies [2, 3, 19, 20], and those of others [11, 25, 26]. The mechanism of liver injury induced by MCDD feeding was found to be strongly related to increased oxidative stress, proinflammatory cytokines and proapoptotic factors. These factors may cause further impairment of mitochondrial oxidation by opening of the mitochondrial permeability transition pores and may ultimately lead to tissue damage and cell death [27, 28]. Markedly increased serum AST, ALT, ALP, proinflammatory cytokines, liver tissue oxidative stress and apoptotic index parameters were used as evidence of liver damage in the study.
Daily single injections of melatonin improved steatohepatitis, decreased apoptosis and cell injury in male rats within 4 weeks of MCDD feeding. Furthermore, melatonin ameliorated liver enzymes and decreased pre-inflammatory cytokines, oxidant damage and the apoptotic index in this model. We found significantly lower inflammation levels in the MCDD + melatonin-treated rats compared with the rats that received only MCDD. The anti-inflammatory effect of melatonin we found on NASH is exceptionally important because it ameliorated the second-hit risk factors, in the two-hit hypothesis. Melatonin treatment led to a change from NASH to mild steatosis and decreased the chance for progression to cirrhosis. Liver histology was normal in the saline- and melatonin-treated control groups.
Liver steatosis and accompanying apoptosis were observed in rats fed with methionine-, choline- and folate-deficient diet, which is associated with inflammation [29]. Presence of the high apoptotic index in the MCDD group did not exclude presence of other kinds of cell death [30]. However, one of the operating mechanisms of the liver damage in this study was apoptotic cell death which was shown by increased DNA fragmentation in the MCDD-fed rats [31]. Melatonin succeeded in preventing the evident liver damage by decreasing the hepatic apoptotic index in this model.
Oxidative stress plays an important role in the formation of liver inflammation by increasing the migration of inflammatory cells and their activation. MDA, the end product of lipid peroxidation, has been shown to activate the inflammation [32]. In our study, liver MDA levels in the MCDD rats were significantly higher than in the other three groups. There were no statistically significant differences between the saline- and melatonin only-treated animals. Consistent with the previous studies, melatonin suppressed MDA generation at a rate close to the control levels.
In a recent study of Kireev et al. [33], melatonin protected the liver of old ovariectomized rats from oxidative and pro-inflammatory damage. Administration of melatonin, both to intact and to the ovariectomized rats significantly reduced oxidative stress parameters and pro-inflammatory cytokines in the liver when compared with untreated rats. Oxidative stress and inflammation markers in the liver are more marked in ovariectomized than in intact females. Significant reductions in the oxidant stress and TNF-α, IL-1β, and IL-6 protein expression were found in rats treated with melatonin. In our study, the effect of melatonin in the reduction of the oxidative stress and the same proinflammatory cytokines is very comparable. Besides its ability to directly neutralize a number of free radicals and reactive oxygen and nitrogen species, melatonin stimulated antioxidants such as SOD and GSH, which increased its efficiency as an antioxidant.
In reference to liver biochemistry, serum AST, ALT and ALP levels were higher in the MCDD rats, than in the other three groups. In addition, serum ALT and ALP levels in the MCDD and MCDD + melatonin rats were significantly higher than those in the controls whereas other biochemical parameters did not reveal any significant difference.
Pan et al. [34] investigated the effects of melatonin on nonalcoholic fatty liver induced by high-fat diet in rats. High-fat diet induced grade 3–4 steatosis but only some of them showed steatosis and inflammation. Therefore, they called the study model the ‘fatty liver model’. In the study each rat received a high-fat diet and one of the groups received melatonin at pharmacological doses of 2.5, 5, and 10 mg/kg. The high-fat-only group had increased AST, ALT levels, and liver lipid peroxidation with decreased GSH and SOD levels when compared with the controls. They reported their best improvement results on the highest melatonin dose group. However, this study was confined mostly to liver steatosis and not inflammation formation. In this study, liver inflammation formation was evaluated quantitatively both by histology and with proinflammatory cytokine levels in an overt NASH model by MCDD induction.
We previously reported an equal reproducibility problem of the liver pathology on the high-fat diet model of Lieber-DeCarli [18]; therefore, we planned to study the effects of melatonin in an evident model of NASH. Our study is the first to demonstrate the protective effect of melatonin using the MCDD-induced model of overt NASH. The histological NASH score, proinflammatory cytokine production, free radical damage, and liver enzymes significantly improved in all rats of the MCDD + melatonin group compared with the MCDD group.
In conclusion, melatonin significantly attenuated NASH in the MCDD-induced diet model. Melatonin has significant beneficial effects on levels of AST, ALT, ALP, IL-1β, IL-6, and TNF-α and tissue MDA, SOD and GSH, and also the histopathological apoptotic and NASH scores. Melatonin’s clear beneficial effects on the biochemical and histopathological markers of the liver damage potentially allow melatonin to be a new therapeutic choice for NASH.
Acknowledgment
The authors would like to thank Kenneth Dorko from the University of Pittsburgh for his suggestions and critical review of the manuscript.
Author contributions
Each author has participated adequately in the study for substantial contributions to conception and design, acquisition of data, analysis and interpretation of data; drafting the article or revising it critically for important intellectual content; and final approval of the version to be published. All authors contributed to the scientific acquisition of data, revising the content and the final version. Beyond these critical activities, additional contributions of the authors were as follows: VT was mainly responsible for the management of the study and performed analysis and interpretation of data. OA organized the design and feeding of animals; HA performed acquisition of data and the drug administrations. FE killed animals and performed apoptosis studies. GT performed invasive procedures in the animals. OT interpreted the data regarding the disease. HU performed biochemical and cytokine tests. OO followed up the animals and is a contributor in writing the manuscript. OT collected and stored the tissues and sera. NI performed the design and statistics and was a major contributor in writing the manuscript. FO studied the free radical tests. CC performed histopathologic examinations of the biopsies and took pictures of the tissues. EA guided the methodology and animal model. NT produced the main aim and managed the study. All authors read and approved the final version of manuscript.


