Near Infrared Spectroscopy as a Tool for the Determination of Eumelanin in Human Hair
Abstract
Eumelanins are brown-black pigments present in the hair and in the epidermis which are acknowledged as protection factors against cell damage caused by ultraviolet radiation. The quantity of eumelanin present in hair has recently been put forward as a means of identifying subjects with a higher risk of skin tumours. For epidemiological studies, chromatographic methods of determining pyrrole-2,3,5-tricarboxylic acid (PTCA; the principal marker of eumelanin) are long, laborious and unsuitable for screening large populations. We suggest near infrared (NIR) spectroscopy as an alternative method of analysing eumelanin in hair samples. PCTA was determined on 93 samples of hair by means of oxidizing with hydrogen peroxide in a basic environment followed by chromatographic separation. The same 93 samples were then subjected to NIR spectrophotometric analysis. The spectra were obtained in reflectance mode on hair samples which had not undergone any preliminary treatment, but had simply been pressed and placed on the measuring window of the spectrophotometer. The PTCA values obtained by means of HPLC were correlated with the near infrared spectrum of the respective samples. A correlation between the PTCA values obtained by means of HPLC and the PTCA values obtained from an analysis of the spectra was obtained using the principal component regression (PCR) algorithm. The correlation obtained has a coefficient of regression (R2) of 0.89 and a standard error of prediction (SEP) of 13.8 for a mean value of 108.6 ng PTCA/mg hair. Some considerations about the accuracy of the obtained correlation and the main sources of error are made and some validation results are shown.
Abbreviations –
-
- CV
-
- coefficient of variation
-
- DHI
-
- 5,6-dihydroxyindole
-
- DHICA
-
- 5,6-dihydroxyindole-2-carboxylic acid
-
- FT
-
- fourier transform
-
- ICRA
-
- identicheck reflectance accessory
-
- NIR
-
- near infrared
-
- PCR
-
- principal component regression
-
- PDCA
-
- pyrrole-2,3-dicarboxylic acid
-
- PTCA
-
- pyrrole-2,3,5-tricarboxylic acid
-
- SEP
-
- standard error of prediction
Introduction
For some time now eumelanins have been recognized as pigments, present in the hair and epidermis, which are responsible for brown and black colour. They are polymers which are only slightly soluble and difficult to purify and they are present in tissues as granules associated with other types of pigments, called pheomelanins, which are responsible for red and yellow colouring. In order to determine the quantity of eumelanins present in the tissue, these are not isolated from the tissue, but the tissue is oxidized and the structural markers undergo a quantitative analysis. The most representative of these is pyrrole-2,3,5-tricarboxylic acid (PTCA) which forms after the oxidative degradation of the pigment eumelanin (1, 2). Recently, other products of degradation, including pyrrole-2,3-dicarboxylic acid (PDCA) have been identified and quantified (3, 4).
The best known and most used method for determining eumelanin in pigmented tissues consists of the oxidative degradation of the pigment using potassium permanganate in an acidic environment and of the determination of PTCA by means of high performance liquid chromatography (HPLC) (1, 2). Recently an alternative method of oxidation of the eumelanic pigment has been developed, which involves the use of hydrogen peroxide in a basic environment. Compared with oxidation using permanganate, this gives higher PTCA yield, a greater linearity in the quantity of PTCA produced compared with the eumelanin oxidized and a greater stability in the basic environment of the PTCA obtained (5).
Eumelanins are recognized as protection factors against cell damage caused by ultraviolet radiation and recently they have been studied as markers to identify less well protected subjects, who have greater risk of getting skin tumours (6). An evident correlation between the quantity of eumelanin present in the epidermis and hair has been demonstrated by Thody (7). Moreover the quantity of eumelanin present in the hair is rather higher than that of pheomelanin and varies from 99% of the total melanin in black hair to 67% in red hair (8).
For epidemiological studies, involving many individuals in a population, chromatographic methods of analysing eumelanin, although precise, are very laborious. Simpler and faster alternative methods, involving the measurement of different spectra in the UV–Visible range of hair samples solubilized in Soluene-350, have been studied (9). The goal of the present work is to study the possibility of using near infrared (NIR) spectroscopy as a tool of determining eumelanin in samples of hair.
NIR spectroscopy is very fast, non-destructive analytical technique which, in general, does not require preparation of the sample before the analysis. The most difficult part of the task is the calibration method which must be performed with a large number of samples. This work consists of finding a relationship between a given, measurable and quantifiable chemical characteristic of a sufficiently large population of samples (in this case the content of PTCA, the marker for eumelanin, in the hair samples, measured by means of HPLC) with the NIR spectrum of respective sample. Following that, the method can be used to determine this characteristic on unknown samples having similar characteristics (pigmentation, origin) as those used for calibration. Once the method has been fine-tuned, the analysis is fast and repetitive and can be performed by non-specialized personnel. In practice, NIR spectroscopy could be used to measure characteristics of hair after they have been removed or even of hair in situ using an optical fibre NIR probe. NIR spectroscopy was suggested by Ozaki for measuring the water content in hair samples (10). Other authors (11) have suggested that NIR spectroscopy could be used for measuring not only water content, but also melanin content in hair.
Materials and methods
PTCA was a gift from Dr S. Ito (Fujita Health University, Toyoake, Japan). Hydrogen peroxide (30% w/w) and dithiothreitol were purchased from Aldrich (Milano, Italy) and 1 M sodium hydroxide was supplied by Carlo Erba (Milano, Italy). Neutral-alkaline protease (Protex-Multiplus L) was purchased from Genecor Inc. (Palo Alto, CA, USA). All other chemicals were of the highest purity available.
The 93 hair samples were obtained from healthy subjects as well as subjects with a diagnosis of malignant melanoma originating from various European countries. Hair colour was assessed using a chart of hair colour standards by l'Oreal. The hair colours examined were red (n = 3), blond (n = 15), brown (n = 71) and black (n = 4). Dyed hair was not taken into consideration. All the subjects from whom hair samples were taken were in the age range 15–69 and they were male because of the difficulty of obtaining undyed hair from women. Before further investigation each hair sample was carefully examined on an opaque black card and any non-pigmented hairs were removed.
Two sub-samples were made from every sample, the first was used for the determination of PTCA by means of HPLC, and the second to obtain the NIR spectrum. The data for PTCA obtained by means of HPLC were associated to the spectra of the respective samples and a correlation between quantity of PTCA and NIR spectrum was obtained. NIR spectra were acquired on a sample of brown hair (level 3 on the Oreal scale) depigmented in our laboratory, on granules of eumelanic pigment isolated from black hair of a healthy volunteer and on granules of pheomelanic pigment isolated from Burgundy fawn rabbit hair.
Determination of PTCA by means of HPLC
The determination of PTCA on hair samples was performed using the method of Napolitano et al. (5). Some modifications were made to simplify the method (only one degradation product, PTCA was determined), and to increase accuracy. The hair samples were washed twice with acetone, finely shredded with a pair of scissors and left to condition for at least 24 h in an environment of 20°C and a relative humidity of 65% so as to normalize the quantity of water present in highly hygroscopic samples such as those of human hair.
Hair samples (10.0 mg) were suspended in NaOH 1 M (1.5 ml) containing 30% H2O2 (0.1 ml) in a capped tube and allowed to stand at 20°C ± 2 with stirring for 24 h. The residual H2O2 was decomposed by addition of 0.2 ml of 5% Na2S2O5 and then the mixture was acidified to pH 4.0 with 6 M H3PO4 and centrifuged at 14 000 g for 15 min. The supernatant was filtered and then injected for HPLC analysis.
Each group of samples was subjected to two alkaline degradations performed at two successive moments. The brown hair reference sample was subjected to 40 alkaline degradations in order to test the reproducibility of data obtained. The oxidation products were analysed with a HPLC system consisting of an Alliance (Waters, Milan, Italy) liquid chromatograph and a 996 Photodiode Array detector (Waters). An X-Terra C18 (5 μm particle size – 250 mm × 4.6 mm) (Waters) column with a pre-column was used. The mobile phase used was a buffer solution (0.4 M formic acid, 0.5 mM sodium octanesulfonate, 1 M NaOH at pH 2.5 in methanol), 97:3 vol/vol. Analysis were performed at 30°C and at a flow rate of 0.7 ml/min. Absorbance of PTCA was monitored at 270 nm.
NIR Spectroscopy
The NIR spectrophotometer used was a Perkin-Elmer FT-NIR System model Spectrum IdentiCheck (Perkin-Elmer, Monza, Italy). Sampling was performed in reflectance mode by means of the IdentiCheck Reflectance Accessory (ICRA) and spectra were collected as ratios against a BaSO4 white standard background. For the measurements, 50 mg of hair were pressed at a pressure of 1 t for 2 min so as to form a disc with a diameter equal to that of the instrument's measuring window and about 1 mm thick. The sample was placed on the 12 mm round measuring window and immediately the spectrum was acquired in reflectance mode.
A set of 93 spectra of hair samples (including the brown reference sample) with PTCA content ranging from 30 to 200 ng/mg (PTCA/hair) were collected in the spectral region between 10 000 and 3700/cm with a spectral resolution of 8/cm. Each analytical spectrum is the result of the recording software combination of 32 scans. Single NIR spectra were acquired for each sample. The data were analysed by means of Spectrum Quant+(Perkin-Elmer) software package supplied with the instrument. The principal component regression (PCR) algorithm was used. The first step in the PCR algorithm is a data compression, the Principal Component Analysis, that seeks to model spectra as linear combinations of a much smaller number of components, the principal components. Principal components are considered superior as predictor variables than the optical data that are directly produced by NIR instruments. This is because, since noise is rejected from the initial principal components produced, these principal components represent true sources of variation of the spectra. The scores are then computed for each principal component. The PCR calculations are performed the same way as in a normal calibration except the optical data are replaced by principal components scores.
The entire spectral region acquired was used for the calibration and no pretreatment of the spectrum (such as derivative or baseline correction) was used. A full-cross type evaluation process was used, excluding each standard in turn from the calibration, performing the calibration and then predicting the excluded sample using the calibration. The Expert Assist option of the software, which permits the identification and rejection of outliers (i.e. spectra that contain anomalous features such as an incorrect property value either from an error in the standard preparation or simply from a typing error) was used. The principal statistics used to assess the quality of the NIR results were the Coefficient of Determination (R2) and the standard error of prediction (SEP), that is the magnitude of error expected when independent samples are predicted using the model.
Depigmentation and Isolating Melanin Granules
A sample of brown hair was depigmented following a recipe used in the textile sector for depigmenting keratinic fibres1. The depigmentation process consisted of a mordanting step with Fe++ ions, followed by a bleaching step with H2O2.
Eumelanic and pheomelanic pigments were isolated using a mild isolation technique2, based on enzymatic treatment of hair with a proteolytic neutral-alkaline protease (Protex Multiplus L in liquid form 6.0 g/l) and dithiothreitol (2.5 g/l) at 55°C in a 0.1 M Tris-HCl buffer, pH 8.4 for 210 min. The complete destruction of the keratin in the hair was checked by optical and electron microscopy. The pigments were then washed several times with water, acetone and petroleum benzene and, after the evaporation of the solvent, placed as they were on the measuring window of the spectrophotometer for the spectra acquisition.
Results and Discussion
PTCA Determination by HPLC
Fig. 1 shows the chromatographic profiles obtained from the analysis of the degradation mixture from hair samples of different colours (red, blond, brown and black hair). The chromatographic patterns are very complex because of the presence of large amounts of the protein matrix which is not completely eliminated during the spinning and filtering stages and that eluted at short retention time. Good chromatographic separation of PTCA was obtained by using a mobile phase buffer (0.4 M formic acid, 1 M NaOH, pH 2.5) containing an ion pair reagent (sodium octanesulfonate) and methanol (3% vol/vol) as organic solvent. The column (C18 X-Terra) was maintained at a temperature of 30°C to improve chromatographic precision and a guard column was used to protect the main column from any contamination. In these chromatographic conditions the PTCA analytical peak occurs at about 7 min.
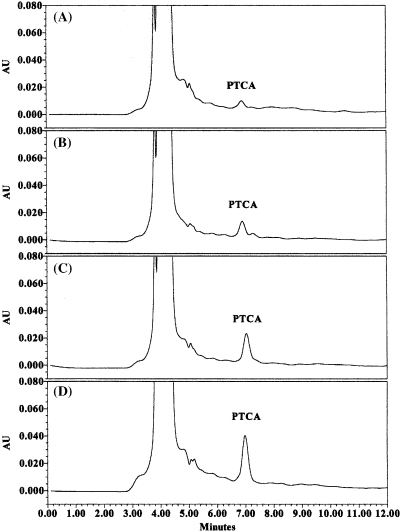
Chromatographic profile of the degradation mixture from four hair samples of different colour: A, red; B, blond; C, brown; D, black.
Quantities of PTCA varies over quite a wide range from about 200 ng of PTCA/mg of hair (in black hair) to about 100 ng/mg in brown hair, 50 ng/mg in blond hair and 30 ng/mg in red hair. The quantity of PTCA obtained is given by the average of two determinations of the same sample.
NIR Spectroscopy
The absorption bands in the NIR region (between 13 000 and 4000/cm) are the result of overtones or combinations originating in the fundamental mid-range infrared region of the spectrum. The bonds involved are generally C–H, N–H, O–H and S–H. The NIR spectra are formed of poorly resolved bands which are difficult to interpret (12). In the NIR region nearest to the visible region (between 13 000 and 9000/cm) there are electronic absorptions caused by the transition of electrons from the fundamental energy level to the higher-energy orbits. Each spectrum is acquired in reflectance mode, where both absorption and diffuse scattering of the incident light contribute to the observed signal. The depth of penetration of the NIR radiation depends on the wavelength and it is greater than the depth of penetration of UV–Visible radiation at shorter wavelengths. However, it is certain that NIR radiation reaches the melanin granules which are situated between the cortical cells of the hair (11).
Fig. 2 shows the NIR spectrum of a sample of brown hair. The shoulder at 7000/cm is assigned to the first overtone of O–H stretching vibration of water and the band at 5200/cm is assigned to a combination of the O–H stretch and H–O–H bending vibrations of hydroxyl group from water. The doublet at about 5800/cm is the overtone of the C–H stretch of protein side chains and lipids. The bands between 5000 and 4000/cm give information about the protein-type structure of hair. The tail between 10 000 and 7300/cm is characteristic of pigmented hair and has been associated by some authors with the semiconductor properties of melanin pigments (11, 13). Information from the visible region is also present in this region of the spectrum (14).
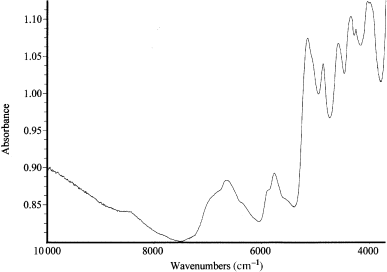
Spectrogram in the near infrared field of a brown hair sample.
Fig. 3 shows the NIR spectra of four samples of hair of different colours (red, blonde, brown and black), with differing contents of eumelanin, and the sample of brown hair after depigmentation. The most marked differences between the spectra can be seen in the tails between 10 000 and 7300/cm, where the melanin absorption is not masked by the absorption of functional groups from the protein matrix. The absorption in this region is correlated with the content of melanin in the hair. In particular, in this spectral region, the depigmented sample does not show absorption bands, with the exception of a band of weak intensity at about 8400/cm, due to protein backbone, and visible as a shoulder, masked by the absorption of melanin, in the pigmented sample.
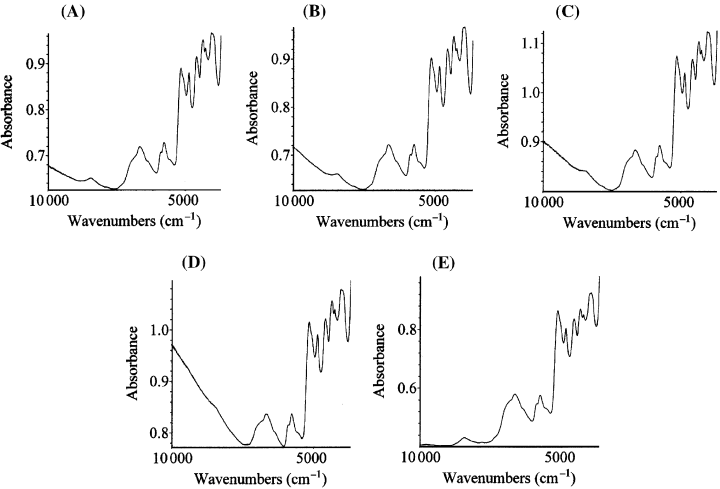
Spectrograms in the near infrared region from hair samples of different colour and from a depigmented hair sample: (A) Red hair. (B) Blond hair. (C) Brown hair. (D) Black hair. (E) Brown hair after depigmentation with hydrogen peroxide.
Fig. 4 shows the spectra of eumelanin and pheomelanin pigments. The main differences in the spectra are seen in the baseline increase that interests not only the region between 10 000 and 7300/cm, but in the eumelanin spectrum begins from about 5500/cm, while in the pheomelanin spectrum it begins at higher wave numbers and it is much less accentuated. These differences are due to a different electronic absorption behaviour of eumelanins and pheomelanins. Other differences, probably present in the spectum of eumelanin and pheomelanin in the region nearest to the medium infrared wavelengths (due to overtone absorbance and combinations of absorbance from functional group, such as C–H, N–H, O–H and S–H) are not clearly visible probably because they are hidden by absorption from the proteinaceous matter not completely eliminated during the enzymatic extraction procedure (15).
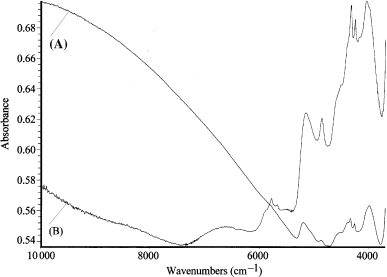
Spectrograms of eumelanins isolated from human black hair (A) and pheomelanins isolated from rabbit fawn hair (B).
The population of hair for which spectra were obtained consists of a sufficiently high number of samples. Samples are sufficiently varied as to colour (and thus eumelanin content) as well as for geographic origin.
After the elimination of non-pigmented hair, spectra were acquired on the samples as they were, i.e. with no further manipulation (such as washing or conditioning) so as to preserve as much as possible real analytic conditions, which are reproducible out of the laboratories, and to exploit the advantages of speed and simplicity in the preparation of the samples which are offered by NIR spectroscopy. The preparation of the samples (pressing them to form a disc) was done in order to measure the sample in the most reproducible manner possible and was conditioned by the type of measuring window of the instrument and the scarcity of material available. The hair spectra were correlated with the PTCA content of the respective samples measured using HPLC.
The correlation was obtained using software Spectrum Quant+ of the instrument and the algorithm PCR. The entire spectral region between 10 000 and 3700/cm was used for the calibration. The reason is that, using a chemometrich approach and using a multivariate calibration algorithm, such as PCR, is the best initial approach to consider all the variability in the spectra and to use all wavelengths of NIR region. The spectrum is dependent on all the functional groups that absorb NIR radiations, which in turn are correlated to the major chemical and physical components of a substance. The contribution of pheomelanin at the obtained hair spectrum is not probably negligible, but also other hair components (proteins, lipids, moisture content and also physical characteristics such as mean diameter or medulla) contributed to the observed spectrum and also their contribution is not negligible. PCR algorithm attempts to establish relationships, between the spectra of a set of calibration standards and the corresponding property values determined by independent analytical methods. These relationships can be used for subsequent predictions of unknown samples. Moreover, in the experimental work, different spectral regions (between 10 000 and 7300/cm, between 7300 and 3700/cm and between 10 000 and 3700/cm) were used for the calibration and the best results (i.e. the lowest SEP) were obtained when considering the spectral region 10 000–3700/cm (the entire region of spectra acquisition).
The correlation obtained between specified values obtained by reference method (amount of PTCA determined by HPLC analysis) and values estimated by NIR spectra is shown in Fig. 5. The coefficient of determination (R2) of 0.89 indicates the degree of correlation between the values of PTCA specified and those obtained from the spectra. The type of calibration used enabled the calculation of the SEP, i.e. the error predicted when samples other than those used for calibration are measured. A SEP of 13.8 for an average PTCA content of 108.6 ng/mg was calculated.
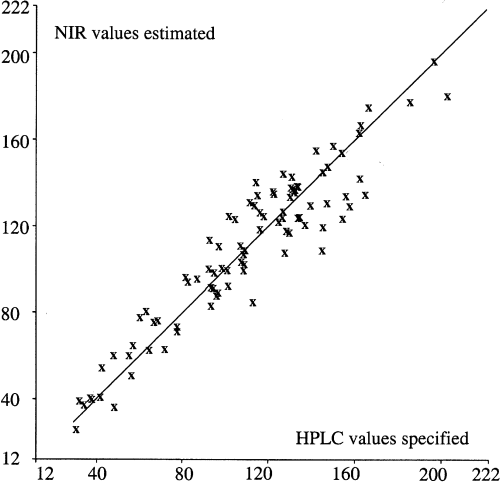
PTCA content: NIR values estimated by spectrograms (y-axis) versus HPLC values specified and obtained by HPLC determination of PTCA in hair samples (x-axis) – SEP = 13.8, M = 108.6 ng PTCA/mg hair, R2 = 0.89.
The precision of the method obtained depends on many variables including the accuracy of the calibration values, the dependence between the concentration of the pigment analysed (eumelanin determined through the marker PTCA) and the NIR spectrum of the sample (hair), the reproducibility of the presentation of the sample, the instrumental reproducibility in the acquisition of data and the choice of calibration variables.
Not all these variables can be quantified with precision, but some observations can be made. The SD and the coefficient of variation (CV) of the reference method were calculated on 20 measurements (obtained by the average of two determinations) carried out on a sample of brown hair. The values obtained (SD = 2.43 on an average value of 98.2 ng/mg, CV = 2.5%) indicate that the reference values used were fairly accurate.
PTCA is recognized as a typical eumelanin marker. In particular, PTCA derives from DHICA-derived units in eumelanins. Although we did not calculate or use conversion factors, the yield of PTCA from the oxidization method used has been calculated to be about 6–7% starting from 5,6-dihydroxyindole-2-carboxylic acid (DHICA) melanins (3). Some authors (8) have also showed that PTCA derives from 5,6-dihydroxyindole (DHI)-derived units in eumelanins in low yield following H2O2 oxidation in hair samples. Ozeki et al. (16) showed that in human hair the ratio DHI/DHICA is not constant in different hair colours, in particular, the more DHICA is relative to DHI, the less dark the eumelanin is. Moreover, PTCA is formed in low amounts by pheomelanin oxidized by H2O2 (5, 8) and this can bring an overestimate of the amount of eumelanin in red hair. The linear correlation that we have obtained takes into account all eumelanic precursors that produce PTCA in the analytical conditions used. These considerations are an integral part of the valuation of accuracy of NIR proposed method. In particular, the possibility to mistaking eumelanin from blond hair and pheomelanin from red hair has to be considered when a eumelanin marker is used. However, probably only a fringe of the population considered is part of this class, while most of the people considered have hair colour ranging from light brown to dark brown.
Some data concerning the reproducibility in the acquisition of the spectra and in the sampling method are shown in Table 1. Repack error (same sample positioned different time on the measuring window, keeping constant the window and the methods of measurement), calculated on five replications of a sample of brown hair and the sampling error (the measurement of various sub-samples taken from the same sample), also calculated for five replications, indicate that the sample presentation method influences the overall result in a non-negligible manner.
| Sample | PTCA (ng PTCA/mg hair) | Sample | PTCA (ng PTCA/mg hair) |
|---|---|---|---|
| a1 | 120.5 | b1 | 112.7 |
| a2 | 123.7 | b2 | 122.2 |
| a3 | 128.9 | b3 | 108.4 |
| a4 | 125.3 | b4 | 123.9 |
| a5 | 130.6 | b5 | 124.9 |
| Meana | 125.8 | Meanb | 118.4 |
| SDa | 4.0 | SDb | 7.4 |
| CV (%) | 3.2 | CV (%) | 6.3 |
- aSame sample positioned in five different ways on the measuring window.
- bFive measurements of sub-samples taken from the same sample.
Finally, a limited validation test for PTCA content was carried out on five hair samples of different colour (red, blond, light and dark brown and black). The results are shown in Table 2. These results give a more immediate, but very approximate, impression of the accuracy of results which can be obtained with this method.
| Sample | PTCA (ng PTCA/mg hair) HPLC values | PTCA (ng PTCA/mg hair) NIR values |
|---|---|---|
| Red hair | 32.4 | 34.4 |
| Blond hair | 40.0 | 38.1 |
| Light brown hair | 58.6 | 80.2 |
| Dark brown hair | 116.4 | 121.8 |
| Black hair | 140.5 | 151.8 |
We believe that the enormous advantages provided by NIR spectroscopy, together with the speed and ease of obtaining analytical data, compensate for the lesser precision compared with the reference method. This is true especially with the prospective of using this technique for screening large samples of population, e.g. for epidemiological studies carried out with the aim of using PTCA measured in hair sample as a tool for detecting subjects less protected and thus with a higher risk of developing skin tumours.
Footnotes
Acknowledgments
Acknowledgements– We are indebted to Prof. Ito (Fujita Health University, Japan) who kindly provided standard PTCA. We thank Dr Di Donato (University of Naples Federico II, Italy) for her assistance in HPLC measurements and Dr Napolitano (University of Naples Federico II, Italy) for helpful discussions.


