THE EVOLUTION OF GENES IN BRANCHED METABOLIC PATHWAYS
Abstract
Simulation models of the evolution of genes in a branched metabolic pathway subject to stabilizing selection on flux are described and analyzed. The models are based either on metabolic control theory (MCT), with the assumption that enzymes are far from saturation, or on Michaelis–Menten kinetics, which allows for saturation and near saturation. Several predictions emerge from the models: (1) flux control evolves to be concentrated at pathway branch points, including the first enzyme in the pathway. (2) When flux is far from its optimum, adaptive substitutions occur disproportionately often in branching enzymes. (3) When flux is near its optimum, adaptive substitutions occur disproportionately often in nonbranching enzymes. (4) Slightly deleterious substitutions occur disproportionately often in nonbranching enzymes. (5) In terms of both flux control and patterns of substitution, pathway branches are similar to those predicted for linear pathways. These predictions provide null hypotheses for empirical examination of the evolution of genes in metabolic pathways.
The past decade has seen a resurgence of interest in developing a general theory of adaptation. Much of this effort has been directed at understanding the distribution of the magnitude of fitness effects on adaptive walks and on the nature of sequence evolution on rugged adaptive landscapes (Orr 2005). By contrast, an equally important issue for such a theory—whether certain genes are more likely than others to contribute to adaptive change, and if so, which ones—has received considerably less attention. Yet being able to predict which genes are “targeted” by selection in this way would be helpful in interpreting a number of evolutionary patterns, including differences in evolutionary rates among genes in metabolic pathways, (e.g., Rausher et al. 1999; Ramsay et al. 2009) and why the probability of fixation of mutations in some genes may be greater than that of mutations in other genes (Stern and Orgogozo 2008, 2009; Streisfeld and Rausher 2009, 2011).
Genomic analyses have revealed a number of interesting patterns suggesting that the positions of genes or their products in networks and pathways may affect the rates of adaptive or deleterious substitutions in those genes. For example, fewer substitutions tend to occur in genes whose products are centrally located in networks (Hahn and Kern 2005), interact with more other gene products (Fraser et al. 2002; Hahn et al. 2004), or are upstream in metabolic pathways (Rausher et al. 1999; Ramsay et al. 2009). Despite these empirically derived patterns, however, there is little theoretical analysis to explain why these patterns may exist. In this report, I partially address this lacuna by modeling the evolution of genes in branched metabolic pathways.
This analysis builds on a previous simulation analysis of the evolution of genes associated with linear metabolic pathways, which revealed that adaptive substitutions in upstream genes occur more frequently than in downstream genes, whereas slightly deleterious mutations are fixed by genetic drift more frequently in downstream genes (Wright and Rausher 2010). These substitution patterns arise because under stabilizing selection on metabolic flux, the pattern of flux control across pathway genes evolves in a predictable manner: the system tends to evolve toward states in which upstream genes have greater flux control than downstream genes. Given this pattern, adaptive substitutions are expected to be concentrated in enzymes that exert the greatest control over flux (Hartl et al. 1985; Eanes 1999; Watt and Dean 2000). An adaptive mutation with a given effect on enzyme kinetics will produce a greater adaptive change in flux, and hence in fitness, when it occurs in upstream genes. Because the probability of fixation is proportional to the magnitude of selection, adaptive mutations in upstream genes will have a higher probability of fixation than those in downstream genes, resulting in the greater number of mutations fixed in upstream genes. By contrast, the fitness effect of a deleterious mutation will be smaller for downstream genes because of their lower control over flux, resulting in a higher fixation probability because the probability of fixation of a deleterious mutation is inversely related to the magnitude of selection.
It is not clear, however, whether these conclusions are expected to hold for branched pathways. Moreover, several empirical observations on branched pathways are at odds with the expectations derived for linear pathways. One is the general belief that flux control in branched pathways tends to be concentrated at the branch points (Eanes 1999; Flowers et al. 2007), which implies that it does not decrease monotonically from upstream to downstream genes as found by Wright and Rausher (2010). However, no formal theoretical justification has been provided for this belief. Another observation is that, in at least one study, adaptive substitutions tend to be concentrated at branch-point genes, rather than at the most upstream genes of the pathway (Flowers et al. 2007). Finally, one investigation has demonstrated that nonsynonymous substitutions occur less frequently in branch-point genes, reflecting greater selective constraint in these genes (Yang et al. 2009). In the analyses presented here, I ask whether models of the evolution of genes associated with branched pathways predict these patterns, and, more generally, whether the conclusions derived from models of evolution of branched pathways differ from those derived for models involving linear pathways. Specifically, I consider several questions:
- 1
What pattern(s) of flux control evolve in branched pathways? In particular, I ask whether a path in a branched pathway (the set of reactions from the initial substrate to a final product) exhibits the same pattern of flux control as linear pathways. In addition, I ask whether flux control evolves to be concentrated at pathway branch points, as empirical data suggest frequently occurs (LaPorte et al. 1984; Stephanopoulos and Vallinot 1991; Vallinot and Stephanopoulos 1994; Heijnena et al. 2004). Finally, I ask whether pathway segments exhibit properties similar to linear pathways.
- 2
Does the pattern of flux control cause substitutions to occur at different frequencies in different genes along a pathway? In particular, I test following three predictions:
-
Prediction 1:
When fluxes in the branches of a pathway deviate substantially from the environmental optimum, a disproportionate share of adaptive substitutions will occur in genes coding for enzymes with the greatest flux control. In this situation, mutations of large effect can be adaptive, and, as argued above, a disproportionate share will occur in genes of enzymes with the largest control over flux.
-
Prediction 2:
Regardless of deviation from optimal fluxes, slightly deleterious substitutions should occur disproportionately often in enzymes with little control over flux. In this situation, a given change in activity of these enzymes will have a smaller detrimental effect on fitness. Such a change will then have a higher probability of fixation because for deleterious alleles, probability of fixation is inversely related to the magnitude of the selection coefficient.
-
Prediction 3:
When fluxes are near their optima, adaptive substitutions are expected to occur disproportionately often in enzymes with little flux control. This is because near the optimum, only mutations with small effects on fitness will be adaptive (Fisher 1930). Because enzymes with little flux control have less of an effect on fitness than enzymes with substantial flux control, a greater proportion of the former is expected to be adaptive. Consequently, the probability of fixation, once a mutation has arisen, is expected to be higher for enzymes with less control over flux.
- 3
Do the relative magnitudes of flux down different pathway branches influence either the evolved pattern of flux control or the relative numbers of substitutions that occur in different genes? Intuitively, it seems reasonable to expect that addition of a side branch through which there is little flux to a linear pathway would have little effect on either the pattern of flux control or the pattern of substitutions in that pathway. By contrast, a side branch through which there is substantial flux would likely have a substantial effect. I ask whether this hypothesis is supported by the model.
General Modeling Approach
I focus initially on a simple branched metabolic pathway in which there are two enzymes above the branch point, and two enzymes in each branch (Fig. 1A). Subsequently, I consider a branched pathway with a longer terminal branch (Fig. 1B), and one with a longer internal branch (Fig. 1C). In all three cases, I focus on control of flux by, and substitutions in, enzymes in branches 1 and 2, which constitute the “focal” path (Fig. 1). As in Wright and Rausher (2010), I analyze two different types of model: one based on metabolic control theory (MCT model) (Kacser and Burns 1973; Heinrich and Rapoport 1974) and one based on Michaelis–Menten kinetics (SK, or “saturation kinetics,” model). The former approach assumes that enzymes are very far from saturation, whereas the latter allows for saturation and near-saturation. I present both models because in any given real case it is often not known which assumption is more realistic. Details of both types of model are given in the Appendix.
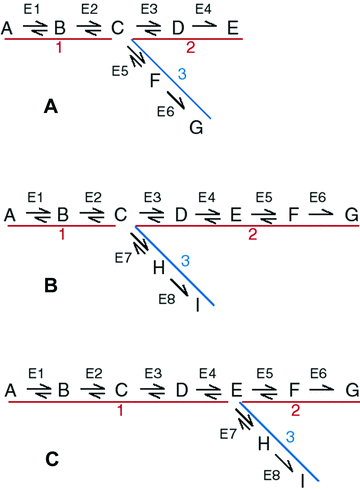
Pathways examined. A,B, … indicate initial substrate, intermediates, and final products. Red and blue lines and numbers indicate pathway segments or branches. Branch 1 is an internal branch, branches 2 and 3 terminal branches. Red branches constitute the focal pathway. Blue branch indicates side branch. E1, E2, … indicate enzymes. (A) Simple branched pathway. (B) Long terminal branch pathway. (C) Long internal branch pathway.
Both types of model incorporate a set of kinetic parameters, one for each enzyme (See Table 1 for list of parameters). In the MCT model, these parameters are the k the rate of conversion of substrate into product. In the SK model, the parameters are the V
 , the maximum velocity of the reaction. In both models, these are the parameters that are allowed to evolve, and they determine the magnitudes of fluxes, J, down each branch of the pathway. Changes in both parameters may be due to either changes in kinetic properties or changes in enzyme abundance, and I do not distinguish between these possibilities. In addition, there are fixed (nonevolving) parameters that also influence flux: α, the ratio of the reverse to forward rate of the reaction associated with an enzyme (e.g., α=
 ; see Appendix); and A, the concentration of the initial substrate in the pathway. Other fixed parameters are described below. In these analyses I assume α= 0.01, corresponding to largely, but not completely, reversible reactions, because most metabolic reactions are largely irreversible (Wright and Rausher 2010), and because preliminary analyses indicated that results with smaller values of α produce qualitatively very similar results. I also arbitrarily set A = 10, since the flux equations (see Appendix) can be scaled in arbitrary units that make this parameter take on any value. This parameter represents the concentration of the initial substrate, which is held constant because it is assumed to be well buffered (Wright and Rausher 2010).
| Parameter | Description |
|---|---|
k |
Activity of enzyme i in MCT model. |
| Vi | Maximum velocity of enzyme i in SK model. |
J |
Optimal flux through branch 2 of the pathway |
| J3opt | Optimal flux through branch 3 of the pathway |
| σ22 | Strength of stabilizing selection on branch 2 flux |
| σ23 | Strength of stabilizing selection on branch 3 flux |
 |
Variance of mutational effects on kinetic parameters |
| Ratio of rate of forward reaction to rate of reverse reaction | |
| T | Threshold concentration of intermediates that reduces fitness |
| J2opt/J3opt | Optimal flux ratio |
The basic unit of all simulations is the “trial,” which is made up of a large number of mutation cycles. A trial is begun by picking a starting set of kinetic parameters. Mutations are then introduced by randomly picking a pathway gene, then randomly picking a mutation size from a normal distribution with mean zero and variance given by the fixed parameter  . The k
 (MC model) or V
 (SK model) for the randomly chosen gene i is then altered by the size of the mutation and the resulting fluxes are calculated using the flux equations (see Appendix).
Next, the fitnesses associated with the new and old fluxes are calculated based on the assumption that stabilizing selection acts on the flux down each branch of the pathway. In the SK model, fitness is also decreased by high concentrations of intermediate substrates (for explanation, see below). The mutation is accepted (a substitution occurs) based on the probability of fixation of a mutation with a given selection coefficient (determined by difference in fitness). This constitutes one mutation cycle. A trial consists of numerous cycles (typically 50,000).
For each model, two types of simulations were conducted. In the first type (constant environment), the starting kinetic parameters were chosen randomly from a uniform distribution of values between 0 and 1 that produced fluxes from just above 0 to a maximum of A (Fig. S1). This limit was imposed because it seems unreasonable to believe that flux would be greater than the buffered concentration of the initial substrate. The purpose of this type of simulation was to explore what patterns of flux control are possible (represented by flux controls associated with the flux determined by the starting kinetic parameters) and what patterns of flux control evolution produces from the universe of possible kinetic parameters. Because the assumption of random initial points may be inappropriate, a second type of simulation (fluctuating environment) was conducted. In these simulations, starting values randomly chosen from the endpoints generated in the constant environment simulations, which are evolutionarily attainable points. The system was allowed to evolve to an equilibrium determined by the initial optimal fluxes along each branch. The optimum for branch 2 was then shifted by randomly choosing a new value, and the system was allowed to evolve for 50,000 mutation cycles. The optimum was then shifted again and process repeated. A total of 20 shifts in optimal flux were conducted for each starting point. This type of simulation represents long-term evolution with periodic environmental change.
For each of the four categories of models (MCT vs. SK, constant vs. fluctuating environment), 2000 (MCT model) or 200 (SK) trials were conducted for each combination of parameters. For the MCT model, I examined all factorial combinations of J = {0.3, 1, 3} ⊗J
 = {0.3, 1, 3}⊗(
 ,
,  ), where (
 ,
,  ) is an element of {(1.6, 0.4), (1.3, 0.7), (1,1), (0.7, 1.3), (0.4,1.6)}. For the SK trials, the combinations involving (
 ,
,  ) = {(1.3, 0.7) and (0.7, 1.3)} were omitted because these simulations require much more time than the MCT simulations. SK simulations included a “cost” parameter, T, which penalizes fitness when intermediate products accumulate (see Appendix). This parameter is included because in models of linear pathways, such a cost is necessary to cause equilibrium flux Control Coefficients (CCs) to differ among enzymes (Wright and Rausher 2012). This parameter was varied from 2 (high cost) to 50 (low cost).
The models generate two types of output. The first consists of the set of flux CCs. (These CCs are equivalent to the sensitivity coefficients of Kacser and Burns 1973.) There are two CCs for each enzyme. One is the CC for flux down branch 2, which is the proportional change in flux down that branch that is caused by a given proportional change in the enzyme activity. Symbolically, this is ( ) /(
) /( for enzyme i. The second CC is the corresponding effect on flux down branch 3 (side branch; see Fig. 1). For most of the analysis, I will be concerned primarily with CCs associated with branch 2. For each trial, CCs were calculated at the beginning and the end of the trial.
The second set of outputs consists of the proportions of substitutions associated with each enzyme in the pathway. Substitutions were divided into four categories determined by current fitness when the substitution occurred and whether it was an advantageous or deleterious substitution. In the MCT models, substitutions that occurred when fitness was less than 0.95 were considered to be in the “adaptive phase,” that is, the period in which the population is still climbing the adaptive landscape. By contrast, substitutions that occurred when fitness was greater than 0.95 were considered to be in the “equilibrium phase,” when the population is near the optimum. Although the precise fitness threshold separating these two phases is somewhat arbitrary, the choice of 0.95 produced results that seem reasonable.
Exploratory trials with the SK models indicated that evolution quickly brings populations near the optimal flux allocation, but the optimal sizes of the intermediate pools are approached much more slowly. In most runs, even after 100,000 mutation cycles, the sizes of these pools were still evolving. Consequently, I divided substitutions into adaptive and equilibrium phases using only criteria based on deviation of J and J
and J from the optima. In particular, fitness in this model is the product of three quantities. The first two are Gaussian fitness functions based on these deviations, whereas the third is a factor that penalizes high intermediate concentrations (see Appendix). I considered a substitution to have occurred in the adaptive phase when the product of the first two terms was <0.99; otherwise I considered it to have occurred in the equilibrium phase.
Results
EVOLUTION OF FLUX CONTROL
I first consider the branched pathway in Figure 1A. In each of the four model categories, evolution of kinetic parameters converges to the same pattern of flux control: averaged over all parameter combinations (2, 3; Tables S1 and S2), the greatest control is vested in the first enzyme, while branching enzymes 3 and 5 exhibit substantial control. By contrast, enzymes 2, 4, and 6 have very little control. For example, this pattern, which I term the “dominant” pattern of flux control, evolved in 94.6% of the 90,000 trials in the MCT constant-environment model and in all but five of the 5400 SK constant-environment trials with T = 10. It thus seems that in this pathway, control evolves to be vested largely in the branching enzymes. (Enzyme 1 may be considered a “branching enzyme” because buffered substrate pools such as A often serve as initial substrates for several different pathways.)
Initial and final Control Coefficients (CCs) for MCT simulations. Thick error bars: 1 SD across parameter combination means. Thin error bars: range of values across parameter combination means. Red bars indicate branching enzymes. (A) Final CCs after simulated evolution constant-environment simulations. (B) Initial CCs in fluctuating-environment simulations. (C) Final CCs in fluctuating-environment simulations for simulations beginning with “nondominant” distribution of CCs. (D) Final CCs in fluctuating-environment simulations for simulations beginning with “dominant” distribution of CCs.
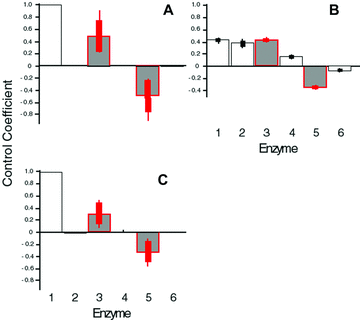
Initial and final Control Coefficients (CCs) for SK simulations. Error bars as in Fig. 2. Red bars indicate branching enzymes. T = 10. See Tables S1 and S2 for results for different values of T. (A) Final CCs in constant-environment simulations. (B) Initial CCs in constant-environment simulations. (C) Final CCs in fluctuating-environment simulations.
The evolved CCs of branching enzymes 3 and 5 are on average very similar in magnitude in all models. They are, however, opposite in sign, reflecting the fact that an increase in activity of enzyme 3 will increase flux down branch 2 while decreasing flux down branch 3 and vice versa. This pattern makes intuitive sense because these two enzymes are competing for a limited resource, substrate C.
In the MCT model, this pattern of convergence to a dominant pattern of flux control appears to be due to two factors. First, 96.4% of the random initial values for the kinetic parameters corresponded to the dominant flux-control pattern, a value similar to that seen for initial points in a linear pathway (Wright and Rausher 2010). Second, the pattern of flux control has a strong tendency to converge to the dominant pattern regardless of whether the initial k values corresponded to the dominant pattern (Fig. 2C, D). In particular, for trials starting with either the dominant or other (nondominant) flux-control pattern, 94.6% and 74%, respectively, evolved to the dominant pattern. In other words, regardless of the flux pattern in the population at the beginning, there is a strong tendency to converge on the majority flux control pattern.
In the constant-environment SK model, the average initial CCs, which correspond to random starting points in parameter space, are equal for enzymes 1, 2, and 3. However, the average final CCs, corresponding to evolutionary endpoints, reflect the dominant pattern of high CC for enzymes 1 and 3, and low CC for enzymes 2 and 4 (Fig. 3A, B). This difference indicates that, as in the MCT models, there is a strong tendency for CCs to converge to the dominant pattern regardless of the initial pattern of flux control. For both the MCT and SK models, the final distribution of flux control was similar in both the constant- and fluctuating-environment simulations (2, 3).
Unlike other enzymes in the pathway, there is considerable variation in the mean flux-control exhibited by the branching enzymes (enzymes 3 and 5) for different parameter combinations (2, 3). For enzyme 3, a substantial portion of this variation is due to a negative relationship between CC and the optimal flux ratio, J /J
/J (Fig. 4). Because the CCs of enzymes 3 and 5 are highly correlated but opposite in sign, a similar pattern obtains for the absolute value of the enzyme 5 versus the optimal flux ratio. This pattern indicates that as a larger and larger fraction of the total flux flows down branch 2, the pattern of flux control for the focal path approaches that of a linear pathway, in which flux control declines along the pathway. This result is intuitively satisfying because in the limit, when there is no flux down branch 3, the focal path becomes a linear pathway. Regardless of flux ratio, however, the flux control pattern of each pathway segment (branch) behaves like a linear pathway: the first enzyme in the segment has the highest flux.
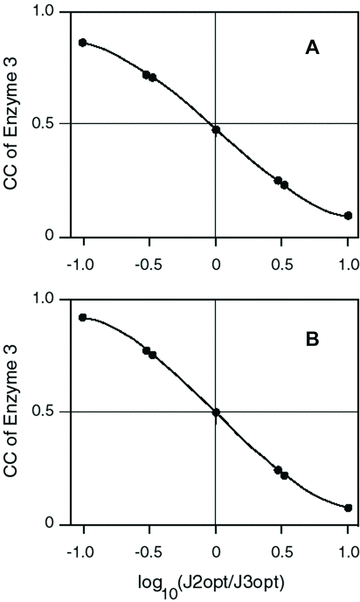
Control coefficient (CC) of enzyme 3 decreases with ratio of optimal fluxes in the two branches. Each point is average CC for one of the seven J1opt /J2opt combinations. (A) MCT constant-environment analysis. Line is y= 0.478 − 0.513x + 0.010x3 . Both x terms highly significant (P<0.0001); x2 term not significant. Line does not extrapolate because derivative is 0 at + or − 4.98. (B) SK constant-environment analysis with T = 10. Line is y= 0.4990 − 0.5686x + 0.1508x3 . Both x terms highly significant (P<0.0001); x2 term not significant. Line does not extrapolate because derivative is 0 at + or − 1.121.
PATTERN OF SUBSTITUTIONS
Adaptive substitutions (adaptive phase)
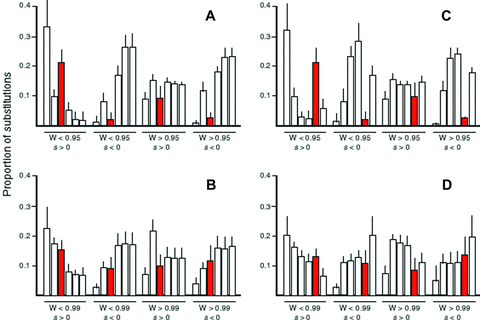
In both MCT models (constant and fluctuating environments) and in the fluctuating environment SK model, adaptive substitutions during the adaptive phase are concentrated in the first and third enzymes of the focal pathway, with less than half as many in the second and fourth enzymes (Fig. 5A, B, D; Table S2). These results thus conform to Prediction 1 (see Introduction). The constant-environment SK model deviates somewhat from this prediction, in that while substitutions in enzyme 4 are substantially lower than those in enzymes 1 and 3, there are on average slightly more substitutions in enzyme 2 than in enzyme 3 (Fig. 5C; Table S1). A likely explanation for this deviation is that in this model, in which the initial parameter values are randomly chosen, the initial CCs are on average similar for enzymes 2 and 3 (Fig. 3B) and only evolve to differ during the course of the trials. It seems probable that the excess substitutions in enzyme 2 over expected is in part due to elevated CC of enzyme 2 during the early phase of the trials. Supporting this hypothesis is the much lower number of substitutions in enzyme 2, compared to enzyme 3, in the fluctuating-environment SK analyses. In these, all trials began with the dominant pattern of flux control and presumably did not deviate much from this pattern as adaptation occurred. Thus, during the entire adaptive phase, the CC was substantially lower for enzyme 2 than for enzyme 3.
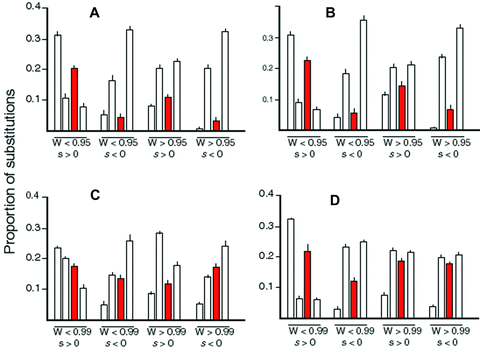
Proportion of substitutions in different enzymes of the focal pathway. Values do not sum to 1 because proportions for enzymes 5 and 6 not depicted. These two enzymes exhibited proportions of substitutions similar to enzymes 3 and 4, respectively. Order of enzymes in each group is enzyme 1–enzyme 4. Red bars correspond to branching enzyme. Error bars are SEs over parameter combination means. (A) Substitutions in MCT constant-environment simulations. W < 0.95, W > 0.95: substitutions occurring when fitness was less than or greater than 0.95, respectively. s > 0, s < 0 indicate advantageous and disadvantageous substitutions, respectively. (B) Substitutions in MCT fluctuating-environment simulations. (C) Substitutions in SK constant-environment simulations, T=10. (D) Substitutions in SK fluctuating-environment simulations, T=10.
Slightly deleterious substitutions (both phases)
In both MCT models, slightly deleterious substitutions are concentrated in enzymes 2 and 4 (Fig. 5A, B), supporting Prediction 2. The same pattern holds for the fluctuating-enviroment SK model (Fig. 5D; Table S2), although it is less pronounced for substitutions occurring in the equilibrium phase. Once again, the results from the constant-enviornment SK model deviate most from this prediction, with the number of substitutions in branching enzyme 3 being as high or higher than that for enzyme 2 (Fig. 5C; Table S1). I again suspect that the reason the results differ from Prediction 2 is that the initial CCs of enzymes 2 and 3 were similar in this model. Even in this model, however, enzyme 1, which has the largest CC, undergoes the fewest substitutions.
Advantageous substitutions (equilibrium phase)
In all models, enzymes 1 and 3 incur fewer adaptive substitutions than enzymes 2 and 4 during the equilibrium phase, in accordance with Prediction 3 (Fig. 5; Tables S1 and S2). In accordance with its higher average CC, enzyme 1 also experienced fewer substitutions than enzyme 3 in all models. In the MCT models and in the SK constant-environment model, there were substantially fewer substitutions in the branching enzyme 3 than in enzymes 2 and 4, as expected, but this pattern was weaker in the SK fluctuating-environment model.
PATHWAYS WITH LONGER BRANCHES
The above analyses suggest that terminal branches behave like linear pathways. In particular, in linear pathways, upstream enzymes have the highest CCs, the greatest number of adaptive substitutions in the adaptive phase, fewer adaptive substitutions in the equilibrium phase, and fewer disadvantageous substitutions (Wright and Rausher 2010). Although the branches in the simple branched pathway examined above exhibit these properties, it is unclear if these properties also characterize pathways with longer branches. Consequently, I performed additional simulations for pathways with longer branches (Fig. 1B, C). All of these simulations were constant-environment analyses and all SK analyses had T = 10.
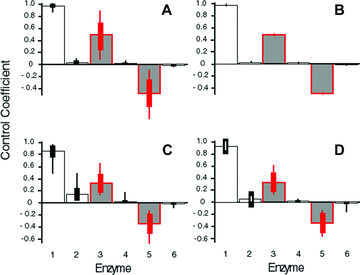
I first examined a pathway with a longer terminal branch (Fig. 1B). Results from both MCT and SK simulations indicate that evolution of enzymes in the long terminal branch conform to these patterns (6, 7). In particular, average flux control is highest for enzyme 3, substantially lower for enzyme 4, and virtually zero for enzymes 5 and 6 for both models (Fig. 6A, B). For both models, the number of adaptive substitutions during the adaptive phase is highest for enzyme 3 and lowest for enzyme 6. Deleterious substitutions are least common in enzyme 3 and more common in enzymes 4, 5, and 6, although this trend is stronger for the MCT model. Finally, in both models, adaptive substitutions during the equilibrium phase are lower for enzyme 3 than for the other enzymes. Finally, Flux control by branching enzyme 3 is highly variable, but this variability is largely explained by the relative flux through the two branches: when flux through the side branch is relatively high, enzyme 3 has a high CC; by contrast when it is relatively low, enzyme 3 has a low CC and the pattern of control in enzymes 1–6 approaches that of a linear pathway (Fig. S2A, B).
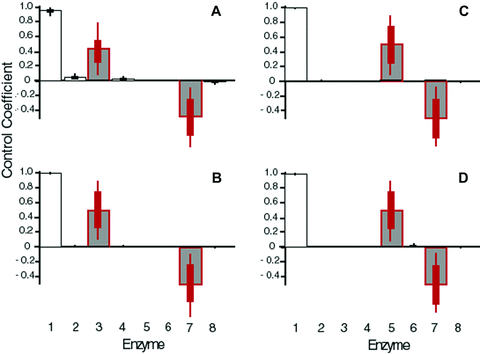
Average flux coefficients for enzymes in long branch simulations. Red bars represent branching enzymes. (A) Long terminal branch pathway, MCT model. (B) Long terminal branch pathway, SK model. (C) Long internal branch pathway, MCT model. (D) Long internal branch pathway, SK model.
Proportion of substitutions in enzymes of focal pathway under long-branch models. Within each group enzymes are ordered enzyme 1–enzyme 6. Values do not sum to 1 because proportions for enzymes 7 and 8 not depicted. These two enzymes exhibited proportions of substitutions similar to enzymes 3 and 4 in the long terminal branch model, and enzymes 5 and 6 in the long internal branch model, respectively. Red bars correspond to branching enzyme. (A) Long terminal branch pathway in MCT model. (B) Long terminal branch pathway in SK model. (C) Long internal branch pathway in MCT model. (D) Long internal branch pathway in SK model.
I next examined a pathway with a longer internal branch (Fig. 1C), which exhibited very similar patterns. In this pathway, enzyme 5 is the branching enzyme. Flux control declines sharply from enzyme 1 to enzyme 4, then increases again with enzyme 5, and falls again in enzyme 6 (Fig. 6C, D). Moreover, flux control by enzyme 5 declines as relative flux through the side branch declines (Fig. S1C, D). Adaptive substitutions during the adaptive phase follow a similar pattern: they decline from enzyme 1 to enzyme 4, rise for enzyme 5, and decline again for enzyme 6. Deleterious substitutions are lower for enzymes 1 and 5 than for the other enzymes (Fig. 7C, D), whereas advantageous substitutions during the equilibrium phase are lower in enzymes 1 and 5 than in the other enzymes (Fig. 7C, D). These patterns are similar to those exhibited by the four-enzyme pathway described above.
Discussion
GENERAL PATTERNS
The simulations reported here suggest that evolution of enzymes in branched pathways conform to a number of generalizations. Because I have examined only a small set of branched pathways, these generalizations should be viewed as tentative pending analysis of other pathway structures, especially pathways with more complex branching structures. Nevertheless, these generalizations conform to intuitive expectations, suggesting that they are likely to apply to other branched pathways.
Flux control evolves to be concentrated at pathway branches
My analyses focused on control of flux down one of two branches in a pathway. For the simple branched pathways I have examined, the pathway enzymes evolve to a pattern of flux control in which the first enzyme exerts the greatest control. Branching enzymes (the first enzymes of the terminal branches) exhibit the second-highest level of control, whereas the remaining enzymes evolve to exert little control. As might be expected, control of flux in the focal branch is negative for the branching enzyme of the side branch, because an increase in the activity of this enzyme will “pull” flux away from the focal branch.
This pattern of flux control conforms to intuitive notions of pathway flux dynamics. For example, it has been argued that proportional allocation of flux to two competing branches is particularly influenced by activities of the branching enzymes (LaPorte et al. 1984;), and a substantial portion of the literature in metabolic engineering focuses on modification of the properties of branching enzymes (Stephanopoulos and Vallinot 1991; Vallinot and Stephanopoulos 1994; Heijnema et al. 2004). The analysis presented here, however, represents the first demonstration that the expected evolutionary outcome is substantial flux control by branching enzymes.
Adaptive substitutions tend to occur at elevated levels in branching enzymes
Eanes and coworkers (Eanes 1999; Flowers et al. 2007) have argued that because flux control tends to be concentrated at pathway branch points, adaptive substitutions will tend to be elevated in branch-point enzymes. The one study that has examined this prediction has provided empirical support (Flowers et al. 2007). My simulations provide theoretical support for this argument. In all simulations, the average number adaptive substitutions during the adaptive phase was substantially higher in the branching enzymes than in either upstream (excluding the first enzyme) or downstream enzymes. As described above, the presumed reason for this pattern is that branching enzymes exert greater flux control than downstream enzymes, and therefore adaptive mutations in the branching enzymes are likely to have a larger selection coefficient and thus have a greater probability of fixation. Results from the constant-environment SK model deviate from this pattern in that the number of substitutions in the enzyme immediately above the branch point was slightly higher than the number in the following branching enzyme. However, this is likely an artifact arising because in many of the trials, the initial CC for the upstream enzyme was equal to or greater than the CC for the branching enzyme. Thus, during the first portion of the adaptive phase, the number of adaptive substitutions in the upstream enzyme is expected to equal or exceed the number in the branching enzyme. If this period constitutes a substantial fraction of the adaptive phase, the observed pattern would be expected. This hypothesis is supported by a lack of this type of deviation from expectation in the fluctuating-environment SK model, in which trials all began with a very low CC for the upstream enzyme and a high CC for the branching enzyme.
This generalization is reversed when fluxes are close to optimal. In this case, there tend to be more adaptive substitutions in the nonbranching enzymes. This pattern presumably reflects Fisher’s (1930) argument on the preferential fixation of small mutations when a population is near an optimum: near the optimum, only mutations of small effect are likely to be adaptive, and nonbranching enzymes, with little control over flux, are more likely to incur mutations of small effect.
Slightly deleterious substitutions tend to occur at reduced levels in branching enzymes
In both the MCT and SK analyses, effectively neutral slightly disadvantageous mutations are fixed less often in branching enzymes than in nonbranching enzymes, both in the adaptive phase and in the equilibrium phase. This pattern presumably arises because flux control is greater in the branching enzymes. Greater flux control means that in general the selective disadvantage associated with a mutation in the branching enzyme will be greater than that for a mutation in the downstream enzymes, which in turn reduces the probability of fixation. A study of substitution rates in the Gibberelin pathway in rice and related species provides empirical support for this pattern by documenting elevated constraint at branch-point enzymes (Yang et al. 2009).
Flux control at branching enzymes is affected by the relative flux down the two pathway branches
In all models and pathways examined, the magnitude of flux control by branching enzymes decreases as a greater proportion of the total flux occurs down the focal branch, whereas control by other enzymes is minimally affected. At very high flux ratios, the CC for the branching enzymes becomes less than that of the immediately upstream enzyme, while remaining higher than those of downstream enzymes. This pattern is the same as that manifested by linear pathways (Wright and Rausher 2010), suggesting that as less flux is directed down the side branch, flux control in the focal pathway approaches that of a linear pathway composed of the same enzymes.
Pathway segments, both internal and terminal, behave like linear pathways in patterns of flux control and substitution
In all models examined, segments between branch points (the initial substrate pool is here considered a branch point) exhibit the same patterns as linear pathways, as described in Wright and Rausher (2010), regardless of the flux ratio. In all segments, flux control on average decreases from the most upstream enzyme of the pathway to the most downstream. In all segments, adaptive substitutions during the adaptive phase decrease from upstream to downstream enzymes. In all segments, slightly deleterious substitutions are lowest in the most upstream enzyme and lower in the downstream enzymes. And finally, in all segments, adaptive substitutions during the equilibrium phase are lowest in the first enzyme and higher in the other enzymes.
LIMITATIONS OF THE ANALYSES
These patterns appear robust across models and across parameter combinations used in the analyses presented here, and thus constitute predictions that can be tested empirically. However, it should also be recognized that there are a number of limitations to these analyses. One major limitation is that I have examined only pathways with the simplest possible topology: a single branch. It is thus not clear whether these patterns also apply to pathways with multiple branches. A second limitation is that the range of parameter space examined was of necessity limited. Although I examined combinations with different values of some of the parameters (i.e., J , J
, J ,
,  ,
,  , and T), for other parameters (i.e., α and
  ) I used only one value. I believe this approach was justified based on experience with modeling linear pathways (Wright and Rausher 2010). In that model, as long as α was less than about 0.05, the patterns that emerged were little affected. Above this value, enzymes began to become less different in either flux control or substitution rates. Because the value of α=0.01 used here is less than 0.05, and because most enzymes have reversibilities much smaller than this, it seems likely that my analyses have captured the patterns associated with enzymes of limited reversibility. Nevertheless, one should be cautious about assuming that the conclusions presented here apply to pathways, such as the glucolysis and gluconeogenesis pathways, in which many enzymes are largely reversible.
In these analyses, I also assumed that α was the same for each enzyme, that is, that all enzymes have the same degree of reversibility, except for the terminal enzyme that is irreversible. This assumption is wrong in most situations and the effects of relaxing it demand further exploration. However, it seems likely that relaxation of this assumption will not greatly change the general patterns described here. In the MCT model, flux CC of the nth enzyme in a segment is proportional to  (see Appendix). If enzymes have different values of α, such that the value for enzyme i is
  , it will be proportional to
  . Consequently, flux CCs and are still likely to decline along the segment as seen in the current analysis. Although no explicit formula exists for the CCs in the SK model, the general similarity of the behavior of the MCT and SK models suggests this argument will also hold for this model. Future analyses are planned to examine the validity of this conjecture.
A final assumption of these analyses is that mutation rates are similar for all genes. While this may often be approximately true for total mutations, it may not be true for adaptive or slightly deleterious mutations. In particular, in different genes, mutations affecting enzyme activity can often differ in the degree of pleiotropy they incur (Streisfeld and Rausher 2011). As a consequence, mutations with an advantageous effect on pathway flux will more likely to be advantageous overall in genes that incur relatively little deleterious pleiotropy. This in turn means that the rate of advantageous mutations will differ among genes that differ in the degree of associated deleterious pleiotropy. In addition, the average selection coefficient for advantageous mutations will be greater for genes that incur relatively little deleterious pleiotropy, leading to a greater probability of fixation (Streisfeld and Rausher 2011). Neither of these effects is captured by the models examined here, but must be considered, when testing the predictions derived from those models, as other processes affecting substitution rates.
The results of the analyses described here apply only to pathways in which both branches are simultaneously active. They do not necessarily apply to situations in which different branches of a pathway are active at different times or in different tissues. In this situation, the active branch, along with upstream enzymes, functions as a linear pathway and should evolve to exhibit flux-control and substitution patterns characteristic of linear pathways (Wright and Rausher 2010). One possible exception to this generalization may occur when enzyme activities of the internal segment of the pathway are not free to evolve independently. Such a situation may arise, for example, when the same transcription factor activates the pathway whether one or the other branch is active, or when the same cis-regulatory element controls expression of these genes. In this type of situation, it is likely that evolution of pathway genes will not be described by either the unbranched model of Wright and Rausher (2010) or the branched model described here.
Conclusions
There has recently been a renewal of interest in developing a theory of adaptation that predicts and explains characteristics of adaptive substitutions (see Orr 2005 and references therein). One feature of such a theory that has received relatively little attention is understanding the degree to which specific genes are likely to contribute to adaptive evolutionary change. The analyses presented here suggest that there are general rules for how the position of an enzyme in a metabolic pathway affects the probability that that enzyme will incur both adaptive and slightly deleterious substitutions. These rules afford some predictability about the relative involvement of different genes in adaptation and in nearly neutral evolution, although patterns of substitution will doubtless also be influenced by other processes such as differences in pleiotropy and mutation rates. Moreover, these predictions provide a set of null hypotheses that can guide empirical investigations of the evolution of patterns of flux control and substitution rates in pathway gene.
Associate Editor: R. Bürger
ACKNOWLEDGMENTS
I thank the Rausher lab group for insightful comments on the analysis and Kevin Wright for comments on the manuscript. Supported by National Science Foundation grant DEB 0814858.
Appendix
In this appendix, I describe the details of the models used in our analysis.
METABOLIC CONTROL THEORY MODEL
General approach for arbitrarily branched pathways
Although there are a number of general treatments of the application of metabolic control theory to arbitrarily branched pathways, I am not aware of any that explicitly relate flux Control Coefficients (CCs) to enzyme kinetic parameters. Consequently, I first provide a general treatment for calculation of flux coefficients in branched pathways.
 ((A1))
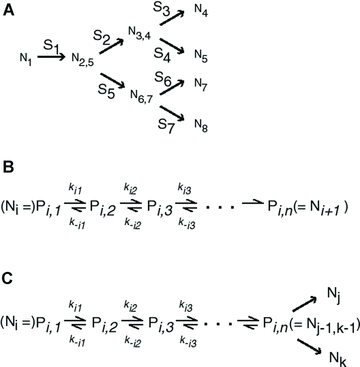
Annotation for pathway enzymes for different pathway segments. (A) A pathway consisting of seven segments. Segments are labeled S1 through S7. The nodes subtending these segments (N1 through N8) are either initial substrate (N1), intermediate products (N , N
, N , N
, N ), or final products (N4, N5, N7, N8). Segments subtended by two internal nodes (including N1) are “internal” segments. Segments subtended by an internal node and a final product are “terminal” segments. The double subscripts indicate that the node represents the initial intermediate product for more than one segment, for example, N
 is the initial intermediate product for segments S2 and S5. Node N
 can be referred to as either N
 (node i) or N
 (node j), depending on context. (B) Set of reactions and intermediate products comprising terminal segment S
 . Intermediate products are P
 , P
, P , …, P
 . P
. P is final product (equivalent to N
 ). k
). k and k
and k are forward and reverse reaction rates for jth reaction of segment i. (C) Set of reactions and intermediate products comprising an internal segment S
 .
.
 are concentrations of intermediate substrates (see Fig. A.1 b), k
 and k
and k are the rates of the forward and reverse reactions of enzyme j of segment i (Kacser and Burns 1973). If the segment is a terminal segment, I assume that the term in parentheses in the last equation is absent, corresponding to a situation in which the final product is sequestered as soon as it is produced. As an additional simplification, I also assume that α= k-
 /k
/k is the same for all genes (Wright and Rausher 2010). Note that α is a thermodynamic constant equal to the reversibility of the catalyzed reaction, that is α= k-
 /k
/k =
=  , where K
 is the equilibrium constant of the reaction (Kacser and Burns 1973). I also define for each segment a flux constant, F, such that for segment i,

where J is the flux through segment i at flux steady state, P
 is the steady-state concentration of the substrate at the beginning of segment i, and F
 is the flux constant for segment i.
 ((A2))
where n is the number of enzymes in the segment. Thus, for any terminal segment i, F i .
i .
 and J
and J be the fluxes of the two branches that the internal branch subtends (Fig. A.1 c). Then, J
 P
P F
F P
P F
F (because P
 and P
and P refer to the same substrate (Fig. A.1 c). Similarly J
 P
P F
F P
P F
F . Conservation of flux at steady state then means
 ((A3))
 ((A5))
 ((A6))
 so that
 ((A7))
 . This is accomplished in two phases: The first is a “downpass” phase, in which one begins with the terminal segments and proceeds toward the initial segment calculating the flux constants, F
 . The second is an “uppass” phase, in which one calculates fluxes. I illustrate this approach using the pathway in Fig. A.1 a. Beginning with the terminal segments, equation A2 gives


where n is the number of enzymes in segment i.


 times the flux through segment 1,


 , so
, so


In general, any terminal segment i is associated with a set of internal segments η= {k, l, …} which represent the path from P11 to final product P of segment i. Then the flux through the terminal segment is the initial substrate concentration times the product flux constants of each of the segments in that pathway (including the terminal segment) divided by the product of the sums of the flux constants for the segments subtending each internal segment in the pathway.
ANALYSIS FOR SIMPLE BRANCHED PATHWAY ANALYZED IN TEXT


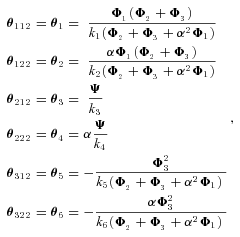
CALCULATION OF FLUX CCs
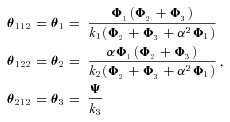
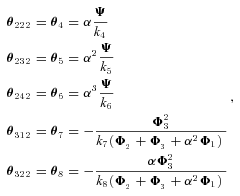
 , is thus



MICHAELIS–MENTEN (SATURATION KINETICS) MODEL
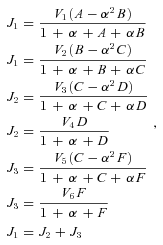
where J is the flux down segment i, V
 is the maximum velocity of enzyme i, and A, B, … are the steady state concentrations of the intermediates. Here, we assume for simplicity that for each enzyme, the forward association and disassociation rate constants for the corresponding enzyme–substrate complex are equal.
For a given set of maximum velocities (V ), the flux down each branch is determined by solving this set of seven equations in seven unknowns. Because these equations are nonlinear, I could not obtain an analytical solution. Consequently, the solution was determined numerically by the Newton method. The convergence criteria was that the sum of the squared differences between the left- and right-hand sides of the above equations was less than 0.000001.
Because analytical expressions for the flux CCs,  , also could not be obtained, these were also determined numerically as
 . I calculated ΔV
 as V
as V −0.999V
 and
and  as J
as J − (value of J corresponding to 0.999V
 , with all other V
 the same).
FITNESS CALCULATION
 and J
and J are the optimal fluxes down branches 1 and 2, respectively, overall fitness was
 ((A8))
 . Because high concentrations of intermediates are likely to be deleterious, I follow Clark (1991) and introduce a fitness penalty for high substrate pools. In particular, I introduce a parameter T, which represents the intensity of selection against substrate accumulation. Fitness is then modeled as

Under this formulation, when B + C+ D+ F is small relative to T, fitness is approximately that given by equation (A8). However, when B + C+ D+ F is large relative to T, fitness approaches 0.
FIXATION PROBABILITY
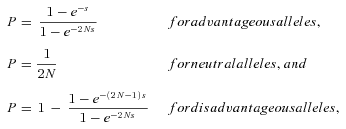
where N is population size and the selection coefficient s is determined from the difference in fitness of the current genotype and the new mutant (Hedrick 2000). These equations assume that there is no dominance, that is, that the fitness of the heterozygote is the average of the homozygote fitnesses. Because the overall reaction rate in a heterozygote is likely to be the sum of the rates for each individual allele, the assumption of no dominance at the kinetic level is probably appropriate. Moreover, unless the effects of mutation are very large, absence of dominance at the kinetic level is not expected to generate dominance in flux (Keightley 1996). This in turn means that the fitness of the heterozygote will be approximately the average of the two homozygote fitnesses, because fitness changes approximately linearly with flux if mutations are not large. It thus seems that the assumption of no dominance in fitness is reasonable to a first approximation.


 in terms of P


