Application of Raman Spectroscopy and Surface-Enhanced Raman Scattering to the Analysis of Synthetic Dyes Found in Ballpoint Pen Inks*
Funding was provided by the Department of Justice Award No. 2006-DN-BX-K034; the City University Collaborative Incentive Program Award No. 80209 and PSC-BHE Faculty Research Award Program; National Science Foundation under Cooperative Agreement No. RII-9353488, Grants No. CHE-0091362, CHE-0345987, ECS0217646, IMR 0526926; the Andrew W. Mellon Foundation, the David H. Koch Family Foundation.
Abstract
Abstract: The applicability of Raman spectroscopy and surface-enhanced Raman scattering (SERS) to the analysis of synthetic dyes commonly found in ballpoint inks was investigated in a comparative study. Spectra of 10 dyes were obtained using a dispersive system (633 nm, 785 nm lasers) and a Fourier transform system (1064 nm laser) under different analytical conditions (e.g., powdered pigments, solutions, thin layer chromatography [TLC] spots). While high fluorescence background and poor spectral quality often characterized the normal Raman spectra of the dyes studied, SERS was found to be generally helpful. Additionally, dye standards and a single ballpoint ink were developed on a TLC plate following a typical ink analysis procedure. SERS spectra were successfully collected directly from the TLC plate, thus demonstrating a possible forensic application for the technique.
Raman spectroscopy can be useful for characterizing and discriminating inks based on their composition. It has been applied extensively to the analysis of a variety of inks including iron gall ink (1), lithographic ink (2), gel pen ink (3), and ballpoint ink (4,5). A variant of the technique, surface-enhanced Raman scattering (SERS) has also recently found its niche in ink analysis and has been used for ballpoint ink (6,7) and inkjet dye evaluations (8).
The major advantages of Raman include small sample size requirements, minimal sample preparation, and the lack of chemical or mechanical pretreatments (9). Raman spectroscopy has been found to be applicable for the analysis of several dye classes including azo (10) and arylmethane (11). Additionally, studies of various dyes have been conducted and the results have revealed excellent reproducibility for the technique (12,13). However, fluorescence interference and low sensitivity are a common problem, and they can often result in poor analytical performance.
SERS is becoming increasingly popular for the identification of organic dyes as it can quench fluorescence and provide enhanced signal, all of which ultimately lead to improved detection limits (14). Due to increased sensitivity and consequent ability to use only minimal samples, it can be considered a minimally destructive technique. The possibility of using SERS directly in situ on artwork and on thin layer chromatography (TLC) plates has been demonstrated in a few selected cases (15,16). SERS has been successfully used to obtain the spectra of natural and synthetic dyes of several classes and colors (17–20). Additionally, a study that focused on the separation of dyes found surface-enhanced resonance Raman scattering to be an effective technique in differentiating analytes with similar structures (21). The aim of this study was to compare normal Raman (NR) and SERS techniques for the analysis of dyes commonly found in ballpoint inks (22) to determine if the techniques are feasible for the forensic analysis of writing inks.
Materials and Methods
Dyes
Ten dyes representing classes commonly found in ink formulations were selected for the study: Acid Blue 1 (Sigma-Aldrich, St. Louis, MO: 198218), Acid Orange 10 (Sigma: O7252), Acid Red 52 (Fluka Biochemika, Buchs, Switzerland: 86183), Aniline Blue (Ward’s Natural Science Establishment, Rochester, NY: 38W7001), Crystal Violet (Sigma: C6158), Methyl Violet (Fluka Biochemika: 69710), Pararosaniline (Sigma: P3750), Rhodamine B (Fisher Scientific, Boston, MA: R21), Sudan Black B (Fisher Scientific: BP109), and Victoria Blue B (Sigma: V0753).
Normal Raman Setup and Dye Analysis
The Raman spectra were obtained with both dispersive and Fourier transform (FT) instruments. A Senterra Raman microscope (Bruker Optics Inc., Billerica, MA) with 100× long working distance objective, 1200 and 1800 rulings/mm holographic gratings, and charge-coupled device detector was used for dispersive analysis. This system was employed with a 633 nm helium/neon and a 785 nm diode lasers. A Raman II FT-Raman (Bruker Optics Inc.) spectrometer with a liquid nitrogen cooled germanium detector and a 1064 nm Nd/YAG laser was used for FT-Raman spectroscopy.
The NR spectra were obtained for pure powder samples using the microscope setup. The majority of the spectra were obtained using the following conditions: 3–5 cm−1 resolution (1800 rulings/mm grating), 30 sec integration time, and 10 mW power for the 633 nm laser and 3–5 cm−1 resolution (1200 rulings/mm grating), 30 sec integration time, and 50 mW power for the 785 nm laser. FT-Raman spectra at 1064 nm were obtained in a macroconfiguration. A 2-mm sample holder was used in back scattering mode, with acquisition conditions set at: 4 cm−1 resolution, 200 scans, and 50 mW. The laser power was decreased if the analyte fluorescence was overwhelming the spectrum and preventing resolution and identification of the peaks.
SERS Setup and Dye Analysis
The dispersive Raman system was used with the 633 and 785 nm lasers and the instrument parameters were the same as those used for NR. Measurements were obtained by focusing through the test drops deposited on the surface of the microscope slides. The drops were prepared by placing 1 μL of silver colloid on a slide, followed by 0.5 μL of the dye solution, and then 1 μL of 0.5 M potassium nitrate.
The silver colloid was prepared by the reduction of silver nitrate with sodium citrate in ultrapure water following the procedure outlined by Lee and Meisel (23). The colloid was concentrated by centrifugation for 2 min at 2240 × g followed by removal of the supernatant. The dye solution was prepared by dissolving a few dye crystals in 0.5 mL of methanol. All the glassware was cleaned with a cleaning solution, rinsed with ultrapure water, washed with acetone, and allowed to dry.
TLC Separation and Dye Analysis
The Paper Mate® Xtend™ medium blue ballpoint pen was used to draw asterisks c. 0.5 cm in diameter on Whatman #1 filter paper (Whatman Inc., Florham Park, NJ). The individual asterisks were then extracted with 0.5 mL of ethanol, and c. 2 μL of the solution was spotted on a Whatman #4410–221 silica gel TLC plate (Whatman Inc.). The plate was developed in 70:35:30 mixture of ethyl acetate:ethanol:water per ASTM International Guide E 1422–05 (24).
The SERS of the separated dye spots were obtained using the dispersive system equipped with the 785 nm laser, and the instrument parameters remained the same as for NR spectra. The spectra were obtained by placing 0.1 μL of silver colloid on the dye spot on the TLC plate, then adding 0.1 μL of 0.5 M potassium nitrate, and focusing directly on the plate. The results were compared with the standard dye spectra obtained by the SERS method. The corresponding dye standards and the ink extraction were analyzed using TLC. The retention factors (Rf) for the dye spots from the extraction and the dye standards were calculated and compared with each other to confirm the presence of the dye in the ink.
Results and Discussion
Normal Raman spectra were obtained for all the dyes with three different laser wavelengths. Based on the evaluation of all of the results, it was determined that only the FT system with the 1064 nm Nd/YAG laser performed consistently. All of the 1064 nm spectra had excellent signal intensity and signal to noise ratios. Spectra are displayed in 1-10 as follows: Acid Blue 1 (Fig. 1), Acid Orange 10 (Fig. 2), Acid Red 52 (Fig. 3), Aniline Blue (Fig. 4), Crystal Violet (Fig. 5), Methyl Violet (Fig. 6), Pararosaniline (Fig. 7), Rhodamine B (Fig. 8), Sudan Black B (Fig. 9), and Victoria Blue B (Fig. 10). All spectra were manually normalized for ease of comparison. No background subtraction or other spectral manipulations were performed.
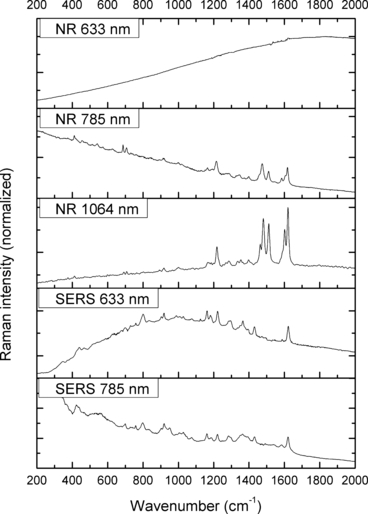
—Normal Raman (NR) and surface-enhanced Raman spectra (SERS) of Acid Blue 1.
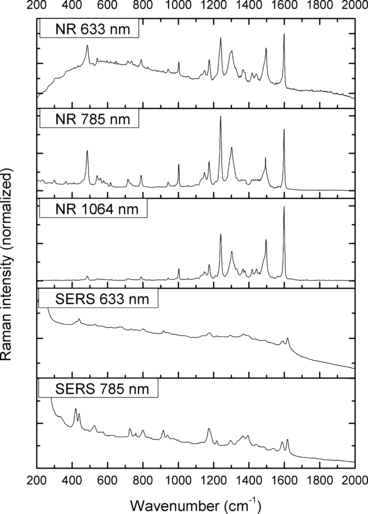
—Normal Raman (NR) and surface-enhanced Raman spectra (SERS) of Acid Orange 10.
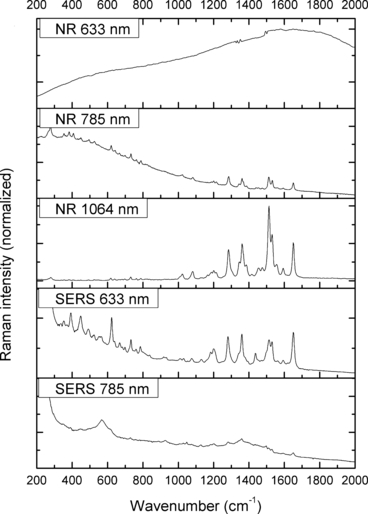
—Normal Raman (NR) and surface-enhanced Raman spectra (SERS) of Acid Red 52.
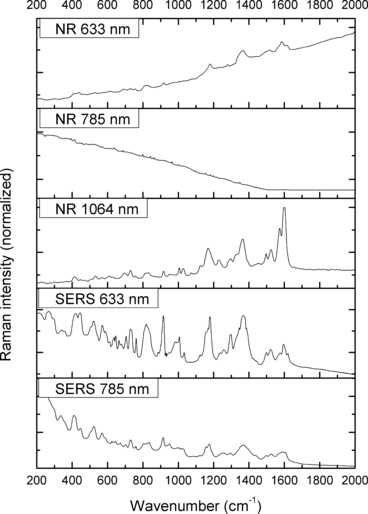
—Normal Raman (NR) and surface-enhanced Raman spectra (SERS) of Aniline Blue.
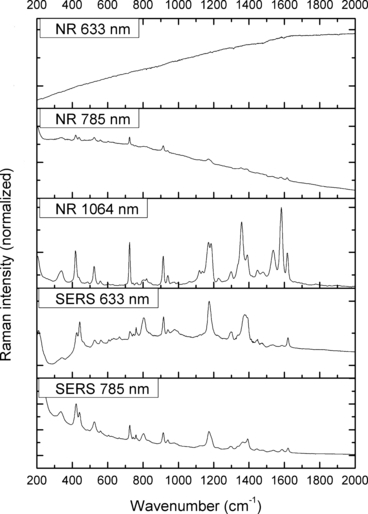
—Normal Raman (NR) and surface-enhanced Raman spectra (SERS) of Crystal Violet.
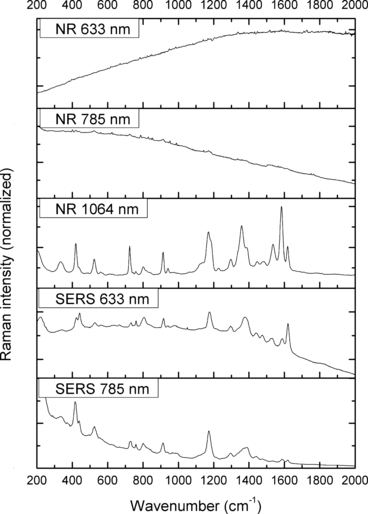
—Normal Raman (NR) and surface-enhanced Raman spectra (SERS) of Methyl Violet.
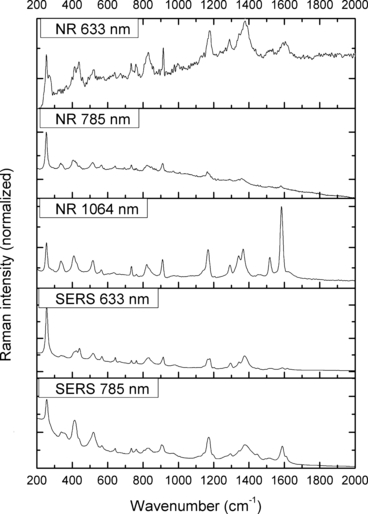
—Normal Raman (NR) and surface-enhanced Raman spectra (SERS) of Pararosaniline.
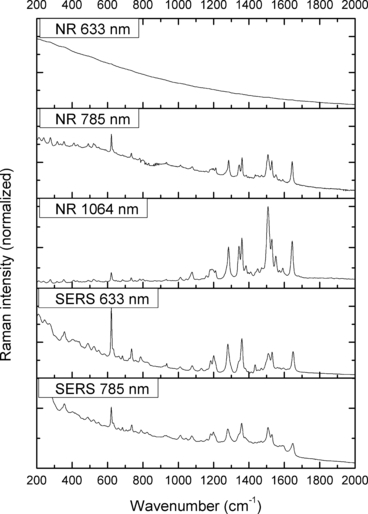
—Normal Raman (NR) and surface-enhanced Raman spectra (SERS) of Rhodamine B base.
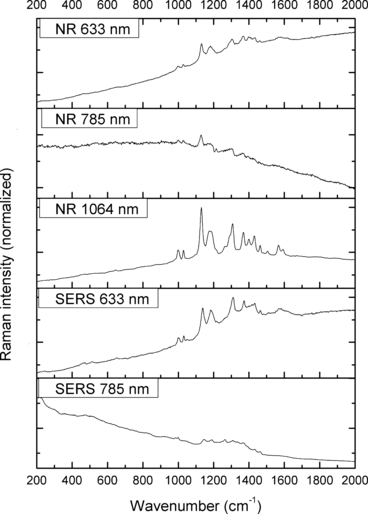
—Normal Raman (NR) and surface-enhanced Raman spectra (SERS) of Sudan Black B.
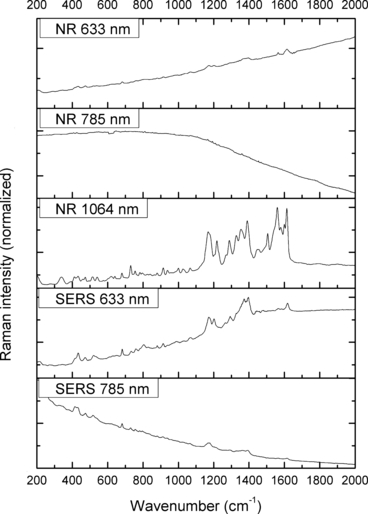
—Normal Raman (NR) and surface-enhanced Raman spectra (SERS) of Victoria Blue B.
The spectra obtained with the 633 and 785 nm lasers differed dramatically in their signal clarity for each of the dyes. Additionally, high levels of fluorescence were observed in all of the 633 nm spectra. Only Acid Orange 10 (Fig. 2) responded well to both laser wavelengths showing consistent peaks of high intensity. The 633 nm laser proved superior in performance over the 785 nm wavelength for Aniline Blue (Fig. 4), Sudan Black B (Fig. 9), and Victoria Blue (Fig. 10). These results could be explained by a resonance Raman enhancement (25), as the three dyes were similar in their deep blue color. The 785 nm laser provided clear spectra for the rest of the analytes including both blue-colored dyes, Acid Blue 1 (Fig. 1), and red-colored dyes, Acid Red 52 (Fig. 3) and Rhodamine B (Fig. 8). Overall, the results contained enough individualizing peaks to easily differentiate the dyes. The exceptions were the spectra of Crystal Violet (Fig. 5) and Methyl Violet (Fig. 6) which were extremely similar but so were the molecular structures of the compounds differing only in the number of methyl groups.
With the use of the 633 and 785 nm lasers, excellent SERS were obtained for all the dyes. There was c. a 4-fold increase in signal intensity observed with the 633 nm laser; however, Pararosaniline (Fig. 7) presented higher intensity spectra with the 785 nm laser. The NR and SERS spectra were found to be different in the intensities of individual peaks (e.g., Fig. 4, 917 cm−1 peak), and the appearance of certain peaks in only one type of the spectrum (e.g., Fig. 2, 1618 cm−1 peak). Additionally, some peak shifts between NR and SERS were observed (e.g., Fig. 8, 1280–1284 cm−1 peak). These peak variations are explained by selection rules dictating which molecular bonds are Raman and SERS active (25). It must be noted that the SERS spectra were obtained from dilute solutions of the dyes as opposed to the solid samples used for NR measurements. The fact that good quality Raman spectra were obtained in these conditions is an indication of the signal enhancement obtained with SERS.
The TLC analysis showed that the Methyl Violet standard separated into three spots on the plate while the ink extraction presented only two spots corresponding to Methyl Violet in color, Rf values, and SERS spectra. Such results were probably due to different combinations of the demethylated pentamethyl Pararosaniline found in both the standard and the ink. The SERS of the ink dyes obtained from the TLC plate (Fig. 11) contained high intensity peaks and were consistent with the SERS spectra of the Methyl Violet standard (6, 11).
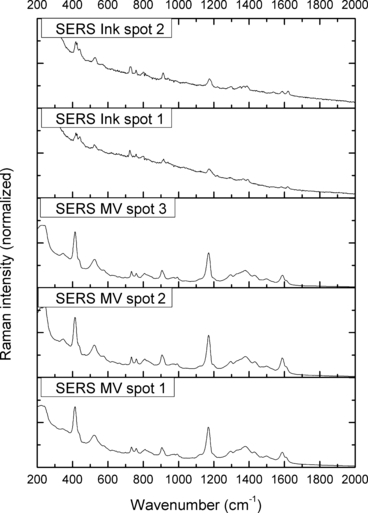
—Surface-enhanced Raman spectra (SERS) of dyes thin layer chromatography separations. MV, Methyl Violet.
Conclusions
This study has demonstrated that high quality dye spectra can be obtained from pure dye samples with NR spectroscopy by carefully selecting the excitation frequency, but SERS consistently provided significant signal enhancement and fluorescent quenching for ballpoint ink dyes. Three laser wavelengths were evaluated, and for NR, the best results were observed when using the 1064 nm Nd/YAG laser. SERS spectra of equally high quality were obtained with the 633 and 785 nm lasers. Although fluorescence was a factor in the 633 nm NR spectra, it was mitigated with the use of SERS ultimately allowing for successful data collection.
The SERS spectra obtained after the ballpoint ink dyes and the reference dyes were developed on a TLC plate showed a high level of consistency with the standard dye spectra obtained with the drop method and on the TLC plate. Overall, the study successfully showed the applicability of NR spectroscopy and SERS to the analysis of synthetic dyes found in ballpoint inks. As only a single pen was used for this study, evaluation of dye components of an array of inks from different manufacturers would be valuable in establishing dye variations between manufacturers and batch-to-batch. Further studies should investigate additional dyes and pigments (e.g., phthalocyanines) and consider other ink components (e.g., vehicles, lubricants).
Acknowledgments
The study would not have been possible without the guidance, support, and encouragement of Dr. Thomas A. Kubic and Dr. Maria Vega Cañamares.


