SIZE INCREMENTS DUE TO INTERINDIVIDUAL FUSIONS: HOW MUCH AND FOR HOW LONG?1
Received 20 October 2008. Accepted 28 January 2010.
Abstract
Size increments following interindividual fusions appear as a general benefit for organisms, such as coalescing seaweeds and modular invertebrates, with the capacity to fuse with conspecifics. Using sporelings of the red algae Gracilaria chilensis C. J. Bird, McLachlan et E. C. Oliveira and Mazzaella laminarioides (Bory) Fredericq, we measured the growth patterns of sporelings built with different numbers of spores, and the magnitude and persistence of the size increments gained by fusions. Then we studied three morphological processes that could help explain the observed growth patterns. Results indicate that in these algae, coalescence is followed by immediate increase in total size of the coalesced individual and that the increment is proportional to the number of individuals fusing. However, the size increments in sporelings of both species do not last >60 d. Increasing reductions of marginal meristematic cells and increasing abundance of necrotic cells in sporelings built with increasing numbers of initial spores are partial explanations for the above growth patterns. Since sporelings formed by many spores differentiate erect axes earlier and in larger quantities than sporelings formed by one or only a few spores, differentiation, emergence, and growth of erect axes appear as a more likely explanation for the slow radial growth of the multisporic sporelings. Erect axis differentiation involves significant morphological and physiological changes and a shift from radial to axial growth. It is concluded that the growth pattern exhibited by these macroalgae after fusion differs from equivalent processes described for other organisms with the capacity to fuse, such as modular invertebrates.
Abbreviation:
-
- SFC
-
- seawater filtered medium C
The phenomenon of fusion between conspecifics is well documented in nature and has been reported in members of at least nine phyla of protists, animals, and land and marine plants (see Buss 1982 and Rinkevich 2005 for reviews). An immediate increase in the size of the organism is the most important benefit associated with these fusions (Grosberg and Quinn 1986, Rinkevich and Weissman 1992, Maldonado 1998, Santelices et al. 1999, 2004, Foster et al. 2002, Hughes 2002, Rinkevich 2005).
Size increments seem to be especially important during early recruitment because they may enhance performance in competition for space and decrease the probability of being dislodged by water impact or being consumed by grazers or predators (Maldonado 1998, Santelices et al. 2004, Rinkevich 2005). Consistent with this prediction, studies of cohorts of sporeling populations of coalescing macroalgae indicate that the survival probabilities of germlings increase with increasing size (Santelices and Alvarado 2008).
However, the nature of the size increments among organisms capable of fusing is not well understood. In the case of coalescing macroalgae, the results seem contradictory. For example, sporeling masses derived from the coalescence of many spores do not exhibit areas as large as the addition of an equivalent number of unisporic germlings of the same age (Muñoz and Santelices 1994, Santelices et al. 1999). Therefore, the size increments due to coalescence do not seem to be strictly additive and long lasting. In addition, since coalescence increases sporeling size, it would be expected that in any given sporeling cohort, the largest individuals would always correspond to multisporic, coalescing plants. Monitoring a 60 d old cohort of 2,158 sporelings showed this to be only partially true (Santelices and Alvarado 2008). Variability in sporeling size was great, and some unisporic sporelings reached larger sizes than their multisporic counterparts.
No clear explanation exists for the above findings. Since several kinds of growth costs have been described for colonial invertebrates and slime molds as a consequence of conspecific fusions (Buss 1982, Rinkevich and Weissman 1992, Maldonado 1998, Foster et al. 2002, Rinkevich 2005), Santelices and Alvarado (2008) suggested that equivalent cost processes might be occurring among coalescing red algae, but that idea has yet to be explored.
In this study, to evaluate the magnitude and persistence of the size differences due to spore or sporeling fusion, we measured the growth pattern, under controlled conditions, of sporelings resulting from different numbers of spores. Then, we explored three morphological processes that could help to explain the growth patterns observed. Most coalescing sporelings have crustose morphologies with marginal meristems (see Santelices et al. 1999). Since cells in the borders of the sporelings are involved in the fusion processes, we quantified the changes in the number of meristematic cells due to coalescence in sporelings with increasing number of initial spores. Next, we measured the mortality of internal cells in the above sporelings. Death of internal cells with the formation of necrotic interphases has been described (Santelices et al. 2003a,b) in interspecific encounters of coalescing species, and it could also occur among sporelings with increasing number of initial spores due to intrasporeling compression. Finally, we measured the timing of primordium and erect axis formation in the different kinds of sporelings. The crustose-to-erect thallus transition of macroalgae is recognized as an important morphological change that involves a shift from predominantly radial growth to axial growth. It is known that the number and timing of erect axis formation can be modified by the number of spores coalescing during recruitment (Santelices et al. 1996, 1999), but the precise patterns found in plants built with different numbers of spores is still unknown. In this study, we measured the time to differentiation and formation of erect axes as a function of the number of initial spores forming the sporeling, thereby quantifying the effects of spore number on the timing of the crustose-to-erect thallus transition.
Materials and Methods
Carpospores and carposporelings of G. chilensis and M. laminarioides were used for this study. Fertile thalli of G. chilensis were collected in Maullin, southern Chile (41º36′ S, 73º30′ W), in December 2006, while fertile thalli of M. laminarioides were gathered in June 2007 in Maitencillo (32º39′ S, 71º29′ W), central Chile. Collected thalli were maintained at 4°C in coolers for 3–6 h during transportation to the laboratory. There, thalli were washed with running tap water and maintained for 24 h in filtered seawater under constant temperature (14 ± 2°C), irradiance (20 ± 10 μmol photons · m−2 · s−1), and photoperiod (12:12 light:dark [L:D]). After dehydrating fertile thalli for 24 h at room temperature (15 ± 2°C), sporulation was induced by immersing mature cystocarps in microfiltered seawater (0.45 μm).
Growth studies. Carpospores released by several conspecific mature cystocarps were mixed and deposited in close proximity (30–60 μm of interspore distance) on a plastic coverslip (EMS 72260, Electron Microscopy Sciences, Washington, D.C., USA). The number of spores placed on each coverslip varied from one to 20 (treatments of one, two, five, 10, 15, and 20 coalescing spores). A total of 40 replicates per treatment were prepared. Occasionally, one or a few spores in a group did not germinate, and the corresponding replicate was eliminated from the study. Thirty replicates per treatment were followed during the incubation period. Ten of these were used to measure growth rates and growth patterns for a period of 30 d. The other 20 were used for histological and morphological studies (see below).
Coverslips (replicates) were individually incubated in petri dishes (50 × 10 mm) filled with seawater filtered medium C (SFC) culture medium (Correa and McLachlan 1991), replaced every 3 d, and maintained under controlled culture conditions of temperature (14º±2°C [mean ± standard error of the mean, here and elsewhere]), irradiance (45 ± 10 μmol photons · m−2 · s−1), and photoperiod (12:12 L:D). Germination rate (percent) was measured after 24–48 h of incubation, and sporeling growth was recorded at days 7, 15, 21, and 29. At each monitoring time, a photographic image of each sporeling was taken using a Cool Snap-Pro camera (Media Cybernetics, Silver Spring, MD, USA) mounted on a stereomicroscope (Nikon SMZ-10A; Nikon, Melville, NY, USA). The area of each sporeling crust was calculated using Image Pro Plus v 4.5 (Media Cybernetics). Growth data for each sporeling group were plotted as a function of time. Regression values were calculated after log (neperian) transformation.
Assuming that the number of spores contributing to sporelings is directly proportional to growth in area, we calculated the increase in area of multispore crusts by multiplying the corresponding intercept value of each multisporeling group (obtained in the observed growth curve) by the slope of the reference (one-spore sporelings). The resulting curves were then compared to the observed growth curves to calculate the cost of coalescence for each type of sporeling.
Histological and morphological studies. Sporelings were fixed for histological analysis. Fixation procedures followed the protocol described in previous studies (Santelices et al. 1996, 1999, 2004). Postfixation was carried out in an osmium-potassium ferricyanide mixture, followed by dehydration and embedding. Infiltration and inclusion were performed in Spurr resin. Thin sections (500 nm) were stained with 0.25% toluidine blue O in 0.25% sodium borate and mounted in Permount (Fisher Scientific, Pittsburgh, PA, USA).
Number of meristematic cells: At day 10 after germination, two replicates of each treatment were fixed and mounted. Free-marginal cells forming the sporeling meristem were counted and defined as total number of marginal cells. Dividing the above total number by the original number of spores forming the coalescing sporeling yields the average number of marginal cells per original spore. After coalescence and as a consequence of the fusion process, a variable number of marginal cells become submarginal or central cells in the coalescing sporeling. As a consequence, there is a perimeter reduction in the coalescing sporeling compared to the addition of individual perimeters of an equivalent number of unisporic germlings of the same age. This expected value was compared to the observed value, and the difference expected correlated with the number of initial spores forming the sporeling (Sokal and Rohlf 1981).
Mortality of cortical and medullary cells: Six replicate sporelings of each treatment were fixed at day 38. After fixation, they were serially sectioned. Three sections, each 15 μm away from the other, were stained and mounted for analysis. Aided with a lens ruler, 10 evenly spaced transects were projected on each sporeling. All cells falling underneath each transect were counted. The percent abundance of necrotic cells was calculated for each section. All section values per sporeling were averaged, and the sporeling average of necrotic cells correlated with the number of spores initially forming the sporelings (Sokal and Rohlf 1981).
Timing of formation and abundance of erect axes: Formation of primordia of erect axes in 10 sporelings was assessed after 20 and 30 d of growth. Primordia were defined as buds on the sporeling surface, while erect branches were defined as surface projections longer than 200 μm with a well-defined multiaxial tip. At each monitoring time, we counted the number of sporelings with primordia or differentiated erect axes out of the total number of replicate sporelings (n = 10) per treatment. Each time, five sporelings were sectioned to verify the structure of the primordia or the erect axis formed. The probability of formation of primordia or erect axis as a function of the original number of spores was evaluated using multinomial logistic regression (Proc. Logistic, SAS Institute, Hosmer and Lemeshow 2000).
Results
Growth patterns in different types of sporelings. Spore fusion in G. chilensis resulted in marked instantaneous increments in total sporeling area (Table 1). However, as time passes, the size difference between treatments becomes progressively smaller (Fig. 1a, Table 2). At day 1, 20-spore sporelings were 10.8 times larger than 10-spore sporelings, which, in turn, were 9.1 times larger than 1-spore sporelings. By day 15, these differences have decreased to 2.5 and 4 times, respectively, and by day 30, differences have reduced further to 1.6 and 3.0 times, respectively.
| Number of coalescing spores | Gracilaria chilensis | Mazzaella laminarioides | ||
|---|---|---|---|---|
| Sporeling area (mean μm2 ± SE) | Increment (times) | Sporeling area (mean μm2 ± SE) | Increment (times) | |
| 1 | 1,670 ± 60.5 | 1.00 | 533 ± 15.7 | 1.00 |
| 2 | 3,055 ± 117.0 | 1.85 | 973 ± 37.2 | 1.82 |
| 5 | 8,196 ± 1,066.8 | 4.97 | 2,337 ± 67.6 | 4.38 |
| 10 | 14,938 ± 979.8 | 9.06 | 4,237 ± 161.5 | 7.97 |
| 15 | 21,336 ± 916.9 | 12.93 | 6,232 ± 181.9 | 11.68 |
| 20 | 32,812 ± 2,460.2 | 19.89 | 8,574 ± 281.1 | 16.07 |
- The term “increment” refers to sporeling area relative to one-spore sporelings.
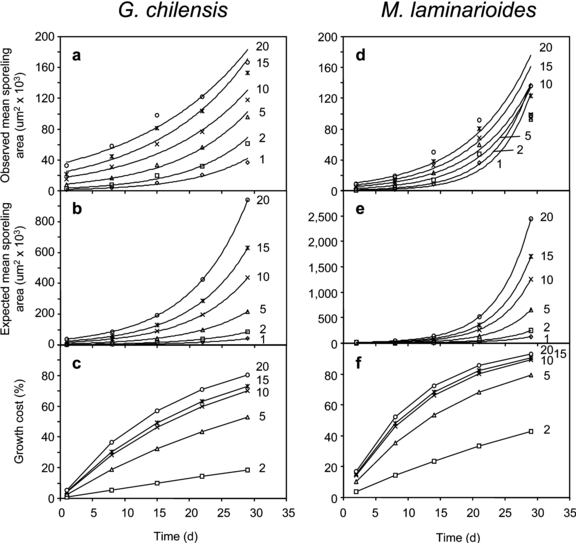
Observed and calculated growth in area of sporelings resulting from one to 20 initial spores over 30 d for Gracilaria chilensis and Mazzaella laminarioides formed by different number of initial spores. (a and d) Observed increase in area of crusts. Regression values are in Table 2. (b and e) Calculated increase in area of crusts based on values extrapolated from unisporic crust growth rates. (c and f) Cost of growth calculated from the difference between observed and calculated growth values.
| No. of spores forming the sporeling | Regression equation | r 2 value |
|---|---|---|
| G. chilensis | ||
| 1 | y = 1,702.6e0.1081x | 0.9879 |
| 2 | y = 3,343.4e0.1023x | 0.9839 |
| 5 | y = 8,219.7e0.0862x | 0.9934 |
| 10 | y = 16,431.5e0.0709x | 0.9633 |
| 15 | y = 24,283.7e0.0665x | 0.9602 |
| 20 | y = 35,789.4e0.0560x | 0.9646 |
| M. laminarioides | ||
| 1 | y = 442.69e0.1946x | 0.9841 |
| 2 | y = 856.18e0.1754x | 0.9723 |
| 5 | y = 2,303.8e0.1400x | 0.9521 |
| 10 | y = 4,439.8e0.1172x | 0.9449 |
| 15 | y = 6,026.9e0.1126x | 0.9623 |
| 20 | y = 8,656.3e0.1024x | 0.9539 |
Calculation of the expected area increments for each sporeling group (Fig. 1b) yield values that at day 30 were 1.5 (2-spore sporelings) and 4.5 times (20-spore sporelings) larger than the observed value. The difference between the observed and the expected value corresponds to the cost of coalescence on growth, a percentage that increases with the number of spores forming the sporeling and with development time (Fig. 1c).
Using the regression equation (Table 2) of the observed growth curves (Fig. 1a), it is possible to predict the age at which the different types of sporelings would reach a similar size (Table 3). All but two treatments would reach a similar disk diameter between 35 and 63 d of growth (Table 3). Although 5- and 10-spore sporelings attain a size equivalent to that of 10- and 20-spore sporelings earlier than 1-spore sporelings, the sequence is not strictly related to the original number of spores contributing to the sporelings.
| G. chilensis | M. laminarioides | ||
|---|---|---|---|
| No. of initial spores in the sporeling | Converging age (d) | No. of initial spores in the sporeling | Converging age (d) |
| 20–15 | 35.3 | 5–2 | 28.0 |
| 10–5 | 44.4 | 10–2 | 28.3 |
| 10–2 | 47.7 | 10–5 | 28.8 |
| 20–5 | 48.0 | 10–1 | 29.8 |
| 20–2 | 48.9 | 5–1 | 30.2 |
| 5–2 | 50.4 | 15–2 | 31.1 |
| 20–10 | 51.8 | 20–2 | 31.7 |
| 15–2 | 53.0 | 15–1 | 31.8 |
| 20–1 | 54.9 | 20–1 | 34.4 |
| 15–5 | 55.5 | 2–1 | 34.4 |
| 10–1 | 55.0 | 15–5 | 35.1 |
| 15–1 | 59.9 | 20–5 | 35.2 |
| 5–1 | 63.1 | 20–15 | 35.5 |
| 2–1 | 95.3 | 20–10 | 45.1 |
| 15–10 | 105.2 | 15–10 | 66.4 |
Growth curves in sporelings of M. laminarioides (Fig. 1d, Table 2) have a shorter lag phase than in G. chilensis and a more pronounced exponential phase, especially in the treatments with fewer spores. Also in this species, coalescence results in an initial increase in size (Table 1), which is proportional to the initial number of spores forming the sporeling. As age increases, area increments are progressively smaller in sporelings formed by a larger number of original spores (Fig. 1d). The pattern is essentially similar to that already described for G. chilensis, but with smaller intertreatment differences (Fig. 1, d and e) and faster growth rates (slopes in Table 2). Also, in this species, the cost of coalescence on growth increases with time and with the initial number of spores forming the individual (Fig. 1f).
Since the growth rates of sporelings of M. laminarioides are higher than in G. chilensis (compare Fig. 1, a and d, and Table 2), sporelings of M. laminarioides formed by low numbers of initial spores reach the same size of initially larger sporelings at an earlier age than in G. chilensis (Table 3). In M. laminarioides, all treatments reach similar sizes between 1 and 2 months of age. Unlike in G. chilensis, treatments with smaller numbers of initial spores are among the fastest growers (Table 3), reaching the size of initially larger sporelings sooner. Treatments with larger numbers of initial spores (e.g., 10, 15, and 20 initial spores) attain similar sizes at later ages (Table 3).
Histological studies.
Number of meristematic cells: In 10 d old sporelings of both species, free marginal cells are lost in each coalescence event (Fig. 2, a–c). In the fusion processes of a few sporelings (Fig. 2b), only a portion of the marginal cells are involved. In the case of coalescence, among larger numbers of initial spores (e.g., Fig. 2c), some sporelings may be completely surrounded by other sporelings, resulting in a loss of marginal meristem cells. Those marginal cells are later incorporated in the coalesced mass, contributing to sporeling tissue rather than to marginal meristem.
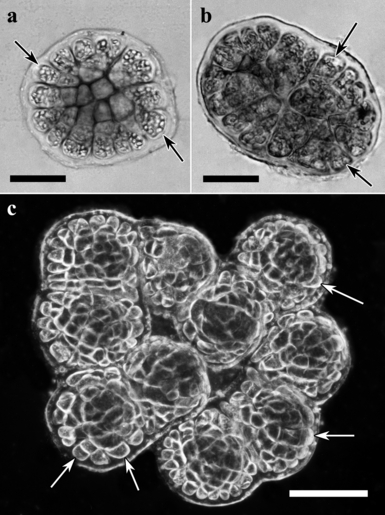
Sporelings of Gracilaria chilensis formed by one (a), two (b), and 10 (c) spores. Observe the proportional reduction in free marginal cells with increasing number of fusions. Arrows indicate free marginal cells. Scales are 50 μm in (a) and (b) and 100 μm in (c).
In both species, with increasing numbers of initial spores contributing to the sporeling, there is a reduction in the average number of marginal cells per spore (Table 4), but also there is an increase in the total number of marginal cells per sporeling (Fig. 3). However, the observed number of marginal cells is 65%–70% lower than the expected number.
| Initial no. of spores | G. chilensis | M. laminarioides | ||
|---|---|---|---|---|
| Mean ± SE | % | Mean ± SE | % | |
| 1 | 17.6 ± 2.61 | 100.0 | 44.9 ± 6.45 | 100.0 |
| 2 | 11.5 ± 3.54 | 34.0 | 35.6 ± 3.3 | 21.0 |
| 5 | 8.6 ± 3.13 | 51.0 | 24.2 ± 3.4 | 46.0 |
| 10 | 6.8 ± 4.4 | 61.0 | 17.9 ± 4.8 | 60.0 |
| 15 | 6.6 ± 5.1 | 62.2 | 16.6 ± 2.6 | 63.0 |
| 20 | 5.8 ± 3.6 | 67.0 | 14.1 ± 4.2 | 69.0 |
- The percent value refers to the average reduction in marginal cells compared to those in unisporic sporelings.
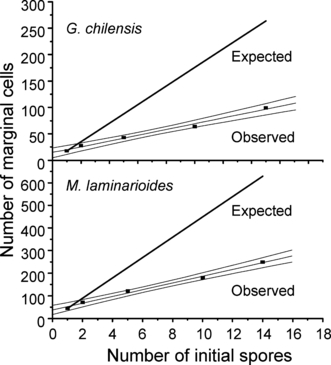
Calculated and observed number of free cells in the marginal meristem in 10 d old sporelings resulting from different numbers of initial spores. Equations/values are y = 13.81224 + 5.51633x, r2 = 0.9886, P = 0.0005 for Gracilaria chilensis, and y = 37.3677 + 14.9566x, r2 = 0.9923, P = 0.0003 for Mazzaella laminarioides.
Mortality of cortical and medullary cells: In both species, normal cells exhibit a well-defined cell wall, lateral chloroplasts, and several starch grains inside the cell (arrowheads in Fig. 4, b and d). Abnormal cells (arrows in Fig. 4d) are small, with larger accumulation of toluidine blue O, without well-defined cell wall or organelles, and with starch grains that sometimes appear to be released into the intercellular space. These necrotic cells often are located among derivatives of the original spores forming the sporeling.
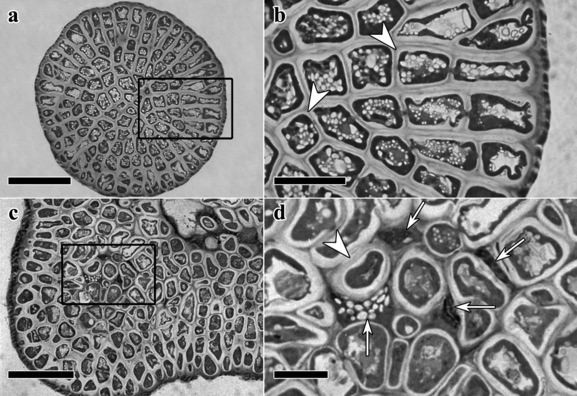
Sections of 37 d old sporelings of Gracliaria chilensis. (a and b) Transection through one-spore sporelings with no evidence of necrotic cells. Scale is 50 μm in (a) and 20 μm in (b). (c and d) Transections through a 15-spore sporeling. Arrowheads indicate normal cells, while arrows indicate necrotic cells and cell remains. Scale is 50 μm in (c) and 10 μm in (d).
Quantification of dead cells in sporelings of G. chilensis and M. laminarioides indicates that their number (Fig. 5) increases with the increasing number of spores initially forming the sporeling. In both species, the shape of the curve is exponential (Fig. 5), with a marked increase in dead cells in sporelings initially formed by >10 spores.
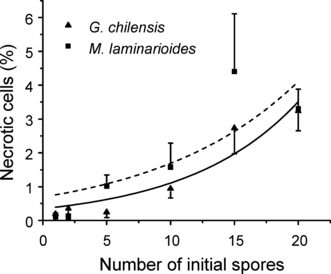
Percentage of necrotic cells in sporelings of Gracilaria chilensis and Mazzaella laminarioides as a function of the number of initial spores forming the sporeling. The equation values are y = 0.3240e(−x/8.6403), r2 = 0.9048, P = 0.00352 for G. chilensis, and y = 0.6952e(−x/11.2548), r2 = 0.6925, P = 0.03989 for M. laminarioides.
Timing of formation and abundance of erect axes: In both species, formation of axis primordia occurs earlier in sporelings derived from multiple spores (Table 5). In sporelings with five or more spores, primordia are detected by day 15. The frequency of primordia initiation increases by day 20, and by day 30, most primordia have been differentiated into erect axes (Table 5). At day 30, unisporic and bisporic crusts begin to initiate primordia. The number of spores contributing to the sporeling is a significant variable in determining the time of primordia formation (Fig. 6, Wald χ2 = 7.5217, df l, P = 0.0061 for the 20 d values of G. chilensis and Wald χ2 = 3.2549, df 1, P = 0.0712 for the 30 d values; Wald χ2 = 16.716, df 1, P < 0.0001 for the 20 d values of M. laminarioides and Wald χ2 = 9.811, df 1, P = 0.0017 for the 30 d values). Overall, the probability of early erect axis formation increases with increasing number of initial spores.
| Initial no. of spores | Primordia | Erect axes | ||||
|---|---|---|---|---|---|---|
| Age (d) | Age (d) | |||||
| 15 | 20 | 30 | 15 | 20 | 30 | |
| G. chilensis | ||||||
| 1 | 0 | 0 | 5 | 0 | 0 | 5 |
| 2 | 0 | 0 | 3 | 0 | 0 | 7 |
| 5 | 5 | 8 | 0 | 0 | 2 | 10 |
| 10 | 1 | 2 | 0 | 0 | 2 | 10 |
| 15 | 2 | 4 | 0 | 0 | 4 | 10 |
| 20 | 6 | 10 | 0 | 0 | 4 | 10 |
| M. laminarioides | ||||||
| 1 | 0 | 0 | 8 | 0 | 0 | 2 |
| 2 | 0 | 0 | 8 | 0 | 0 | 2 |
| 5 | 3 | 7 | 2 | 0 | 3 | 8 |
| 10 | 6 | 2 | 0 | 0 | 8 | 10 |
| 15 | 8 | 7 | 0 | 0 | 8 | 10 |
| 20 | 9 | 3 | 0 | 0 | 7 | 10 |
- Presence of primordia and erect axes was measured at 15, 20, and 30 d of growth.
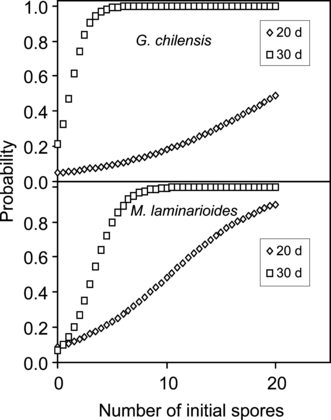
Probabilities of differentiating erect axes at 20 and 30 d of growth, as a function of the number of initial spores forming the sporeling. The corresponding equations for the probabilities of differentiation are as follows: Gracilaria chilensis, 20 d: e−2.9879 + 0.14748x/(1 + e−2.9879 + 0.14748x); G. chilensis, 30 d: e−1.298 + 1.1748x/(1 + e−1.298 + 1.1748x); Mazzaella laminarioides, 20 d: e−2.3249 + 0.22576x/(1 + e−2.3249 + 0.22576x); M. laminarioides, 30 d: e−2.5798 + 0.78676x/(1 + e−2.5798 + 0.7867x).
In both species, the average number of erect axes per sporeling increased asymptotically with increasing number of initial spores (Fig. 7). For G. chilensis, the average number of erect axes in all kinds of sporelings (0.5 in unisporic to 3.2 in 20-spore sporelings) is greater than those in M. laminarioides (0.2 to 1.5, respectively).
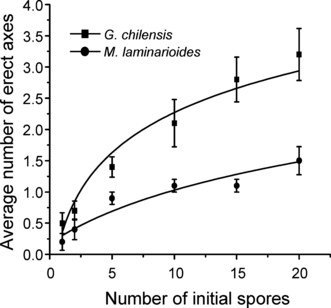
Average number of erect axes differentiated by 30 d sporelings of Gracilaria chilensis and Mazzaella laminarioides as a function of the number of initial spores forming the sporeling. The equation/values are y = 0.2155 + 0.9125 ln(x), r2 = 0.9499, P = 0.001 for G. chilensis, and y = 0.1771 + 0.4013 ln(x), r2 = 0.9566, P = 0.0007 for M. laminarioides.
Discussion
As expected, our experimental results indicate that coalescence is followed by an immediate increase in total size of the resulting individual. During the first 30 d of growth, individuals resulting from coalescing sporelings are larger, in proportion to the number of initial spores for both G. chilensis and M. laminarioides. These results are similar to responses observed in other coalescing seaweeds and colonial invertebrates (see Maldonado 1998, Santelices et al. 1999, and Rinkevich 2005 for reviews). However, our growth projections indicate that these size differences disappear within 30–60 d of continued growth, as sporelings resulting from one to 20 spores converge in size. Indeed, unisporic and multisporic crusts of M. laminarioides may attain the same size after 60 d of growth in the field and lab (Santelices and Alvarado 2008).
In this study, we explored three hypotheses to explain the faster per capita growth of sporelings formed by few (1, 2, or 5) spores compared to those formed by many (10, 15, or 20) spores. First, sporelings with many spores may exhibit less growth than expected by reducing the number of free marginal cells. In these species, sporeling growth during early development is mainly through a marginal meristem that allows radial expansion of the crustose germling (see Gabrielson and Garbary 1986 for a review). Soon after settlement (day 10), we observed a significant reduction in the average number of marginal cells per sporeling, as initial spore density increased. As illustrated in Figure 2, every new fusion between sporelings compromises a number of free marginal cells. Thus, when the number of initial spores is larger than six or seven, such that one or more become completely surrounded by other spores, the contribution of the free marginal cells of these spores to future radial expansions of the growing sporeling is inhibited. It should be noted, however, that the reduction in the average number of free marginal cells is only a partial explanation for the slower specific growth rates of sporelings formed with larger numbers of initial spores, because the total number of marginal cells in multisporic sporelings is still larger than the number in sporelings formed by few cells.
The number of necrotic cells in sporelings also increases, and exponentially, with increasing number of initial spores. The presence of these cells probably results from interspores differences in growth rates, although some incompatibility responses could also be involved (Koslowsky and Waaland 1984, 1987, Potin et al. 2002). However, the number of cells involved is small (<5%) and unlikely to fully explain the observed growth patterns of the sporelings with different numbers of initial spores.
Our results also indicate that the time of differentiation and formation of erect axes, as well as the number of axes formed, is a function of the number of initial spores; erect axes occur earlier and in larger quantities in multisporic individuals than in sporelings formed by few spores or only one spore. In sporelings formed by more than five spores, erect axes primordia were quantified as early as day 15. The emergence of erect axes in the early development of crustose red algae has been termed the crustose-to-erect thallus transition (Bishop and Hodin 2001) and recognized as a growth shift involving important morphological and physiological changes (Santelices and Alvarado 2006). This shift can be interpreted as a trade-off between radial extension and space colonization versus erect axis formation and accelerating erect growth. While proportional reduction in marginal cells, as well as increasing abundance of necrotic cells, with increasing abundance of spores could explain some aspects of the observed growth patterns during the first days after coalescence, the earlier shift in growth priority seems the most likely explanation for the declining radial growth rates in sporelings formed by a larger number of spores.
Experimental studies with red algae (reviewed in Santelices and Alvarado 2006) suggest that abiotic factors, such as temperature, irradiance, or salinity, as well as different concentrations of growth regulators (e.g., indole acetic acid [IAA], gibberellic acid [GA], or cytokinins) added to calluses of various species, may result in differentiation of apical initials and growth of erect axes. However, the mechanism that triggers the change from crust, radial to erect, axial growth in the sporeling is as yet unknown. Perhaps the total number of marginal cells per sporeling functions to elicit the change, or it may be the sporeling size or cell density at a given part of the sporeling. Whatever the mechanism, results suggest that in macroalgae the benefits associated with increased size by multiple coalescent spores are limited to a very short time (i.e., until the growth program shifts from radial to axial).
Similar to invertebrates and slime molds (Rinkevich and Weissman 1992, Maldonado 1998, Foster et al. 2002, Rinkevich 2005), the fusion process in these red macroalgae represents a cost-benefit relationship with fitness implications. At early stages of recruitment, coalescence results in an immediate increase in sporeling size that correlates with increased survival (Santelices and Alvarado 2008). At later stages of development, coalescence stimulates an accelerated crustose-to-erect thallus transition, which also likely increases survival probabilities. The costs involved in coalescence at early recruitment have not yet been identified, but the proportional reduction in marginal cells and the increasing number of necrotic cells, as a function of the number of coalescing spores, are examples of such costs. Future studies are needed to establish the magnitude of the cost/benefit relationship in different coalescing species as well as the various strategies involved in the optimization of the process (e.g., minimizing costs or maximizing benefits; Alexander 1996).
Results also indicate two important differences in the fusion processes between the red seaweeds and modular invertebrates (Hughes and Jackson 1980, Hughes 1984). In invertebrates, the size gained by compatible fusions is maintained during development, but the size difference gained from coalescence in seaweeds is eventually lost due to the changes in the growth direction of the sporeling leading to differentiation and emersion of erect axes. Moreover, the emersion of erect axes in crustose red algae has been presumed to be equivalent to the metamorphic changes of animals (Bishop and Hodin 2001). However, in seaweeds, the process cannot be viewed as a true metamorphosis (Santelices and Alvarado 2006, and this study). Although the crustose-to-erect thallus transition involves significant morphological, physiological, and habitat changes, the algae do not exhibit structural reorganization as metamorphic invertebrates do. This fact is probably due to the simplicity of algal morphological structure and the lack of cell and tissue mechanisms involving cell motility. The presence of algal cell walls impairs cell motility and maintains the cell in a fixed position within the plant, a constraint that is lacking in metamorphic invertebrates (Santelices and Alvarado 2006). These differences highlight the need to critically assess the applicability of concepts developed in one kingdom of organisms to another. In the present case, the red algae exhibit biological properties that restrict the application of definitions and concepts on fusion and postfusion processes developed with modular invertebrates.
Acknowledgments
The authors appreciate the laboratory help of M. Hormazábal and grammatical improvements by A. D. Mann and E. Wieters. This study was supported by grants FONDECYT 1060474 and FONDAP 15010001-1 Program 7.


