HIGH PHOTOSYNTHETIC RATES UNDER A COLIMITATION FOR INORGANIC PHOSPHORUS AND CARBON DIOXIDE1
Received 29 March 2009. Accepted 28 January 2010.
Abstract
Inorganic phosphorus (Pi) and carbon (here, CO2) potentially limit the photosynthesis of phytoplankton simultaneously (colimitation). A single Pi limitation generally reduces photosynthesis, but the effect of a colimitation is not known. Therefore, photosynthesis was measured under Pi-limited conditions and high and low CO2, and osmo-mixotrophic (i.e., growth in the presence of glucose) conditions that result in colimiting conditions in some cases. The green alga Chlamydomonas acidophila Negoro was used as a model organism because low Pi and CO2 concentrations likely influence its photosynthetic rates in its natural environment. Results showed a decreasing maximum photosynthetic rate (Pmax) and maximum quantum yield (ΦII) with increasing Pi limitation. In addition, a Pi limitation enhanced the relative contribution of dark respiration to Pmax (Rd:Pmax) but did not influence the compensation light intensity. Pmax positively correlated with the cellular RUBISCO content. Osmo-mixotrophic conditions resulted in similar Pmax, ΦII, and RUBISCO content as in high-CO2 cultures. The low-CO2 cultures were colimited by Pi and CO2 and had the highest Pmax, ΦII, and RUBISCO content. Colimiting conditions for Pi and CO2 in C. acidophila resulted in an enhanced mismatch between photosynthesis and growth rates compared to the effect of a single Pi limitation. Primary productivity of colimited phytoplankton could thus be misinterpreted.
Abbreviations:
-
- C p
-
- particulate carbon concentration
-
- DOC
-
- dissolved organic carbon
-
- F 0
-
- minimal fluorescence
-
- F m
-
- maximum fluorescence
-
- I
-
- actinic light intensity
-
- OD
-
- optical density
-
- P
-
- photosynthetic O2 evolution
-
- P-I curve
-
- photosynthesis–irradiance curve
-
- Pi
-
- inorganic phosphorus
-
- P max
-
- maximum photosynthetic O2 evolution
-
- P max′
-
- maximum Pmax in eq. 2
-
- Pp
-
- particulate phosphorus concentration
-
- PVDF
-
- polyvinylidine difluoride
-
- Q 0
-
- minimum cellular P quota
-
- Q p
-
- cellular P quota
-
- R d
-
- dark respiration
-
- α
-
- initial slope of P-I curve
-
- β
-
- photoinhibition term of P-I curve
-
- μ
-
- growth rate
-
- ΦII
-
- maximum quantum yield
Pi is often a growth-limiting factor for the phytoplankton in freshwater lakes (Schindler 1977). Also in very acidic mining lakes, phytoplankton growth is Pi limited during most of the summer stratification period (Spijkerman 2008a). Pi limitation lowers maximum photosynthetic rates (Pmax) and maximum quantum yield (ΦII) as shown from laboratory experiments (Harris and Piccinin 1983, Wykoff et al. 1998, Beardall et al. 2005). The low ΦII of Pi-limited phytoplankton will increase upon Pi repletion. For example, the electron transport rates of the phytoplankton from two very acidic lakes increased after a 24 h incubation with Pi, suggesting Pi-limited photosynthesis (Beulker et al. 2002).
Inorganic carbon, especially CO2, is another potential limiting factor of growth for the phytoplankton. CO2 limitation can occur in phytoplankton blooms and seems especially important in very acidic lakes, where due to low pH, virtually no bicarbonate is present and CO2 is the only inorganic species (Stumm and Morgan 1970). Concentrations of inorganic carbon in the upper water strata of acidic lakes typically reflect equilibrium concentrations of CO2 with the air (∼14 μM CO2). These CO2 concentrations decreased the maximum growth rate, Pmax, and ΦII of C. acidophila compared with high-CO2 conditions (Tittel et al. 2005, Spijkerman 2008b). Also in other algal species, Pmax increased upon CO2 addition (e.g., Rost et al. 2003). In the green microalga Dunaliella salina, both growth and photosynthesis were higher under CO2-enriched conditions (Giordano et al. 1994). The results cited above imply that a single nutrient limitation (i.e., either Pi or CO2) will decrease the ΦII of algae compared to nutrient-replete conditions.
In contrast to a single nutrient limitation, it is now often acknowledged that the growth of phytoplankton in many lakes is colimited by two or more nutrients (North et al. 2007 and references therein). Of course, a situation can exist in which different species of algae are limited by different nutrients, but possibly a colimitation also can be expected within one species (Saito et al. 2008). Such a colimitation is defined as a situation at which the concentration of more than one nutrient is below the optimal concentration for uptake and growth (multinutrient colimitation, Arrigo 2005). In a former study, the maximum Pi-uptake rate in C. acidophila was higher under high- than under low-CO2 conditions, and in concert with other results, high-CO2-acclimated cells were more strongly Pi limited than low-CO2-acclimated cells (Spijkerman 2007). Supposedly, the low-CO2-acclimated algae were colimited by Pi and CO2. Similar to the cultures described in Spijkerman (2007), C. acidophila was grown in Pi-limited semicontinuous cultures under high- and low-CO2 conditions, and the Pmax, ΦII, and RUBISCO content were measured. A second high-CO2 treatment was realized by applying glucose to the medium (osmo-mixotrophic conditions). The presence of (co-)limiting conditions was tested in nutrient-enrichment experiments.
Materials and Methods
Cultures. C. acidophila (SAG Göttingen, strain no. 2045) was isolated from Lake 111 (51°29′ N, 13°38′ E), Germany. It was grown in semicontinuous cultures at 19.5 ± 1°C in Woods Hole medium (Nichols 1973), without buffer, a Pi concentration of 1.6 μM, and a pH adjusted to 2.7 with HCl. All cultures started axenic, but as bacteria were suspected to invade the cultures over time, bacterial counts were conducted on cultures used for photosynthesis measurements (see below). Osmo-mixotrophic growth was established by the addition of 1 mM glucose in the medium, and all cultures were placed in ∼200 μmol photons · m−2 · s−1 incident light with a light:dark (L:D) period of 16:8. Daily dilution and harvesting were performed 4–5 h after the onset of light. Dilution rates were 0.1, 0.2, 0.3, 0.4, and 0.6 · d−1 in nonaerated, low-CO2 cultures; and 0.1, 0.2, 0.4, 0.6, and 0.8 · d−1 in cultures aerated with 4.5% CO2 in normal air (v/v, high CO2) and in nonaerated, osmo-mixotrophic cultures. All treatments were performed in triplicate. Aeration did not result in significant mixing of the culture suspension and was ∼15 mL · h−1. All cultures were mixed regularly, and a total culture volume of 500 mL in a 1 L Erlenmeyer flask provided a large surface area for O2 exchange with the air. Average CO2 concentrations in the CO2-aerated cultures were measured as dissolved inorganic carbon using a carbon analyzer (HighTOC + N; Elementar, Hanau, Germany) and amounted to 0.33 (±0.05, n = 20) mM C. This rendered a CO2 limitation unlikely. Nonaerated cultures had a CO2 concentration below the detection limit of the carbon analyzer (<0.04 mM C) and were likely equivalent to equilibrium concentrations with the air (∼0.02 mM C). The pH of all cultures was 2.7, independent of aeration with CO2. Average optical density (OD) at 750 nm ranged from 0.01 to 0.13 measured over a 1 cm pathway (UV1202; Shimadzu, Berlin, Germany). After the cultures had reached a steady state (remaining at constant OD after an exchange of three to five times the culture volume), growth rates equaled dilution rates, and samples were taken for cell counts, chemical analyses, measurements of photosynthesis, and RUBISCO content.
Cell counts and chemical analyses. Cell numbers were determined using an automatic cell counter (CASY 1, Model TT; Schärfe, Reutlingen, Germany). Bacteria were enumerated under an epifluorescence microscope (Axioscop2; Zeiss, Berlin, Germany) after staining the sample with acridine orange and filtering at low pressure on black 0.2 μm Nuclepore filters (track-Etch; Whatman, Göttingen, Germany; Hobbie et al. 1977). The cellular phosphorus quota (Qp) is expressed as mmol particulate phosphorus (Pp):mol particulate carbon (Cp). The molybdate blue method was used to quantify Pp (Murphy and Riley 1962).
For carbon analyses, 5 mL of culture sample was filtered on, at 450°C precombusted, QF20 (Schleicher and Schuell, Dassel, Germany) or GF/F filters (Whatman; ∼30–150 μg C per filter). The filter was dried at 30°C, and Cp was determined in a carbon analyzer calibrated with Tris (5–300 μg C, HighTOC+N, Elementar).
 (1)
(1) (2)
(2)The model is based on the Droop model, but instead of growth rate, Pmax is the dependent variable. In the model, Pmax′ is the estimated maximum Pmax, and Q0 is the minimum cellular P quota for photosynthesis.
 (3)
(3)Part of the sample used for photosynthesis measurements was filtered over a 2.0 μm Nucleopore track-Etch membrane filter (Whatman). This filtrate contained the same density of bacteria, but no algae, and was measured in the light dispensation system to determine the bacterial respiration rate.
RUBISCO content. The RUBISCO content was determined on extracted proteins separated by one-dimensional SDS-PAGE and electroblotted, after which the blots were probed with an antibody against the LSU of RUBISCO (a kind gift from Dr. Koch, University of Potsdam, Department of Plant Physiology; for details, see Spijkerman 2008b). The antibody was made against isolated protein from barley in rabbit. From every culture, two samples were taken, from which six densitometric analyses were made to determine expression levels as a percentage of one reference sample that was run on all gels. Preliminary experiments showed that density and RUBISCO concentration were linearly related.
Enrichment experiments. To test for the growth-limiting factor in the cultures, subsamples of all cultures were enriched with CO2, Pi, CO2 and Pi, and NH4+ and grown in the climate room for 4 d. A control was enriched with deionized water and treated similarly. Final concentrations of the nutrients were 330 μM CO2, 50 μM Pi, and 800 μM NH4+. Before and after culturing, the OD at 750 nm was determined, and the exponential growth rate was calculated. The growth rate in the nutrient-enrichment treatment was divided by that in the control.
Curve-fitting and statistical tests were performed in SPSS (version 17.0; Chicago, IL, USA). P-I curves and eq. 3 were fitted to the measurements via the nonlinear regression function. After the homogeneity of variance was assured (via a Levene’s test, or data transformation), an analysis of covariance (ANCOVA) was performed, as growth rates and carbon source (high or low CO2) are not entirely independent factors. Intrinsic maximum growth rates are higher under high-CO2 and osmo-mixotrophic conditions than under low-CO2 conditions. For post hoc tests, Bonferroni was chosen.
Results
Nutrient-enrichment experiments revealed that Pi was the main limiting factor for growth in all cultures, as a Pi addition largely stimulated growth rates (Fig. 1). With increasing dilution rate, enrichment cultures receiving only deionized water (control) had increasing growth rates, probably as a result of the increasing concentration of Pi left in the medium. Therefore, the growth rate in the nutrient enrichments was divided by that in the control for each dilution rate. Growth rates in the cultures enriched with CO2 or NH4+ were similar to those in the control (i.e., the quotient did not differ from 1), whereas the addition of Pi or both CO2 and Pi resulted in 4- to 5-fold higher growth rates than those in the control cultures (ANCOVA, df = 3, 53, F = 101, P < 0.001; Fig. 1). A paired sample t-test revealed that relative growth rates in nonaerated cultures were higher in enrichment cultures with both CO2 and Pi (t = 3.05, df = 4, P < 0.05) than in those receiving only Pi. In CO2-aerated cultures, this effect was marginally significant (t = 2.39, df = 4, P = 0.076), and in osmo-mixotrophic cultures, there was no significant difference between these two treatments (t = 1.09, P = 0.336).
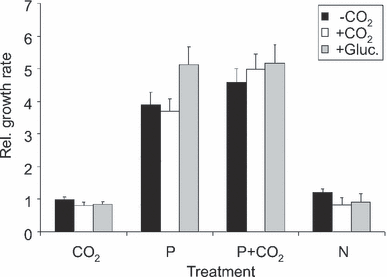
The growth rate of Chlamydomonas acidophila after different nutrient enrichments in relation to the control (H2O) from semicontinuous cultures grown in CO2-aerated (+CO2), nonaerated (-CO2), and osmo-mixotrophic (+Gluc.) Pi-limited conditions at pH 2.7. Mean of five cultures ±SE.
A former study had shown that the maximum Pi-uptake rate was ∼60-fold higher in the Pi-limited rather than Pi-saturated cultures (Spijkerman 2007). In addition, the C source had a significant effect on the maximum Pi-uptake rate: this rate was higher in the CO2-aerated than in the nonaerated or osmo-mixotrophic cultures. Here, I show that the C source (high or low CO2 and the presence or absence of glucose) had a significant effect on the maximum quantum yield (ΦII) and the maximum photosynthetic rate (Pmax) when the effect of dilution rate was accounted for (ANCOVA, df = 2, 42, F ≥ 6.3, P < 0.01 for both; Fig. 2). Remarkably, the highest ΦII and Pmax were obtained in the low-CO2 cultures (-CO2 conditions), whereas lower values were measured in high-CO2 and osmo-mixotrophic cultures, especially at dilution rates <0.6 · d−1 (Fig. 2). The ΦII and Pmax in high-CO2 and osmo-mixotrophic cultures were similar.
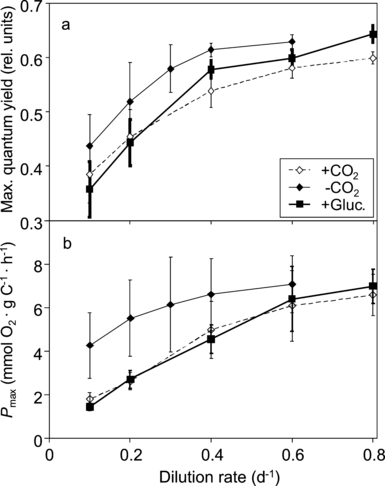
(a) Maximum quantum yield and (b) maximum photosynthetic rate (Pmax) of Chlamydomonas acidophila grown in CO2-aerated (+CO2), nonaerated (-CO2), and osmo-mixotrophic (+Gluc.) Pi-limited conditions at pH 2.7. Mean ± SE of three cultures.
Values of both ΦII and Pmax increased with increasing dilution rate (ANCOVA, df = 5, 39, F > 6.4, P < 0.001 for both; Fig. 2). ΦII increased from 0.26 to 0.67 with increasing dilution rate, and Pmax increased from 1.1 to 9.3 mmol O2 · g C−1 · h−1. At higher dilution rates, the cellular P quota (Qp) was also higher than at lower ones (Spijkerman 2007), yielding a positive relationship between ΦII and Pmax with Qp. All values of Pmax were related to Qp using eq. 2 (Fig. 3), the maximum Pmax (Pmax′) was estimated as 9.6 mmol O2 · g C−1 · h−1, and the minimum cellular phosphorus quota, Q0, as 0.68 mmol Pp:mol Cp (r2 = 0.65). The results presented in 2, 3 clearly show that with increasing strength of a Pi limitation (i.e., a lower dilution rate or a lower Qp), C. acidophila decreased its photosynthetic capacity.
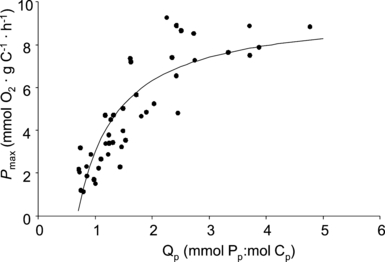
Maximum photosynthetic activity (Pmax) of Chlamydomonas acidophila in relation to the cellular Pp quota (Qp). The line illustrates eq. 2 fitted to the data points.
The relative contribution of the dark respiration (Rd) to Pmax decreased with increasing dilution rate when the effect of the C source was accounted for (ANCOVA, df = 5, 40; F = 3.2; P < 0.05; Table 1). This finding means that the stronger Pi-limited algae (grown at low dilution rates) had a higher relative Rd (up to 41% of Pmax) when compared with 17.5% in the algae growing at higher dilution rates. This was solely a result of a decrease in the Pmax, as Rd did not change over dilution rate (results not shown). There was no effect of the C source on the value of Rd:Pmax (ANCOVA, df = 2, 43, F = 2.3, P = 0.11): the dark respiration in osmo-mixotrophic cultures was the same as in low- and high-CO2 cultures. The effect of bacterial contamination on the measured respiration rates was tested by measuring the O2 evolution in the filtrate of the sample used for photosynthesis measurements (through a membrane with 2.0 μm pore size) and enumerating the bacteria. The percentage of bacterial Rd to total measured Rd was on average (±SD, n = 5) 21 ± 16, 42 ± 14, and 33 ± 5, for low-CO2, high-CO2, and osmo-mixotrophic cultures, respectively. Both observations on Rd agree with the fact that the bacterial densities were the same in osmo-mixotrophic and high- or low-CO2 cultures (results not shown) and ranged from 7.3 × 10⁷ and 3.6 × 10⁸ bacteria · L−1, mainly varying over the dilution rate (i.e., bacterial densities were higher in cultures with a low dilution rate). The bacterial respiration rates were not correlated with the bacterial density (results not shown; Pearson, n = 15, r = 0.06, P = 0.83). Therefore, bacterial contamination did not have a significant impact on the Rd, which was further supported by the observation that bacterial densities increased with decreasing dilution rate, whereas Rd remained constant.
| μ (d−1) | R d:Pmax (%) | I c (μmol · m−2 · s−1) | ||||
|---|---|---|---|---|---|---|
| -CO2 | +CO2 | +Gluc. | -CO2 | +CO2 | +Gluc. | |
| 0.1 | 26 ± 6 | 41 ± 6 | 31 ± 9 | 34 ± 6 | 40 ± 8 | 28 ± 12 |
| 0.2 | 25 ± 5 | 33 ± 9 | 37 ± 2 | 31 ± 8 | 27 ± 10 | 39 ± 8 |
| 0.3 | 25 ± 6 | n.d. | n.d. | 31 ± 7 | n.d. | n.d. |
| 0.4 | 20 ± 4 | 28 ± 7 | 27 ± 3 | 26 ± 7 | 32 ± 8 | 30 ± 4 |
| 0.6 | 25 ± 3 | 21 ± 5 | 20 ± 5 | 36 ± 11 | 28 ± 8 | 26 ± 8 |
| 0.8 | n.d. | 21 ± 4 | 17 ± 3 | n.d. | 36 ± 11 | 23 ± 6 |
- Values are averages of three independent replicates (±SE). n.d., not determined.
The compensation light intensity (Ic, which is Rd:α) remained the same over dilution rate when the effect of the C source was accounted for (ANCOVA, df = 5, 40, F = 0.17, P = 0.97; Table 1). The results thereby show that independent of the Pi limitation, algae required the same light intensity for photosynthesis to compensate for Rd and were likely not light limited in their growth. In addition, Ic was the same in osmo-mixtrophic as in high- or low-CO2 cultures (ANCOVA, df = 2, 43, F = 0.37, P = 0.69). Independent from the C source applied, a more stringent Pi limitation resulted in higher values of Rd:Pmax and no differences in Ic.
Differences in photosynthetic rates may relate to differences in RUBISCO content, motivating the measurement of this parameter. The RUBISCO content varied by a factor of three in C. acidophila, depending on the growth rate and C source (Fig. 4). Under low-CO2 conditions, C. acidophila had the highest cellular content of RUBISCO, which was on average 1.6 times higher than under high-CO2 and osmo-mixotrophic conditions (ANCOVA, df = 2, 89, F = 22.4, P < 0.001). The RUBISCO content under high-CO2 and osmo-mixotrophic conditions was similar (Bonferroni, P = 0.95). There was no effect of dilution rate on the RUBISCO content when the effect of C source was accounted for (ANCOVA, df = 5, 86, F = 0.51, P = 0.77; Fig. 4). Therefore, the RUBISCO content was constant over dilution rate (and hence constant over the strength of Pi limitation) in all cultures and positively correlated to the Pmax (compare Fig. 2b with Fig. 4; Pearson correlation, n = 46, r = 0.309, P < 0.05).
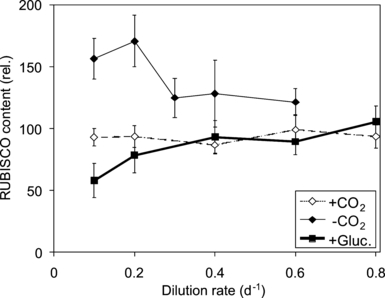
The cellular RUBISCO content of Chlamydomonas acidophila grown in CO2-aerated (+CO2), nonaerated (-CO2), and osmo-mixotrophic (+Gluc.) Pi-limited conditions at pH 2.7. Mean ± SE of six independent measurements.
Discussion
The photosynthetic characteristics of C. acidophila depended on its nutrient limitation. In general, a more stringent Pi limitation resulted in a lower ΦII and Pmax, and higher values of Rd:Pmax. Colimiting conditions of Pi and CO2 were most pronounced in low-CO2-acclimated cultures that had the highest ΦII, Pmax, and RUBISCO content. A colimitation for Pi and CO2 enhanced the mismatch between C-fixation capacity and growth rate.
In C. acidophila, ΦII and Pmax positively correlated with each other, and lower values were measured under more stringent Pi-limited conditions. The lower ΦII with a more stringent nutrient limitation coincided with observations on other algal species where single-nutrient-limiting conditions resulted in a decreased ΦII (LaRoche et al. 1993, Graziano et al. 1996, Geider et al. 1998). Comparing ΦII in Pi-replete and Pi-limited conditions in C. acidophila, the highest ΦII from the Pi-limited low-CO2 cultures (0.66) was higher than that of Pi-replete cultures (i.e., 0.62; Spijkerman 2008b). In contrast, the highest ΦII in Pi-limited high-CO2 cultures (0.67) was the same as that measured in Pi-replete cultures (i.e., 0.67; Spijkerman 2008b). In C. acidophila, carbon-specific Pmax under maximum Pi limitation amounted to ∼20% of the Pmax at the least Pi-limited conditions. This decrease is rather large compared with Chlamydomonas reinhardtii, for example, where Pmax decreased 2-fold over a decrease in dilution rate from 2.0 to 0.25 · d−1 (Harris and Piccinin 1983). Also in other algal species, photosynthetic rates measured by O2 evolution often decrease under nutrient-limiting conditions (Wykoff et al. 1998, Beardall et al. 2005, Young and Beardall 2005), although in some cases the effect was minor (Geider et al. 1998) or even contrasting: Pmax was higher in Pi-limited than in Pi-replete Chlorella vulgaris (Kozlowska-Szerenos et al. 2004). Kozlowska-Szerenos and colleagues explain this as similar to a sun-type (i.e., high light) acclimation response to insufficient phosphate feeding, but as they describe only a minor decrease in the chl content of the algae with increasing Pi limitation, their study rather shows a complex response in the photosynthesis of cells exposed to a transition from Pi-replete to Pi-deplete conditions.
The Rd:Pmax of C. acidophila was similar (ranging between 10% and 50%) to that of C. reinhardtii (ranging between 28% and 43%; Harris and Piccinin 1983). In contrast to the study of Harris and Piccinin, who detected no change in the Rd:Pmax over dilution rate, the Rd:Pmax of C. acidophila was the highest in the cultures with the lowest dilution rates (i.e., more stringent Pi-limited cells), and values decreased with increasing dilution rates. This was solely a result of changes in the Pmax, as Rd did not change over dilution rate. Possibly, in C. acidophila, Rd is rather high as to produce additional ATP necessary for energizing proton efflux and maintaining a neutral internal pH (Gerloff-Elias et al. 2005, 2006). The rather high Pmax compensates for this high Rd (Gerloff-Elias et al. 2005), and as the external pH remains low, only changes in Pmax can be realized in this algal species.
In contrast to an expected enhanced Rd under osmo-mixotrophic Pi-limited conditions, no such effect was observed here. There is a tendency of Rd:Pmax, to be higher in the high-CO2 and osmo-mixotrophic than in the low-CO2 cultures, which coincides with the reported increased Rd values for plants grown under high CO2 (Leakey et al. 2009). Effects of intracellular high-CO2 concentrations might therefore cover a possible effect of enhanced glucose concentrations on photosynthesis under Pi-limited conditions.
In many physiological characteristics (ΦII, Pmax, Rd:Pmax and RUBISCO content), osmo-mixotrophic and high-CO2-acclimated cells of C. acidophila showed a similar response. Only in the nutrient-enrichment experiment was a different response measured as the osmo-mixotrophic algae realized the same growth rate when enriched with only Pi or with both Pi and CO2 (Fig. 1). These algae were therefore not colimited in their growth for Pi and CO2. Both the low- and high-CO2-acclimated algae grew faster when cultures were enriched with both Pi and CO2 than when enriched with Pi only, suggesting a colimitation in growth. It is, however, possible that the growth response to both nutrients did not occur simultaneously, but chronologically. From the data presented here, this finding cannot be distinguished as the biomass yield was measured at only one point in time (after 4 d). Therefore, daily monitoring of enrichment experiments, similar to those performed by North and colleagues (North et al. 2007), will be necessary to elucidate the growth response.
P max related to Qp in a nonlinear manner to which a saturation model was fitted. From this curve, the minimum cell quota (Q0) for photosynthesis was estimated as 0.68 mmol Pp:mol Cp. This value is in the lower range of the Q0 estimated via a normal Droop relation where growth is the dependent parameter (i.e., 0.59–1.14 mmol Pp:mol Cp; Spijkerman 2007) and provides the possibility to estimate Q0 via photosynthesis measurements. This fact allows the estimation of Q0 in transiently growing Pi-limited cultures that are not in a steady state, but where Qp and photosynthesis can be determined.
In C. acidophila, high-CO2 levels enabled enhanced ΦII and Pmax under Pi-saturating conditions (Spijkerman 2008b), and also in other algal species, Pmax increased upon CO2 addition (e.g., Rost et al. 2003). For example, in Dunaliella salina, photosynthesis was higher under high-CO2 than low-CO2 conditions (Giordano et al. 1994). Under Pi and CO2 colimiting conditions, there was a contrasting effect (i.e., the ΦII and Pmax were lower at high-CO2 than at low-CO2 conditions; Fig. 2). The enhanced ΦII and Pmax in the Pi and CO2 colimited algae reflect an enhanced “uptake capacity for CO2” following the physiological response to CO2-limiting conditions. In contrast, the high-CO2-acclimated and osmo-mixotrophic algae were predominantly Pi limited, which resulted in a lower Pmax. As a consequence, algae colimited by Pi and CO2 will have the physiological properties resulting from a Pi limitation but also from a CO2 limitation. Present studies support this hypothesis as the maximum uptake rates of Pi and CO2 were both increased under colimiting conditions (E. Spijkerman, unpublished data).
In addition, Harris and Piccinin (1983) showed complex interactions between Pi limitation, growth rate, and C metabolism, and their figure 2 shows a higher calculated growth rate from C-uptake data than the actual dilution rate in Pi-limited C. reinhardtii continuous cultures, especially at the lower dilution rates. In their study, a maximal 2-fold overcapacity for CO2 fixation compared with the dilution rate was observed. For C. acidophila, growth rates can be calculated from net photosynthetic rates, as at in situ light intensities, Pmax is realized. Calculated growth rates ranged between 0.15 and 0.89 · d−1, whereas dilution rates ranged between 0.1 and 0.8 · d−1, suggesting an overproduction of organic substances under most conditions tested. This overproduction is reflected in enhanced concentrations of dissolved organic carbon (DOC) in the culture medium (Spijkerman 2007). Relative to the dilution rate, growth rates calculated from Pmax were 1.0 to 1.6 times higher in high-CO2 and osmo-mixotrophic algae, being in the range of that determined for C. reinhardtii under Pi-limited conditions (Harris and Piccinin 1983). In low-CO2-acclimated cells, the overcapacity of photosynthesis to growth rate in C. acidophila was higher, ranging between 1.4 and 4.8, suggesting an increasing mismatch between photosynthesis and growth at Pi and CO2 colimiting conditions than under a single Pi limitation. Interestingly, this enhancement did not result in higher DOC concentrations in low- than in high-CO2 conditions. At present, it is not clear how to explain this discrepancy other than that the low-CO2-acclimated algae released more CO2 or that the photosynthesis measurements overestimated in situ rates. The synthesis of a (larger) mucous sheath under low-CO2 conditions seems unlikely as the cellular carbon content was comparable and cell size smaller than under high-CO2 conditions (Spijkerman 2007).
The cellular RUBISCO content was on average 1.6-fold higher in the low-CO2 cells than in the high-CO2 cells (Fig. 3). This extent confirms previous findings where under Pi-replete conditions C. acidophila also regulated its cellular RUBISCO content in response to CO2 concentrations (Spijkerman 2008b): at low-CO2 conditions, C. acidophila had ∼1.5 times the amount of RUBISCO protein than under high-CO2 conditions. A positive correlation between cellular RUBISCO content and Pmax is often described in algae (Raven 1991) and is confirmed here in C. acidophila under Pi-limited conditions. Also, in Dunaliella tertiolecta, changes in Pmax caused by nutrient-limiting conditions could be accounted for by changes in the cellular RUBISCO content (Geider et al. 1998). In contrast, under Pi-replete conditions, cellular RUBISCO content and Pmax were negatively correlated in C. acidophila (Spijkerman 2008b). Algae having a carbon concentrating mechanism (CCM) tend to increase the RUBISCO content under increased CO2 conditions (Raven 1991). Although C. acidophila has a CCM (Spijkerman 2005), the RUBISCO content was higher under low- than under high-CO2 conditions both under Pi-replete and Pi-deplete conditions. Its RUBISCO content therefore correlates with CO2 condition and not with Pmax.
In conclusion, this study has demonstrated that under Pi-limited conditions both ΦII and Pmax decreased. By performing nutrient-enrichment experiments, a colimitation for Pi and CO2 was detected in nonaerated algae that had an increased ΦII, Pmax, and RUBISCO content compared to CO2-aerated (marginally colimited) and osmo-mixotrophic cultures (not colimited). The effect of a Pi limitation on photosynthesis is important to understand primary productivity measurements in lakes, as Pi is often considered a growth-limiting nutrient. In theory, light intensities during an extended period of the day and over several meters of depth would support Pmax. However, in-lake measurements show that Pmax often exceeds 14C-fixation rates (e.g., Carignan et al. 2000), which is likely the result of Pi-limited conditions. With the recent acknowledgment that phytoplankton are often colimited by more than one nutrient, studies on the effect of a colimitation on photosynthesis and primary productivity are required—not only for understanding processes, but also for ecosystem modeling, as net primary productivity explains a significant part of food-web properties in ecosystem modeling (Vermaat et al. 2009). The results of this study show that phytoplankton colimited by Pi and CO2 will have misleadingly high photosynthetic rates, which could result in the false conclusion that the plankton are not nutrient limited.
Acknowledgments
This work was supported by the German research foundation (DFG, SP695/2 and Ga401/12). I gratefully acknowledge the practical assistance of Lucine Schneider, Bettina Fach, Erik Sperfeld, Cathleen Friedrich, Anna Leetz, Anja Schüler, and Carolin Döring.


