

Supply chain coordination for a deteriorating item with stock and price-dependent demand under revenue sharing contract
Abstract
This paper deals with an integrated single-manufacturer single-retailer supply chain model for a single item. The market demand is assumed to be dependent on both the on-hand stock and price, and the manufacturer and the retailer are in an agreement of lot-for-lot policy. The proposed model is developed under the contract that the retailer offers the manufacturer a percentage of revenue (s)he generates by selling a lot. We determine optimal policies for both the centralized and decentralized coordination systems. A comparison of these policies is made with a numerical example. Sensitivity analysis is performed to examine the stability of the solution.
1. Introduction
In a competitive business environment, the integration to obtain an optimal production/inventory policy in the supply chain has become essential. With increasing emphasis on the significance of effective supply chain management, many researchers have given much attention to coordination issues between manufacturers and retailers in a supply chain. Over the last few years, lots of valuable studies have been devoted to the integrated vendor–buyer problem for the supply chain. To the best of the authors’ knowledge, Goyal (1976) was the first to introduce the idea of a joint total cost for a single-supplier and a single-customer scenario. Under a finite production rate, Banerjee (1986) investigated the integrated vendor–buyer problem with a lot-for-lot policy. Goyal (1988) relaxed Banerjee's lot-for-lot assumption and provided a joint economic lot size model to obtain a lower or equal joint total cost. Based on a batch providing an integer number of equal deliveries, Lu (1995) developed an optimal solution for the single-vendor single-buyer integrated model. Hill (1997) introduced a general policy for the integrated production-inventory system in a supply chain model. Goyal (2000) modified Hill's procedure and suggested a simple procedure to adjust shipment size for obtaining a lower joint total cost. Hill (1999) derived the structure of the globally optimal production and shipment policy for the single-vendor single-buyer integrated production-inventory problem. Assuming one production cycle for the vendor and multiple deliveries for the buyer, Rau et al. (2003) provided an integrated inventory model for a deteriorating item in a three-echelon supply chain environment.
The above contributions are based on a constant demand. However, in reality, the demand of an item may depend on its market price. Authors such as Monahan (1984) and Weng (1995) investigated the properties of supply chain coordination mechanism assuming the chain's market demand to be price sensitive. Weng and Wong (1993), Parlar and Wang (1994), Abad (1994), Li and Liu (2006), Chakravarty and Martin (1991), Qin et al. (2007), Weng (1995), Chen et al. (2010) and many others also studied manufacturer–retailer coordination policies taking the market demand to be dependent on price. Various types of price-dependency such as linear, quadratic, exponential, etc. have been studied till now.
In many practical instances, the market demand may also depend on the on-hand stock. The exceptions include on-line shopping where the customer can not observe the inventory level, the case when the bulk of inventory is held in a store's back room, and the situation when companies purposely create scarcity in their products (low inventory level) to urge customer to buy the products before they are stocked out. However, in the supermarket, it is usually observed that an increase in shelf space for a consumer good induces more customers to buy it. This occurs owing to its visibility, popularity, or variety. Conversely, low stock of certain goods may raise the perception that they are not fresh. Levin et al. (1972) pointed out that large piles of consumer goods displayed would attract the customer to buy more. Silver et al. (1985) showed that sales at the retail level tend to be proportional to stock displayed.
Deterioration of inventory items is a well-known fact observed in real life. Items such as agricultural products, fashion goods, food and dairy products, etc. are depleted through spoilage or damage and obsolescence other than demand. Ghare and Schrader (1963) were the first to extend the classical economic order quantity (EOQ) model by considering the combined effects of demand and exponential decay. After that numerous research efforts have been made to study the effect of deterioration on optimal lot sizing decisions. Comprehensive reviews on deteriorating inventory literature can be found in the articles contributed by Nahmias (1982) and Goyal and Giri (2001).
In today's competitive market economy, each entity of a supply chain is interested to maximize its own profit without looking at others. This suboptimization process reduces the total profit of the supply chain. To get rid of the situation, several contract mechanisms between the acting entities have been proposed and studied by a large number of researchers. Some of the well-practiced contracts are wholesale price contract, revenue sharing contract, buyback contract, etc. These contracts are designed to improve the performance of all parties involved in the chain. One desirable feature of a contract mechanism is the win–win outcome in which each participating entity's profit is higher compared to that of the decentralized system (Rhee et al., 2010). In the revenue sharing policy, apart from the wholesale price, the retailer gives the manufacturer a fixed percentage of revenue he gets from the market. As shown by Cachon and Larivier (2005) and Dana and Spier (2004) such contracts have become more prevalent in the videocassette rental industry than the conventional wholesale price contract. Chauhan and Proth (2004) presented a provider–retailer partnership model based on revenue sharing contract and proposed an approach to maximize the combined profit. Giannoccaro and Pontrandolfo (2004) proposed a model of supply chain contract that coordinated a three-echelon supply chain. Considering price-sensitive end-customer demand, Yong and Yong (2005) developed a revenue sharing contract model.
In this paper, we consider a revenue sharing contract in a supply chain that consists of a single-manufacturer and a single-retailer. The market demand is assumed to be dependent on both the on-hand inventory of the retailer and the selling price of the product. Such an assumption is realistic as this demand pattern of commonly used consumer goods could be observed in many retail stores and supermarkets. The objective of this study is to derive the optimal wholesale price of the manufacturer and the selling price of the retailer so as to maximize the total profit of the supply chain. The rest of the paper is organized as follows. Model description and notations are given in the following section. Section 3. provides the centralized model as a benchmark case. Section 4. provides the model with no coordination between the entities. Section 5. deals with a coordination model between the acting entities through revenue sharing contract. In Section 6., a numerical example is cited to illustrate the developed models and carry out sensitivity analysis. A comparison of the outcome of the proposed models is also given. Finally, conclusions are drawn in Section 7..
2. Model description and notations
We consider a supply chain consisting of a single-manufacturer single-retailer to manage a single product over a finite planning horizon. The market demand is assumed to be dependent on both the on-hand inventory of the retailer and the selling price of the product. Shortages are not allowed in any stage of the supply chain. The length of the replenishment cycle of the retailer is fixed. The manufacturer follows a lot-for-lot policy to deliver the product to the retailer. Retailer's inventory is subject to deterioration at a constant rate over time. Moreover, the retailer is in agreement to offer the manufacturer a percentage of revenue (s)he generates by selling a lot. To develop the model, we use the following notations:
-

-
- retailer's inventory level at time t,
-
- p
-
- unit retail price,
-

-
- market demand at time t; we assume
 , where
  ,
,  ,
,  such that the demand is always positive,
 - market demand at time t; we assume
-
- θ
-
- deterioration rate,

- deterioration rate,
-

-
- manufacturer's inventory level at time t,
-
- P
-
- production rate of the manufacturer,
-

-
- machine maintenance/set up time for production
-

-
- production lot size of the manufacturer,
-

-
- quantity deteriorated in a time cycle,
-
- Q
-
- quantity sold by the retailer in a time cycle,
-

-
- unit deterioration cost of the retailer,
-

-
- unit holding cost of the retailer,
-

-
- unit holding cost of the manufacturer,
-

-
- ordering cost of the retailer,
-

-
- set up cost of the manufacturer,
-
- c
-
- unit production cost of the manufacturer,
-
- w
-
- unit wholesale price of the manufacturer,
-
- H
-
- length of the finite time horizon,
-
- T
-
- fixed cycle length of replenishment,

- fixed cycle length of replenishment,
-
- n
-
- total number of replenishment made by the retailer during the time horizon
 ,
, - total number of replenishment made by the retailer during the time horizon
-
- ϕ
-
- fraction of revenue the retailer gets,

- fraction of revenue the retailer gets,
-

-
- total profit of the retailer in the decentralized system,
-

-
- total profit of the manufacturer in the decentralized system,
-
- Π
-
- total profit of the supply chain in the decentralized system,
 ,
, - total profit of the supply chain in the decentralized system,
-

-
- total profit of the retailer under revenue sharing contract,
-

-
- total profit of the manufacturer under revenue sharing contract,
-
- Π
-
- total profit of the supply chain under revenue sharing contract,
 ,
, - total profit of the supply chain under revenue sharing contract,
-

-
- total cost of the centralized supply chain model,
-

-
- total profit of the centralized supply chain model.
3. Centralized model—the benchmark case
 , the rate of change of the retailer's inventory level is equal to the demand rate and the deterioration rate. The instantaneous states of the retailer's inventory is thus governed by the differential equation
 (1)
(1) .
. (2)
(2) is equal to the order quantity of the retailer, i.e.


 is
is


 is
is

 is
is  .
.

 is
is

 .
.
 is
is


 , therefore, the total profit is given by
 (3)
(3) . Differentiating (3) twice partially with respect to p, we get

 is concave with respect to p. Now, for any given n,
  gives
gives
 (4)
(4) , we may apply a line search technique on n to find the optimal value of n numerically and then the corresponding value of p from Equation 4. Here [ · ] denotes the usual box function.
4. Decentralized model
In this section, we consider the situation in which there is no coordination between the two acting entities and both of them try to maximize their own profits.
4.1. Retailer's profit
 is
is  . Therefore, the total profit of the retailer in the time interval
  is
is
 (5)
(5) , i.e. the retailer's profit function
  is concave with respect to the retail price p.
4.2. Manufacturer's profit
 (6)
(6) can be shown to be concave with respect to wholesale price w (see Appendix).
4.3. Solution procedure
To solve the model, we incorporate the idea of “Manufacturer-Stackelberg” (MS) game. The Stackelberg leadership model is a strategic game in economics in which the leader firm declares its decision first and then the follower firms determine their decisions sequentially, with the assumption that they share relevant information. The derived model incorporates vertical competition between the entities, so anyone of the competing entities can be chosen as the Stackelberg leader. In this paper, we assume that the manufacturer is the Stackelberg leader who sets the wholesale price first and the retailer is the follower who, depending on the wholesale price, determines the retail price. It is a common phenomena in large-scale production industries where the manufacturing industries themselves control, by some means or other, the activities of the subsequent channel members. For instance, Imperial Tobacco Company (ITC), India is such a kind of leader in Indian tobacco industries.
 gives
gives

 (7)
(7) which gives
 (8)
(8) (9)
(9) of the supply chain will be maximum.
Proposition 1.For each n, the retail price in the centralized model is less than that of the decentralized model.
Proof.In the decentralized system, the manufacturer's profit is dependent on the wholesale price only, as he gets no share from the revenue. Then, it is clear that unit wholesale price is greater than unit production cost plus average unit holding cost for an item 

The above Proposition exhibits a valuable managerial insight of the model. It shows that the retail price is lower in the centralized system than in the decentralized one. In a decentralized system, there is no coordination between the retailer and the manufacturer and therefore, both the parties seek to maximize their own profits. This leads to the double marginalization that affects the performance of the total supply chain; the buyers being the immediate sufferers. Our proposed model is developed under the assumption that the market demand is negatively correlated with the retail price; the lower the retail price, the higher is the quantity demanded. In the centralized system, the lower retail price attracts more customers to fulfill their demand. As a result, the market demand remains always in the higher side in case of a centralized system. Also, more demand implies more sales, and consequently, more profit to the system. Hence, the centralized system is beneficiary for both the competing entities (manufacturer, retailer) as well as the customers who are not members of the system. It is, therefore, better for a firm to have a centralized control over the supply chain. However, this being not possible always, some kind of coordination is necessary to enhance the profit of the supply chain.
5. Model under revenue sharing contract
It has been proved by researchers that a supply chain performs better in the centralized system than in the decentralized system in terms of profit maximization or cost minimization. However, it is not always possible for the companies to have a centralized system. Therefore, to ensure better result, some kind of cooperation between the entities of a supply chain is very much essential. We incorporate the idea of revenue sharing contract in which the retailer shares a fixed predetermined percentage of his revenue with the manufacturer, and in turn, the manufacturer agrees to sale the produced item to the retailer at a lower wholesale price.
 portion of his total revenue with the manufacturer. Let us consider the most common situation in which the reduced wholesale price that the manufacturer offers to the retailer is determined by
  . Then, the net profit of the retailer would be
 (10)
(10) (11)
(11) gives
gives
 (12)
(12) of the supply chain is maximum.
The most important issue in establishing the revenue sharing contract is to determine the value of the fraction ϕ. There are many possible ways to determine the value of ϕ, e.g. comparing the results of the centralized and decentralized systems, comparing the corresponding profits of both the acting entities in the decentralized system, comparing the ratios of individual investments of the entities in the system and so on. However, both the competing entities would go for the contract to enhance the total profit of the supply chain only if their individual profits get increased in the coordinated case than the noncoordinated case. The value of the parameter ϕ would be determined after observing the results obtained in the centralized as well as decentralized systems by both the parties. This gives a feasible interval of ϕ to belong to. The exact value of ϕ will depend on the negotiation power of both the entities. Of course, the greater value of ϕ implies the more powerful negotiation ability of the retailer.
Proposition 2.For each n, there exists a revenue sharing fraction ϕ that coordinates the chain.
Proof.Compare the retail price (given in Equation 4) in the centralized system with that (given in Equation 12) under revenue sharing contract. For each n, we have
 (13)
(13)Note: Equation 13 clearly shows that ϕ lies between 0 and 1. Moreover, ϕ is independent of the demand parameters a and b and the decision variables present in the system. It is to be noted here that this value of ϕ cannot guarantee the win–win outcome of the model.▪
6. Numerical example
For numerical study, we consider Example 1 of Hou and Lin (2006). As their model is an EOQ model, this example fails to provide us the complete set of parameter values that we require. We select the remaining parameter values keeping the feasibility condition in mind. The complete set of parameter values are as follows:
 ,
,  ,
,  per unit per year,
  ,
,  ,
,  years,
  per order,
 per unit,
  per set-up,
  per unit per year,
  ,
,  years.
With these values, the optimal results for the centralized supply chain model are obtained as  ,
,  and the corresponding total profit is $12, 469. The optimal results for the decentralized supply chain model are
  ,
, 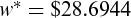 ,
, 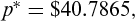 and the corresponding profits of the retailer, manufacturer, and the supply chain are $3186.2, $5732.5 and $8918.7, respectively.
- The profit of the retailer in the revenue sharing contract becomes less than that in the decentralized system when the value of ϕ is less than 0.2952 (approximately). This gives a lower bound for the feasible range of values of ϕ.
- The profit of the manufacturer in the revenue sharing contract becomes less than that in the decentralized system when the value of ϕ is greater than 0.5184 (approximately). This gives a upper bound for the feasible range of values of ϕ. Hence the feasible range of ϕ is [0.2952, 0.5184], approximately.

For the model under revenue sharing contract, the value of ϕ is determined from Equation 13 as 0.71045. This value of the contract parameter is not acceptable to the manufacturer as his profit becomes lower than that in the decentralized system (see Table 1). We, therefore, look for the best possible solution of the problem choosing ϕ from its feasible range. It is found that  , in this case, gives the desired solution. A comparison of the outcome of three models (centralized, decentralized, and revenue sharing) is shown in Table 1.
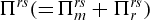
| Model | N | w | p | Retailer's profit | Manufacturer's profit | Total profit |
|---|---|---|---|---|---|---|
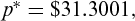
| Centralized | 19 | – | 31.3001 | – | – | 12469 |
| Decentralized | 16 | 28.6944 | 40.7865 | 3186.2 | 5732.5 | 8918.7 |
| Revenue sharing | ||||||
 |
19 |  |
31.3001 | 9828.3 | 2640.5 | 12469 |
 |
19 |  |
31.7326 | 6728.2 | 5732.9 | 12461 |
It is quite obvious from Table 1 that the model under revenue sharing contract provides better result than the decentralized model and inferior result than the centralized model. This observation fulfills our intuition.
We now examine the sensitivity of optimal results in the revenue sharing model with respect to changes in the parameter values as shown in Table 2. While changing the value of one parameter up to  , all other parameters are kept unchanged. Table 2 reveals that the profit of both the acting entities as well as the total profit of the supply chain increase with the increment in the parameter α which, in turn, implies the dependence of the demand on the on-hand inventory of the retailer. As
  i.e. demand becomes independent of the on-hand stock, the profit margin decreases because of lower demand. Profits of both the acting entities as well as the total profit of the supply chain decrease as the deterioration rate θ increases. This is quite obvious as higher deterioration rate means more quantity is damaged within the same time interval. However, both the parameters have negligible impact on the retail price.
 )
)| Retailer's | Manufacturer's | Total | ||||
|---|---|---|---|---|---|---|
| Parameter | Value |  |
 |
profit | profit | profit |
| 0.15 [50%] | 18 | 32.58 |  |
 |
12, 620 | |
| 0.12 [20%] | 19 | 32.45 |  |
 |
12, 495 | |
| 0.11 [10%] | 19 | 32.45 |  |
 |
12, 454 | |
| α | 0.10 [0%] | 19 | 32.46 |  |
 |
12, 414 |
| 0.09 [−10%] | 19 | 32.46 |  |
 |
12, 374 | |
| 0.08 [−20%] | 19 | 32.46 |  |
 |
12, 334 | |
| 0.05 [−50%] | 20 | 32.34 |  |
 |
12, 221 | |
| 0.15 [50%] | 20 | 32.46 |  |
 |
12, 270 | |
| 0.12 [20%] | 19 | 32.51 |  |
 |
12, 355 | |
| 0.11 [10%] | 19 | 32.48 |  |
 |
12, 384 | |
| θ |  |
19 | 32.46 |  |
 |
12, 414 |
| 0.09 [−10%] | 19 | 32.43 |  |
 |
12, 443 | |
| 0.08 [−20%] | 19 | 32.40 |  |
 |
12, 473 | |
| 0.05 [−50%] | 18 | 32.45 |  |
 |
12, 562 | |
| 6.0 [50%] | 19 | 24.12 |  |
 |
 |
|
| 4.8 [20%] | 19 | 28.29 |  |
 |
 |
|
| 4.4 [10%] | 19 | 30.18 |  |
 |
10, 237 | |
| b |  |
19 | 32.46 |  |
 |
12, 414 |
| 3.6 [−10%] | 19 | 35.23 |  |
10038.0 | 15, 110 | |
| 3.2 [−20%] | 19 | 38.71 |  |
12255.0 | 18, 519 | |
| 2.0 [−50%] | 17 | 57.75 | 12797.0 | 24524.0 | 37, 321 |
The total profit as well as the retailer's and manufacturer's profits decrease with the increment of b. The retail price also decreases as b increases. This is due to the fact that as b increases, the demand becomes more vulnerable to the retail price, hence the retail price has to be decreased to keep the market demand in tact. On the contrary, as b decreases, the market demand becomes less vulnerable to the retail price and hence retail price may be increased to enhance profit though it will have a very little impact on the demand.
7. Conclusions
In this paper, we have developed a single-manufacturer single-retailer supply chain model with price- and stock-dependent demand and finite production rate of the manufacturer that varies with the market demand. The assumption of such a composite demand is quite appropriate for many consumer goods displayed in the supermarket. The proposed model has been developed under a revenue sharing contract between the manufacturer and retailer. Numerical results have shown that revenue sharing is definitely a better policy compared to the policy of the decentralized system from the viewpoint of maximizing the total profit of the supply chain. However, the coordination policy for the centralized system is the best strategy in order to maximize the total profit of the supply chain. Future research may be conducted taking the demand pattern to be more realistic. Some more issues, such as inflation or greenness (eco-friendliness) of the goods supplied, which affect the market demand may be taken into consideration. Study of some other kinds of coordination mechanisms between the vendor and the buyer would also be worth attention.
Acknowledgements
The authors are thankful to the anonymous reviewers and the Associate Editor for their helpful comments and valuable suggestions that have improved the quality of the paper significantly. The second author gratefully acknowledges the financial support provided by the University Grants Commission (UGC), India. This work was partially supported by the Department of Science and Technology (DST), Govt. of India under the Grant No. SR/S4/MS: 565/09.
Appendix
 (14)
(14) is given by Equation 9, from which it is clear that
 (15)
(15)

