
MACROECONOMIC RATES OF RETURN OF PUBLIC AND PRIVATE INVESTMENT: CROWDING-IN AND CROWDING-OUT EFFECTS
Abstract
Using annual data from 17 developed economies, we evaluate the macroeconomic effects of public and private investment through a five-variable vector autoregression. From impulse response functions, we assess the extent of crowding-in or crowding-out of both components of investment. We also compute the associated macroeconomic rates of return of public and private investment for each country. The results show the existence of positive effects of public investment and private investment on output. On the other hand, the crowding-in effects of public investment on private investment vary across countries, while the crowding-in effect of private investment on public investment is more generalized.
1 Introduction
In this paper we address the following key questions: does public investment have a significant effect on GDP; and does public investment induce more private investment; we also take into account the impact of private investment. In other words, we ask if crowding-in prevails or if the main result is crowding-out. From a theoretical perspective, a rise in public investment can have two different effects on private investment. First, the need to finance the increase of public investment may imply more taxes or impose a higher demand for funds from the government in the capital markets, therefore causing interest rates to rise, the probable reduction in savings available for private investors leading to a crowding-out effect on private investment. Second, public investment may generate more favourable circumstances for private investment. For example, additional and better infrastructure facilities and potentially improved business conditions may increase the productivity of private investment. This would result in having a crowding-in effect on private investment.
The comparison of investment cost to output returns is crucial in our analysis. Pereira (2000), Pina and St. Aubyn (2005, 2006) and Afonso and St. Aubyn (2008b) computed macroeconomic rates of return before. We extend their methods and results and appraise the macroeconomic effects of public and private investment through a vector autoregression (VAR) analysis using annual data from 14 European Union (EU) countries, plus Canada, Japan and the USA. We compute both public and private investment rates of return, and consider not only the more studied issue of crowding-in and crowding-out of private investment by its public counterpart, but also the effects of private investment on public capital formation decisions. Indeed, private investment may prompt the need for better infrastructure, which could be supplied by the government.
The paper is organized as follows. In Section 2 we briefly review some of the literature and previous results. Section 3 outlines the methodological approach used in the paper regarding both the VAR specification and the analytical framework to compute the macroeconomic rates of return. In Section 4 we present and discuss our results. Section 5 summarizes the paper's main findings.
2 Literature and Stylized Facts
2.1 Related Literature
The relevance of public investment is usually stressed in the implementation of budgetary measures taken by governments, notably its particular growth-enhancing potential. For instance, in the EU, in the context of the Stability and Growth Pact, some proposals have called for the exclusion of public investment from the budget deficit threshold established under the Maastricht Treaty. Moreover, the significance of public investment has been further illustrated by the idea of the golden rule, suggesting that such spending should only be financed by issuing government debt, and also by the imposition of formal rules that budget deficits cannot exceed public investment.1
Since Aschauer's (1989a, 1989b) initial contributions regarding the derivation of the elasticity of output with respect to public capital stock, there has been considerable interest in measuring the effects of public investment on aggregate economic activity, as well as in assessing whether public investment crowds in or crowds out private investment. The results of Aschauer (1989b) indicated that, for the USA, public investment had an overall crowding-in effect on private investment, and that public and private capital could be seen as complementary.2 Therefore, the related relevant economic policy question seems to be whether or not public government investment is productive and does contribute positively to growth, either directly or indirectly via private investment decisions.
Some related studies have addressed the effects of public investment on GDP, and the crowding-in hypothesis in the context of VAR analysis. For instance, Voss (2002) estimates a VAR model with GDP, public investment, private investment, the real interest rate, and price deflators of private and public investment, for the USA and Canada, for the period 1947–96. According to the reported results, innovations to public investment crowd out private investment. Mittnik and Neumann (2001) estimate a VAR with GDP, private investment, public investment and public consumption for six industrialized economies. Their results indicate that public investment tends to exert positive effects on GDP, and that there is no evidence of dominant crowding-out effects.
Argimón et al. (1997) present results that support the existence of a crowding-in effect of private investment by public investment, through the positive impact of infrastructure on private investment productivity, for a panel of 14 Organization for Economic Cooperation and Development (OECD) countries. Additionally, Perotti (2004) and Kamps (2004) assess the output and labour market effects of government investment in a VAR context.
Pereira (2000) estimated a positive macroeconomic rate of return for public investment in the USA. His VAR-based methodology was further developed by Pina and St. Aubyn (2005, 2006), who proposed the distinction between a partial and a total-cost rate of return. Afonso and St. Aubyn (2008b) estimated these rates of return for industrialized countries and also computed private investment rates of return. In this paper, we extend our previously mentioned work by considering a more complete VAR, by computing confidence bands and by generally presenting more detailed explanations and results.
2.2 Some Stylized Facts
The share of both public and private investment in GDP varies across our country sample and also throughout the time sample dimension. These developments are summarized in Table 1.
| Public investment-to-GDP ratios | Private investment-to-GDP ratios | |||||||
|---|---|---|---|---|---|---|---|---|
| 1970 | 1980 | 2005 | Average 1960–2005 | 1970 | 1980 | 2005 | Average 1960–2005 | |
| Austria | 4.8 | 4.2 | 1.1 | 2.9 | 19.8 | 20.4 | 19.7 | 19.9 |
| Belgium | 4.1 | 4.5 | 1.8 | 2.4 | 20.4 | 18.0 | 17.6 | 17.3 |
| Germany | 4.8 | 3.7 | 1.3 | 2.7 | 21.5 | 19.5 | 15.8 | 19.1 |
| Denmark | 4.4a | 3.2 | 1.9 | 2.2 | 19.9 | 16.5 | 17.6 | 17.7 |
| Spain | 2.5 | 1.8 | 3.5 | 3.0 | 23.7 | 20.5 | 25.7 | 20.3 |
| Finland | 4.2 | 3.6 | 3.0 | 3.4 | 23.7 | 23.1 | 16.2 | 20.1 |
| France | 3.7 | 3.2 | 3.3 | 3.3 | 20.1 | 19.7 | 16.1 | 17.3 |
| UK | 4.8 | 2.6 | 2.1 | 2.2 | 14.7 | 16.1 | 14.3 | 15.5 |
| Greece | 2.7 | 2.1 | 3.1 | 2.8 | 23.1 | 26.6 | 21.5 | 20.3 |
| Ireland | 4.0 | 5.6 | 3.8 | 3.2 | 18.5 | 22.3 | 21.7 | 17.7 |
| Italy | 2.8 | 3.0 | 2.7 | 2.8 | 22.5 | 22.1 | 16.8 | 18.7 |
| Netherlands | 5.0 | 3.7 | 3.0 | 3.3 | 22.0 | 18.2 | 16.3 | 18.0 |
| Portugal | 2.1 | 4.0 | 2.9 | 2.9 | 22.4 | 25.6 | 18.2 | 22.1 |
| Sweden | 7.8 | 5.2 | 3.1b | 4.1 | 16.0 | 15.8 | 12.9b | 14.9 |
| Canada | 4.0 | 3.0 | 2.7b | 2.9 | 17.6 | 20.6 | 17.6b | 18.1 |
| Japan | 8.0 | 9.4 | 4.9b | 7.6 | 28.1 | 22.5 | 18.9b | 21.7 |
| USA | 3.2 | 2.7 | 2.6b | 2.6 | 14.7 | 17.6 | 16.0b | 15.9 |
| Maximum | 8.0 | 9.4 | 4.9 | 7.6 | 28.1 | 26.6 | 25.7 | 22.1 |
| (Japan) | (Japan) | (Japan) | (Japan) | (Japan) | (Greece) | (Spain) | (Portugal) | |
| Minimum | 2.1 | 1.8 | 1.1 | 2.2 | 14.7 | 15.8 | 12.9 | 14.9 |
| (Portugal) | (Spain) | (Austria) | (UK) | (USA) | (Sweden) | (Sweden) | (Sweden) | |
- Source: European Commission AMECO database, updated on 14 November 2005.
- Notes: a1971.
- b 2004.
Overall, the public investment-to-GDP ratio has declined for most countries in the sample. On the other hand, a somewhat different pattern emerges in the cases of Greece, Italy, Portugal and Spain, where the public investment-to-GDP ratio either increased, particularly in the 1980s and in the 1990s, or did not decrease significantly. For instance, the rising of the public investment ratio in Spain can be compared with the historical decreases that occurred over the period in such countries as Austria, Belgium, Germany and Denmark. These developments have to be seen against the background of a catching-up effort undertaken by countries such as Greece, Portugal and Spain after EU accession, while in other more mature European economies public investment ratios were already on a downward path.3 Additionally, it is also possible to observe a decline from quite above-average sample levels in the investment ratio for the case of Japan, and a rather stable ratio for the USA.
In terms of private investment ratios, some heterogeneity also prevails in our country sample. For instance, in 1970, private investment-to-GDP ratios ranged from around 15 per cent in such countries as the UK, the USA and Sweden, to around 24 per cent in the cases of Finland, Spain; the ratio even went as high as 28 per cent in the case of Japan. In more recent years, the private investment-to-GDP in Spain was above average, while some upward trends were visible from the second half of the 1990s onwards in countries such as France, Ireland, Italy, Spain and the USA.
3 Methodological Approach
3.1 The VAR Set-up
We estimate a five-variable VAR model for each country throughout the period 1960–2005 using annual data (see Section 4.1 for more detail on country sample and definition of variables). The variables in the VAR are the logarithmic growth rates of real public investment, Ipub, real private investment, Ipriv, real output, Y, real taxes, Tax, and real interest rates, R. The inclusion of output, private investment and public investment is crucial in what concerns the computation of macroeconomic rates of return, as explained later. Taxes and real interest rates are included as they may have important linkages with the above-mentioned key variables.
The VAR model in standard form can be written as
 (1)
(1)where Xt denotes the (5 × 1) vector of the five endogenous variables given by Xt = [Δlog IpubtΔlog IprivtΔlog YtΔlog TaxtΔRt]′, c is a (5 × 1) vector of intercept terms, Ai is the matrix of autoregressive coefficients of order i,and the vector of random disturbances 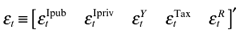 contains the reduced-form ordinary least squares residuals. The lag length of the endogenous variables, p, will be determined by the usual information criteria.
By imposing a set of restrictions, it is possible to identify orthogonal shocks, η, for each of the variables in (1), and to compute these orthogonal innovations via the random disturbances:
 (2)
(2)The estimation of (1) allows Cov(ε) to be determined. Therefore, with the orthogonal restrictions and by means of an adequate normalization we have Cov(η) = I, where I = (5 × 5) identity matrix, and we can write
 (3)
(3) (4)
(4)Since B is a square (n × n) matrix, which in our case has dimension five, B has then 25 parameters that need to be identified. By imposing orthogonality, from (4) only 15 parameters can be determined, essentially from the five variances and from the 10 covariances.4 For the complete identification of the model we need 10 more restrictions. The use of a Choleski decomposition of the matrix of covariances of the residuals, which requires all elements above the principal diagonal to be zero, provides the necessary additional 10 restrictions, and the system is then exactly identified.
We can then impose a lower triangular structure to B−1,
 (5)
(5)which makes it possible to write the residuals εt as a function of the orthogonal shocks in each of the variables:
 (6)
(6)Our VAR is ordered from the most exogenous variable to the least exogenous one, with public investment ordered first. As a result, a shock in public investment may have an instantaneous effect on all the other variables. However, public investment does not respond contemporaneously to any structural disturbances to the remaining variables due, for instance, to lags in government decision making.
In other words, private investment, GDP, taxes and the real interest rate affect public investment sequences with a one-period lag. For instance, a shock in private investment, the second variable, does not have an instantaneous impact on public investment—only on output, taxes and the real interest rate. Moreover, this ordering implies that private investment responds to public investment in a contemporaneous way. In the context of their budgetary planning, governments announce their spending and investment plans in advance. Therefore, economic agents can use such information in making their investment decisions. Additionally, private investment affects GDP contemporaneously. The real interest rate is the least exogenous variable, and it is assumed that its shocks do not affect the other variables simultaneously. Moreover, it does react contemporaneously to shocks to the remaining variables in the model. Market participants observe the developments in tax collection, public investment and economic activity, and can assess the government's ability to finance autonomously or its need of resorting to capital markets. Therefore, we would argue that the yields demanded for the placement of debt adjust endogenously in the market to changes in public demand for financing.
3.2 Computing the Macroeconomic Rates of Return
Based on impulse response functions, we compute four different rates of return: r1, the partial rate of return of public investment; r2, the rate of return of total investment (originated by an impulse to public investment); r3, the partial rate of return of private investment; r4, the rate of return of total investment (originated by an impulse to private investment).
The partial rate of return of public investment is computed as suggested by Pereira (2000). Following an orthogonal impulse to public investment, we can compute the long-run accumulated elasticity of Y with respect to public investment, Ipub, derived from the accumulated impulse response functions of the VAR, as
 (7)
(7)The above-mentioned long-run elasticity is the ratio between the accumulated change in the growth rate of output and the accumulated change in the growth rate of public investment, which will be obtained from the estimation of the country-specific VAR models.
The long-term marginal productivity of public investment is given by
 (8)
(8)Then r1, the partial-cost dynamic feedback rate of return of public investment, is obtained as the solution for
 (9)
(9)As discussed by Pina and St. Aubyn (2005, 2006), this rate could either overestimate or underestimate the return on public investment, as public investment can either crowd in or crowd out private investment respectively. Suppose, for example, that more public capital induces more private investment. The total investment that caused the detected product increase exceeds the public effort, and if one only considers the latter, the rate of return is overstated.
Since private investment also changes, the long-term accumulated elasticity of Y with respect to Ipriv can also be derived from accumulated impulse response functions of the VAR in a similar fashion:
 (10)
(10)and now the long-term marginal productivity of private investment is given by
 (11)
(11)Therefore, computing the marginal productivity of total investment, MPTI, implies taking into account both the long-term marginal productivity of public and private investment, as follows:
 (12)
(12)As in Pina and St. Aubyn (2006), we compute a rate of return of total investment (originated by an impulse to public investment), r2, which is obtained as the solution for
 (13)
(13)In our described benchmark framework we use 20 years to compute both the partial and the total rates of return. In other words, we assume an average life of 20 years for a capital good. For instance, while the average life of a personal computer could be three or four years, the life expectancy of a bridge is certainly to be measured in decades.
The partial rate of return of private investment, r3, is computed in a way analogous to r1. Using the accumulated impulse responses of the VAR following an impulse on private investment, the long-run output elasticity is obtained, and then a marginal productivity and a rate of return can be calculated. As public investment may also respond positively or negatively to private efforts, a rate of return of total investment, r4, is also estimated.
4 Results and Discussion
4.1 Data
We use annual data for 14 EU countries (sample in parenthesis): Austria (1965–2005), Belgium (1970–2005), Denmark (1971–2005), Germany (1970–2005), Finland (1961–2005), France (1970–2005), Greece (1973–2005), Ireland (1971–2005), Italy (1970–2005), the Netherlands (1969–2005), Portugal (1981–2005), Spain (1979–2005), Sweden (1971–2004) and the UK (1970–2005), plus Canada (1964–2004), Japan (1972–2004) and the USA (1961–2004). In order to estimate our VAR for each country, we use information for the following series: GDP at current market prices; price deflator of GDP; general government gross fixed capital formation at current prices, used as public investment; gross fixed capital formation of the private sector at current prices, used as private investment; direct taxes, indirect taxes and social contributions, aggregated into taxes; the nominal long-term interest rate; and the consumer price index.
GDP, taxes and investment variables are transformed into real values using the price deflator of GDP and the price deflator of the gross fixed capital formation of the total economy.5 A real ex post interest rate is computed using the consumer price index inflation rate. All data are taken from the European Commission AMECO database.6
4.2 Estimation of the Five-variable VAR
In the estimation of each country's VAR, GDP, public investment, private investment, taxes and the interest rate are used in real terms. All variables enter the VAR as logarithmic growth rates, except the interest rate, where first differences of original values were taken. Moreover, the unit root analysis that we undertook showed that these first differenced variables are mostly stationary, I(0) time series. Table 2 shows unit root test stastistics.
| Δ log Y | Δ log Ipub | Δ log Ipriv | Δ log Tax | ΔR | ||||||
|---|---|---|---|---|---|---|---|---|---|---|
| t statistic | Critical value | t statistic | Critical value | t statistic | Critical value | t statistic | Critical value | t statistic | Critical value | |
| Austria | −4.97 | −3.59 | −5.23 | −3.59 | −6.57 | −3.59 | −4.46 | −3.59 | −4.83 | −3.62 |
| Belgium | −4.84 | −3.59 | −4.87 | −3.64 | −4.27 | −3.64 | −4.94 | −4.18 | −8.42 | −3.59 |
| Denmark | −5.76 | −3.59 | −4.73 | −3.65 | −3.78 | −3.68 | −3.82 | −3.65a | −10.89 | −3.59 |
| Finland | −3.84 | −3.59 | −6.56 | −3.59 | −3.78 | −3.59 | −5.49 | −3.59 | −6.53 | −3.59 |
| France | −3.18 | −2.93a | −4.45 | −3.64 | −3.70 | −3.64 | −4.29 | −3.60 | −7.49 | −3.59 |
| Germany | −4.71 | −3.59 | −4.33 | −3.59 | −4.34 | −3.59 | −9.87 | −3.64 | −7.46 | −3.59 |
| Greece | −4.85 | −3.59 | −6.57 | −3.59 | −5.68 | −3.59 | −4.79 | −3.59 | −8.15 | −3.66 |
| Ireland | −3.74 | −3.59 | −2.22 | −2.62b | −4.39 | −3.64 | −7.26 | −3.64 | −4.95 | −3.65 |
| Italy | −4.31 | −3.59 | −6.91 | −3.64 | −4.64 | −3.64 | −6.42 | −4.26a | −5.98 | −3.59 |
| Netherlands | −3.19 | −2.93a | −4.62 | −3.64 | −3.90 | −3.64 | −3.79 | −3.63 | −6.25 | −3.59 |
| Portugal | −3.83 | −3.59 | −5.49 | −3.59 | −4.66 | −3.59 | −6.40 | −3.59 | −7.60 | −3.75 |
| Spain | −3.41 | −3.59 | −4.16 | −3.64 | −3.46 | −2.95a | −4.79 | −3.64 | −5.63 | −3.72 |
| Sweden | −4.11 | −3.59 | −3.65 | −3.59 | −3.32 | −2.95a | −3.65 | −2.95a | −12.23 | −3.59 |
| UK | −5.25 | −3.59 | −3.80 | −3.64 | −3.58 | −2.95a | −4.58 | −3.59 | −8.61 | −3.59 |
| Canada | −4.26 | −3.59 | −5.70 | −3.59 | −4.89 | −3.59 | −4.73 | −3.61 | −7.25 | −3.59 |
| Japan | −2.88 | −2.60b | −2.93a | −3.59 | −3.05 | −2.93a | −5.04 | −4.18 | −6.67 | −3.65 |
| USA | −4.96 | −3.59 | −3.65 | −3.59 | −6.05 | −3.59 | −5.43 | −3.59 | −5.23 | −3.59 |
- Notes: Critical values are for 1 per cent level unless otherwise mentioned.
- a 5 per cent level.
- b 10 per cent level.
Note that we chose not to estimate a ‘levels VAR’ or to infer possible cointegration vectors. In fact, one does not expect a long-run relationship between public investment, private investment, taxes, the real interest rate and GDP, or between any two of these five variables, and to force this relationship could introduce an unwanted structure into our empirical endeavour (even if a stable capital-to-GDP ratio would imply a stable investment-to-GDP ratio).
The chosen VAR order used in the estimation of each model was selected with the Akaike and the Schwarz information criteria. Those tests led us to choose a more parsimonious model with only one lag for most of the countries, which helped avoid the use of too many degrees of freedom. With such specifications we usually could not reject the null hypothesis of no serial residual correlation. In addition, we did not reject the null hypothesis of normality of the VAR residuals in most cases. The diagnostic tests regarding residual autocorrelation and normality are also reported in Table 3.
| Autocorrelation test (p value) a | Normality test (p value) b | Number of lags | Number of observations | |
|---|---|---|---|---|
| Austria | 0.423 | 0.000 | 1 | 39 |
| Belgium | 0.379 | 0.214 | 1 | 34 |
| Denmark | 0.100 | 0.247 | 1 | 33 |
| Finland | 0.931 | 0.754 | 1 | 43 |
| France | 0.138 | 0.481 | 1 | 34 |
| Germany | 0.514 | 0.000 | 1 | 34 |
| Greece | 0.215 | 0.335 | 1 | 31 |
| Ireland | 0.233 | 0.259 | 1 | 33 |
| Italy | 0.264 | 0.050 | 1 | 34 |
| Netherlands | 0.101 | 0.445 | 1 | 35 |
| Portugal | 0.349 | 0.112 | 1 | 23 |
| Spain | 0.397 | 0.003 | 2 | 24 |
| Sweden | 0.782 | 0.322 | 1 | 33 |
| UK | 0.934 | 0.310 | 1 | 34 |
| Canada | 0.226 | 0.451 | 1 | 40 |
| Japan | 0.220 | 0.100 | 2 | 31 |
| USA | 0.101 | 0.281 | 1 | 43 |
- Notes: We considered the maximum VAR order to be three. For Germany we included a dummy variable that takes the value one in 1991 and zero otherwise. For Finland and Sweden, a similar dummy variable for 1992 was not statistically significant.
- a Multivariate residual serial correlation Lagrange multiplier test. For the null hypothesis of no serial autocorrelation (of order 1) the test statistic has an asymptotic chi-squared distribution with k2 degrees of freedom.
- b Multivariate Jarque–Bera residual normality test. For the null hypothesis of normality, the test statistic has an asymptotic chi-squared distribution with 8 degrees of freedom.
Additionally, for the case of Germany we included a dummy variable that takes the value of one in 1991 and zero otherwise in order to capture the break in the series related to German reunification. This variable is highly statistically significant in all equations. Moreover, for all cases we chose to privilege the absence of autocorrelation of the residuals, even in the eventuality of the residuals being non-normal.7 As can be seen from Table 3, all p values exceed 10 per cent. Therefore, even at a significance level of 10 per cent, the null hypothesis of no residual autocorrelation cannot be rejected for all countries.
4.3 The Macroeconomic Rates of Return
Table 4 contains information on accumulated responses of all VAR variables to public and private investment innovations.8 A 95 per cent (two standarddeviations) confidence band around estimates is also included. Figures in bold correspond to cases where those confidence bands include positive or negative values only. Note that impulses to public investment are never statistically significant at the 95 per cent level in what concerns effects on other variables. On the other hand, impulses to private investment have in most cases a positive and significant impact on output, and in some instances on taxes.
| Accumulated responses of | Shock to public investment | Shock to private investment | |||||
|---|---|---|---|---|---|---|---|
| −2 S.E. | Central | +2 S.E. | −2 S.E. | Central | +2 S.E. | ||
| Germany | Ipub | 0.027 | 0.048 | 0.069 | −0.010 | 0.015 | 0.039 |
| Ipriv | −0.028 | 0.004 | 0.036 | 0.030 | 0.066 | 0.102 | |
| Y | −0.007 | 0.002 | 0.011 | 0.008 | 0.019 | 0.029 | |
| Taxes | −0.222 | −0.080 | 0.063 | −0.166 | 0.009 | 0.185 | |
| Interest rate | −0.281 | 0.026 | 0.334 | −0.463 | −0.084 | 0.295 | |
| Portugal | Ipub | −0.009 | 0.149 | 0.308 | −0.075 | 0.085 | 0.244 |
| Ipriv | −0.059 | 0.103 | 0.266 | −0.017 | 0.146 | 0.309 | |
| Y | −0.030 | 0.023 | 0.075 | −0.010 | 0.044 | 0.097 | |
| Taxes | −0.031 | 0.027 | 0.086 | −0.010 | 0.049 | 0.109 | |
| Interest rate | −2.710 | −0.839 | 1.031 | −3.534 | −1.640 | 0.253 | |
| Belgium | Ipub | 0.051 | 0.109 | 0.166 | −0.073 | −0.016 | 0.041 |
| Ipriv | −0.101 | −0.046 | 0.009 | 0.035 | 0.089 | 0.143 | |
| Y | −0.013 | −0.001 | 0.010 | 0.001 | 0.013 | 0.025 | |
| Taxes | −0.027 | −0.005 | 0.018 | −0.026 | −0.001 | 0.024 | |
| Interest rate | −0.818 | 0.003 | 0.823 | −1.434 | −0.557 | 0.319 | |
| Finland | Ipub | 0.041 | 0.072 | 0.103 | −0.022 | 0.009 | 0.040 |
| Ipriv | −0.054 | 0.004 | 0.063 | 0.036 | 0.097 | 0.157 | |
| Y | −0.018 | 0.001 | 0.020 | 0.001 | 0.021 | 0.041 | |
| Taxes | −0.019 | 0.006 | 0.031 | −0.002 | 0.025 | 0.051 | |
| Interest rate | −0.642 | 0.471 | 1.584 | −1.232 | −0.017 | 1.198 | |
| Denmark | Ipub | 0.059 | 0.132 | 0.206 | −0.029 | 0.042 | 0.114 |
| Ipriv | −0.049 | 0.025 | 0.099 | 0.048 | 0.120 | 0.193 | |
| Y | −0.005 | 0.007 | 0.020 | 0.008 | 0.020 | 0.032 | |
| Taxes | −0.005 | 0.018 | 0.041 | 0.009 | 0.032 | 0.056 | |
| Interest rate | −0.933 | −0.301 | 0.330 | −0.907 | −0.244 | 0.420 | |
| Austria | Ipub | 0.043 | 0.098 | 0.152 | −0.023 | 0.029 | 0.082 |
| Ipriv | −0.024 | 0.005 | 0.033 | 0.030 | 0.057 | 0.083 | |
| Y | −0.010 | 0.004 | 0.018 | 0.002 | 0.016 | 0.030 | |
| Taxes | −0.022 | −0.001 | 0.020 | 0.003 | 0.024 | 0.045 | |
| Interest rate | −0.385 | 0.018 | 0.421 | −0.850 | −0.443 | −0.036 | |
| Canada | Ipub | 0.032 | 0.058 | 0.084 | −0.011 | 0.012 | 0.034 |
| Ipriv | −0.057 | −0.022 | 0.014 | 0.028 | 0.061 | 0.093 | |
| Y | −0.018 | −0.004 | 0.011 | 0.000 | 0.014 | 0.028 | |
| Taxes | −0.027 | −0.006 | 0.014 | 0.006 | 0.026 | 0.045 | |
| Interest rate | −0.507 | 0.099 | 0.705 | −1.180 | −0.592 | −0.003 | |
| Japan | Ipub | −0.035 | 0.088 | 0.210 | −0.089 | 0.073 | 0.235 |
| Ipriv | −0.082 | −0.030 | 0.022 | −0.018 | 0.060 | 0.138 | |
| Y | −0.039 | 0.000 | 0.040 | −0.012 | 0.040 | 0.093 | |
| Taxes | −0.083 | −0.005 | 0.073 | −0.018 | 0.085 | 0.188 | |
| Interest rate | −1.675 | 0.480 | 2.635 | −1.713 | 1.104 | 3.921 | |
| Spain | Ipub | −0.048 | 0.040 | 0.127 | −0.066 | 0.087 | 0.240 |
| Ipriv | −0.040 | 0.004 | 0.048 | −0.008 | 0.071 | 0.150 | |
| Y | −0.010 | 0.003 | 0.016 | −0.001 | 0.022 | 0.046 | |
| Taxes | −0.031 | −0.002 | 0.026 | −0.008 | 0.041 | 0.091 | |
| Interest rate | −0.614 | 0.218 | 1.049 | −1.493 | −0.131 | 1.231 | |
| France | Ipub | 0.009 | 0.040 | 0.072 | −0.018 | 0.022 | 0.062 |
| Ipriv | −0.040 | −0.004 | 0.031 | 0.024 | 0.067 | 0.110 | |
| Y | −0.007 | 0.002 | 0.011 | 0.004 | 0.016 | 0.027 | |
| Taxes | −0.010 | 0.007 | 0.023 | −0.014 | 0.007 | 0.028 | |
| Interest rate | −0.583 | −0.009 | 0.565 | −1.299 | −0.573 | 0.153 | |
| UK | Ipub | 0.063 | 0.170 | 0.277 | −0.040 | 0.040 | 0.120 |
| Ipriv | −0.102 | −0.049 | 0.004 | 0.024 | 0.065 | 0.106 | |
| Y | −0.022 | −0.006 | 0.009 | 0.006 | 0.019 | 0.031 | |
| Taxes | −0.033 | −0.011 | 0.011 | −0.009 | 0.010 | 0.029 | |
| Interest rate | −1.102 | −0.170 | 0.763 | −1.249 | −0.448 | 0.353 | |
| Greece | Ipub | 0.036 | 0.127 | 0.218 | −0.158 | −0.055 | 0.047 |
| Ipriv | −0.025 | 0.028 | 0.081 | 0.035 | 0.092 | 0.149 | |
| Y | −0.011 | 0.009 | 0.028 | −0.005 | 0.017 | 0.040 | |
| Taxes | −0.019 | 0.002 | 0.022 | −0.017 | 0.007 | 0.031 | |
| Interest rate | −1.966 | −0.873 | 0.220 | −2.348 | −1.106 | 0.136 | |
| Ireland | Ipub | −0.045 | 0.103 | 0.252 | −0.008 | 0.188 | 0.383 |
| Ipriv | −0.131 | −0.052 | 0.026 | 0.011 | 0.115 | 0.218 | |
| Y | −0.039 | −0.005 | 0.029 | −0.008 | 0.038 | 0.083 | |
| Taxes | −0.029 | −0.007 | 0.015 | −0.014 | 0.016 | 0.046 | |
| Interest rate | −1.347 | 0.466 | 2.279 | −3.137 | −0.680 | 1.777 | |
| Italy | Ipub | 0.034 | 0.078 | 0.122 | −0.008 | 0.044 | 0.096 |
| Ipriv | −0.041 | −0.009 | 0.022 | 0.022 | 0.058 | 0.095 | |
| Y | −0.011 | 0.001 | 0.013 | −0.002 | 0.013 | 0.028 | |
| Taxes | −0.006 | 0.019 | 0.044 | −0.029 | 0.002 | 0.034 | |
| Interest rate | −0.220 | 1.337 | 2.893 | −2.719 | −0.799 | 1.121 | |
| Netherlands | Ipub | 0.026 | 0.061 | 0.096 | −0.010 | 0.026 | 0.062 |
| Ipriv | −0.066 | −0.026 | 0.013 | 0.024 | 0.065 | 0.105 | |
| Y | −0.021 | −0.005 | 0.011 | 0.004 | 0.021 | 0.038 | |
| Taxes | −0.058 | −0.028 | 0.002 | −0.016 | 0.016 | 0.048 | |
| Interest rate | −0.776 | −0.165 | 0.446 | −1.113 | −0.451 | 0.211 | |
| Sweden | Ipub | 0.031 | 0.070 | 0.110 | −0.072 | −0.032 | 0.008 |
| Ipriv | −0.059 | 0.008 | 0.074 | 0.025 | 0.095 | 0.165 | |
| Y | −0.014 | 0.000 | 0.015 | 0.000 | 0.015 | 0.031 | |
| Taxes | −0.039 | −0.005 | 0.030 | −0.003 | 0.034 | 0.071 | |
| Interest rate | −0.721 | 0.023 | 0.766 | −0.969 | −0.146 | 0.677 | |
| USA | Ipub | 0.018 | 0.049 | 0.080 | −0.005 | 0.021 | 0.046 |
| Ipriv | −0.060 | −0.024 | 0.012 | 0.031 | 0.061 | 0.090 | |
| Y | −0.009 | 0.002 | 0.014 | 0.010 | 0.020 | 0.029 | |
| Taxes | −0.023 | −0.001 | 0.022 | 0.023 | 0.041 | 0.059 | |
| Interest rate | −1.068 | −0.440 | 0.187 | −0.923 | −0.371 | 0.182 | |
- Notes: The numbers in bold are statistically significant at the 95 per cent level. All variables are logarithmic growth rates, except the interest rate, where first differences of original values were taken.
- Ipub, public investment; Ipriv, private investment; Y, GDP; Taxes, direct and indirect taxes plus social security contributions; S.E., standard error.
Table 5 reports the computed output elasticity and the rates of return of public and private investment for each country for the respective period of available data. Overall, one can observe that the output elasticity of private investment is always positive and higher than the output elasticity of public investment.
| (a) Impulse on public investment | |||||
|---|---|---|---|---|---|
| Output elasticity | MPIpub | Partial rate of return (%) | MPTI | Total rate of return (%) | |
| Austria | 0.049 | 1.602 | 2.39 | 0.465 | −3.76 |
| Belgium | −0.011 | −0.434 | na | 0.215 | −7.40 |
| Denmark | 0.055 | 2.540 | 4.77 | 1.000 | 0.00 |
| Finland | 0.015 | 0.441 | −4.01 | 0.329 | −5.41 |
| France | 0.050 | 1.526 | 2.14 | 3.500 | 6.46 |
| Germany | 0.047 | 1.719 | 2.74 | 1.121 | 0.57 |
| Greece | 0.068 | 2.390 | 4.45 | 0.927 | −0.38 |
| Ireland | −0.052 | −1.597 | na | 0.902 | −0.51 |
| Italy | 0.014 | 0.510 | −3.30 | 2.560 | 4.81 |
| Netherlands | −0.090 | −2.721 | na | 2.020 | 3.57 |
| Portugal | 0.152 | 5.182 | 8.57 | 0.835 | −0.90 |
| Spain | 0.079 | 2.665 | 5.02 | 1.551 | 2.22 |
| Sweden | 0.005 | 0.126 | −9.81 | 0.090 | −11.33 |
| UK | −0.036 | −1.623 | na | 1.571 | 2.28 |
| Canada | −0.068 | −2.308 | na | 1.769 | 2.89 |
| Japan | 0.001 | 0.014 | −19.12 | 1.164 | 0.76 |
| USA | 0.047 | 1.826 | 3.06 | −0.923 | na |
| (b) Impulse on private investment | |||||
| Output elasticity | MPIpriv | Partial rate of return (%) | MPTI | Total rate of return (%) | |
| Austria | 0.289 | 1.454 | 1.89 | 1.353 | 1.52 |
| Belgium | 0.150 | 0.863 | −0.73 | 0.886 | −0.60 |
| Denmark | 0.168 | 0.949 | −0.26 | 0.909 | −0.47 |
| Finland | 0.213 | 1.061 | 0.30 | 1.044 | 0.21 |
| France | 0.233 | 1.351 | 1.52 | 1.272 | 1.21 |
| Germany | 0.280 | 1.468 | 1.94 | 1.423 | 1.78 |
| Greece | 0.186 | 0.915 | −0.44 | 0.999 | −0.01 |
| Ireland | 0.328 | 1.855 | 3.14 | 1.428 | 1.80 |
| Italy | 0.208 | 1.112 | 0.53 | 1.690 | 2.66 |
| Netherlands | 0.321 | 1.783 | 2.93 | 1.660 | 2.57 |
| Portugal | 0.298 | 1.348 | 1.51 | 1.252 | 1.13 |
| Spain | 0.317 | 1.558 | 2.24 | 1.321 | 1.40 |
| Sweden | 0.161 | 1.082 | 0.40 | 1.193 | 0.89 |
| UK | 0.285 | 1.839 | 3.09 | 1.689 | 2.65 |
| Canada | 0.232 | 1.284 | 1.26 | 1.245 | 1.10 |
| Japan | 0.671 | 3.09 | 5.81 | 2.168 | 3.94 |
| USA | 0.322 | 2.03 | 3.60 | 1.920 | 3.31 |
- Notes: We use the average of the GDP-to-investment ratios for the period 1960–2005 (or starting later, depending on data availability; see notably the sample sizes in Section 4.1).
- na, not available—the rate of return cannot be computed in this case since the marginal productivity is negative; see, for instance, equation (12) in the text; MPIpub, marginal productivity of public investment; MPIpriv, marginal productivity of private investment; MPTI, marginal productivity of total investment.
In those cases where rates of return can be calculated or, in other words, whenever the marginal productivity is positive, the partial rate of return of public investment is mostly positive, with the exceptions of Finland, Italy and Sweden. Taking into account the induced effect on private investment, the total rate of return associated with public investment is generally lower, with the exception of France, and even negative for the cases of Austria, Finland, Greece, Portugal and Sweden.
Regarding private investment (panel (b) of Table 5), we can notice that partial marginal productivity is positive for all countries. The same is true for the associated total marginal productivity, which takes into account the effects of private investment on public investment. The partial rates of return of private investment are mostly positive, with the exception of Belgium, Denmark and Greece, where the rate is moderately negative. The total rate of return of private investment is mostly somewhat below the partial rate of return, albeit slightly higher in the cases of Italy, Greece and Sweden.
4.4 Crowding-in and Crowding-out Effects
On the basis of the values of the partial marginal productivity of public investment, it is possible to determine the impact of public investment on output. That information, taken from Table 5, is displayed on the horizontal axis of Fig. 1. Additionally, on the vertical axis we plot the marginal effects of public investment on private investment, which allows us to assess the possible existence of crowding-in or crowding-out effects of public investment on private investment. Such effects can be easily derived from

Public Investment: Marginal Productivity (Horizontal) and Marginal Effect on Private Investment (Vertical) (1960–2005)Note: AUT, Austria; BEL, Belgium; CAN, Canada; DEU, Germany; DNK, Denmark; ESP, Spain; FIN, Finland; FRA, France; GBR, the United Kingdom; GRC, Greece; IRL, Ireland; ITA, Italy; JAP, Japan; NLD, the Netherlands; PRT, Portugal; SWE, Sweden; USA, the United States.
 (14)
(14)As Fig. 1 shows, public investment has a crowding-in effect on private investment in eight of the 17 countries analysed. Of the nine countries in which there is a crowding-out effect on private investment, four (France, Italy, Japan and the USA) still experience a slight output expansion, while Belgium, Ireland, Canada, the Netherlands and the UK show a contractionary effect.
Figure 2 shows the values of the marginal productivity of private investment and the marginal effects of private investment on public investment. This chart is useful in visualizing both the effect of private investment on output and the existing crowding-in or crowding-out effects of private investment on public investment.

Private Investment: Marginal Productivity (Horizontal) and Marginal Effect on Public Investment (Vertical) (1960–2005)Note: AUT, Austria; BEL, Belgium; CAN, Canada; DEU, Germany; DNK, Denmark; ESP, Spain; FIN, Finland; FRA, France; GBR, the United Kingdom; GRC, Greece; IRL, Ireland; ITA, Italy; JAP, Japan; NLD, the Netherlands; PRT, Portugal; SWE, Sweden; USA, the United States.
Figure 2 also reveals that private investment has a crowding-in effect on public investment for most of the countries in the sample, while it crowds out public investment in the cases of Belgium, Greece and Sweden. In addition, private investment has an expansionary effect on output for all countries in the sample.
Finally, we also performed a sensitivity analysis by using only 10 years for both public and private investment, to compute the partial rates of return, and also by assuming differentiated horizons, for the accumulated responses, with 20 and 10 years respectively for public and for private investment innovations. The results, not reported in the paper, provided similar overall conclusions.
5 Conclusion
Public investment can either crowd in or crowd out private investment. In strong crowding-out cases, it is possible that increased public investment could lead to a decrease in GDP. In our paper, using a VAR analysis for 14 EU countries, plus Canada, Japan and the USA between 1960 and 2005, we estimated that public investment had a contractionary effect on output in five cases (Belgium, Ireland, Canada, the UK and the Netherlands) with positive public investment impulses leading to a decline in private investment (crowding-out). On the other hand, expansionary effects and crowding-in prevailed in eight cases (Austria, Germany, Denmark, Finland, Greece, Portugal, Spain and Sweden).9
These effects correspond to point estimates and care should be taken in their interpretation, as 95 per cent confidence bands concerning public investment effects on output always include the zero value.
When it is possible to compute it, the partial rate of return of public investment is mostly positive, with the exceptions of Finland, Italy, Japan and Sweden. Taking into account the induced effect on private investment, the total rate of return associated with public investment is generally lower, with the exception of France, and negative for the cases of Austria, Finland, Greece, Portugal and Sweden, countries where the increase in GDP was not sufficiently high to compensate for the total investment effort.
Private investment impulses, in contrast, were always expansionary in GDP terms and effects were usually significant in statistical terms. Public investment responded positively to private investment in all but three countries (Belgium, Greece and Sweden). The highest estimated (partial) rate of return was in Japan, 5.81 per cent, and there were very few cases of slightly negative private investment rates of return, either partial or total—Belgium, Denmark and Greece.
Appendix: Data Sources
| Original series | AMECO codesa |
|---|---|
| GDP at current market prices, thousands national currency | 1.0.0.0.UVGD |
| Price deflator of GDP, national currency, 1995 = 100 | 3.1.0.0.PVGD |
| Gross fixed capital formation at current prices; general government, national currency | 1.0.0.0.UIGG |
| Gross fixed capital formation at current prices; private sector, national currency | 1.0.0.0.UIGP |
| Price deflator gross fixed capital formation; total economy, national currency; 1995 = 100 | 3.1.0.0.PIGT |
| Nominal long-term interest rates—% | .1.1.0.0.ILN |
| National consumer price index—1995 = 100 | .3.0.0.0.ZCPIN |
| Current taxes on income and wealth (direct taxes); general government—national currency, current prices | .1.0.0.0.UTYGF |
| Taxes linked to imports and production (indirect taxes); general government—national currency, current prices | .1.0.0.0.UTVGF |
| Social contributions received; general government—national currency, current prices | .1.0.0.0.UTSGF |
- Note: aSeries from the European Commission AMECO database.