A dog model to study ovary, ovarian ligament and visceral pain
Abstract
Objective A dog model was developed to study visceral pain by stimulating the ovarian ligament.
Study design Prospective experimental trial.
Animals Twelve 1-year old female hound dogs weighing 25.7 ± 3.6 kg.
Methods Dogs were anesthetized with sevoflurane. The right ovary was accessed via laparoscopy. A suture was placed around the ovarian ligament and exteriorized through the abdominal wall for stimulation. The noxious stimulus consisted of pulling the ovary and ovarian ligament with a force transducer. The response to noxious stimulation was determined using the anesthetic minimum alveolar concentration requirement (MAC) for sevoflurane. The ovarian MAC was compared to the standardized somatic noxious stimulation tail clamp MAC. The results are depicted as mean ± SD and corrected to sea-level.
Results The stimulus–response curve during ovarian stimulation in three dogs was hyperbolic and best represented by a three-parameter logistic growth curve model. The curve plateaued at 7.12 ± 4.19 N. From the stimulus-response curve, we chose 6.61 N to test the consistency and repeatability of the model in nine dogs. The ovarian stimulation MAC for sevoflurane in these dogs was 2.16 ± 0.46%. The ovarian stimulation confidence interval and limits are comparable to the results from tail stimulation MAC. The tail stimulation MACs before and after laparoscopy surgery were not different (1.86 ± 0.28% and 1.77 ± 0.38% respectively; p > 0.05) but lower when compared to the ovarian MAC (p < 0.01). The dogs recovered from anesthesia without complications.
Conclusions and clinical relevance The ovarian stimulation model is an adequate and repeatable means of producing visceral stimulation to determine MAC. The model may provide a humane mechanism to study the effectiveness of analgesics for acute ovarian pain.
Introduction
Ovarian stimulation pain is observed during spay surgeries in small animals. In addition, abdominal and pelvic pain is a common complaint in women suffering from ovulation, ovarian cysts, ovarian inflammation, abscess, neoplasia or pelvic inflammatory disease (Crossman 2006; Binder et al. 2007). To our knowledge, no model is available to study pain arising from the ovary in an in vivo setting. Previous in vivo models only studied the response arising from the vagina and uterus (Berkley 2005).
Today we know that pain management is fairly specific. For example, some drugs may work for neuropathic pain but not for acute pain (Gilron 2002; Rose & Kam 2002; Finnerup et al. 2005). Opioids are commonly used for analgesia but in some people may cause paradoxical hyperalgesia (Mitra 2008). Non-steroidal anti-inflammatory drugs (NSAIDs) may provide analgesia in both dogs and humans but depend on patient idiosyncrasies (Lascelles et al. 2005). Thus, laboratory and clinical data support the need to treat pain according to individual needs, pain source, pain mechanisms and drug properties (Cohen et al. 2004). A model to study ovarian pain should allow researchers to find adequate treatments for ovarian pain in both veterinary and human medicine.
In the present study, we report a canine model to study and evaluate the anesthetic requirements when stimulating the ovary. We used the anesthetic minimum alveolar concentration (MAC) method as an indicator for a nociceptive response (Eger et al. 2003).
Material and methods
The study was approved by the Colorado State University Animal Care and Use Committee. Twelve, healthy, 1 year old, female hound dogs with a mean ± SD weight 25.7 ± 3.6 kg were used. Prior to the study; physical examination, blood cell count, blood chemistry and fecal examination were all within normal limits.
Anesthesia was induced using a mask with 5% sevoflurane carried in oxygen (O2) at 5 L minute−1. Following induction, orotracheal intubation was performed and anesthesia was administered via the cuffed endotracheal tube with sevoflurane at a vaporizer setting of 2% and O2 flow of 2 L minute−1. End-tidal sevoflurane (E′sevo), O2 and CO2 were continuously monitored (Biochem 9100, BCI International, WI, USA). The end-tidal agent analyzer was calibrated at the beginning of every study using three different known sevoflurane standard concentrations (1.5%, 2.5% and 3.5%). Inspired O2 was maintained >90% and expired CO2 at 30–40 mmHg (4–5.3 kPa) using intermittent positive pressure ventilation (IPPV). Cephalic venous and dorsal pedal arterial catheters were placed for fluid administration and direct blood pressure monitoring, respectively. The dogs were positioned in dorsal recumbency.
Animals were monitored using ECG, direct blood pressure and esophageal temperature (Power Lab amplifiers from ADInstruments, CO, USA). The respiratory rate, inspired O2, end-tidal CO2 and end-tidal sevoflurane concentrations were monitored using the respiratory gas analyzer as previously described. The dogs received intravenous fluids (Lactated Ringer’s, Baxter, IL, USA) at 5 mL kg−1 hour−1 and esophageal temperature was maintained between 37.5–39 °C using a heated blanket. At the end of each study, bilateral laparoscopic ovariectomy was performed and dogs were recovered from anesthesia. For post-operative pain management, the dogs received ketoprofen 1 mg kg−1 and hydromorphone 0.1 mg kg−1 SQ while waking up from anesthesia. The dogs received a single dose of antibiotic (cephalexin 22 mg kg−1 IV) to prevent infection at the end of the study. All dogs recovered without complications and normal behavior returned the same day (e.g. eating, drinking, walking, playing).
The study was divided into 2 groups. The first group was used to determine the stimulus – response curve for the model. The second group was used to test the consistency, repeatability and comparison of the model. This second group was used for three different phases. Phase I determined MAC during tail stimulation. Phase II determined MAC during ovarian stimulation. Phase III determined MAC during tail stimulation after laparoscopic surgery to assess the influence of laparoscopy surgery and time on MAC.
Group 1
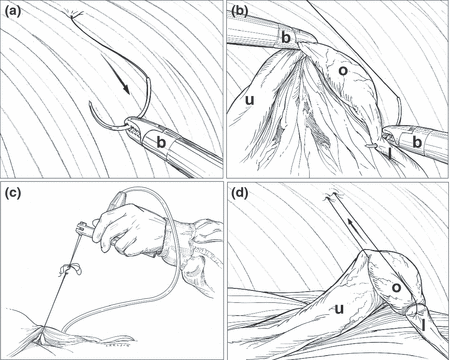
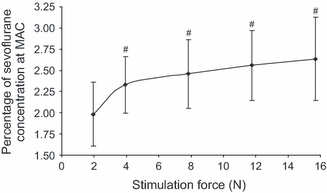
Three dogs were used to create a stimulus – response curve using ovarian stimulation. A standard laparoscopic surgical technique for ovariectomy was performed gaining access to the abdominal cavity with three 5 mm cannulas along the ventral mid-line (linea alba). The abdomen was insufflated with CO2 to an intra-abdominal pressure between 6–10 mmHg. The right ovary was identified and fastened with 2-0 biosyn suture (MWI Veterinary Supply, CO, USA) by passing the suture through the ovarian ligament. The suture was exteriorized through the abdominal wall. The abdomen was deflated and the cannulas and incision sites were covered with sterile drapes for ovarian traction stimulation. Sterility at the surgical site was maintained throughout the study (Fig. 1). The ovarian MAC was determined using 1.96, 3.92, 7.84, 11.76 and 15.69 N to create the curve. Ovary and ovarian ligament stimulation was performed with a calibrated Grass force displacement transducer that has a force rate range of 0.05–2 kg mm−1 (0.5–20 N) and maximum load of 10 kg (see Fig. 1c; FT03, ADInstrument, CO, USA). The ovarian MAC was determined in triplicate and the response considered (+) when the dog showed a purposeful movement or (−) when no purposeful movement was observed during 1 minute of ovarian stimulation. Based on the response, the E′sevo was increased or decreased by 10% for the next stimulus. Fifteen minutes were allowed between stimuli for anesthetic equilibration. The MAC values were corrected using the calibration values and barometric pressure.

Procedure diagram. (a): Intra-abdominal view of 2-0 byosin suture penetrating the abdominal wall. The needle is manipulated inside the abdominal cavity with Babcock forceps (b). (b): The suture passes through and around the ovarian ligament (l) and ovary (o). (c): The suture is exteriorized through the abdominal wall for manual stimulation. The stimulus is performed with a calibrated force transducer to quantify the tension used. (d): During stimulation, the suture will pull the ovary and ovarian ligament inducing a visceral response. The uterus (u) moves during stimulation but not enough to induce a noxious response.
For group 1, values are depicted as mean ± SD. Various non-linear growth curves were considered using the Akaike’s information criterion for the best fit. Model parameters were estimated using the maximum likelihood method. The bootstrap technique was used to calculate the standard error of the estimated traction force required for the curve to reach plateau. The stimulus – response curve was analyzed using sas statistical software (version 9.2, SAS Institute, NC, USA). In this group, we tested to see if MAC changed over time. We stimulated the dogs with 3.92 N at the beginning of the study and recorded MAC. At the end of the study, which was 4–5 hours and at least 30 stimulations later, MAC was recorded again using the same force (3.92 N).
Group 2
Nine dogs were used in group 2 to test the consistency and repeatability of the model. All three phases were carried out during the same anesthetic period.
Phase I
Thirty minutes after induction of anesthesia (as described above) and of E′sevo steady state, the tail was stimulated using Carmalt forceps to determine MAC, as previously described in the dog (Steffey & Howland 1977; Johnson et al. 1998; Solano et al. 2006). The forceps were positioned randomly along the tail and a supra-maximal stimulus was applied lasting 1 minute. If the dog showed purposeful movement the stimulus was stopped and the response considered positive (+). If the dog did not move the response was considered negative (−). Based on the response, the E′sevo was either increased if positive or decreased if negative by 10% for the next stimulus. At least 15 minutes were allowed after reaching the new concentration before the next stimulus was applied. The MAC response was determined in triplicate, corrected for calibration values and barometric pressure. The reported MAC numbers are adjusted to sea-level.
Phase II
After laparoscopic surgery (as described above) and 30 minutes at 2%E′sevo the ovary was stimulated using the calibrated Grass force displacement transducer using 6.61 N. This force was chosen from group 1 as being above the start of the plateau in the force-response curve but not likely to cause tissue damage. Tissue damage to the ovary and ovarian ligament were assessed macroscopically during stimulation using the endoscope.
Similar to the tail MAC, the ovarian MAC was determined in triplicate and the response considered (+) when the dog showed a purposeful movement or (−) when no purposeful movement was observed during 1 minute of ovarian stimulation. Based on the response, the E′sevo was increased or decreased by 10% for the next stimulus. Fifteen minutes were allowed between stimuli for anesthetic equilibration. The MAC values were corrected using the calibration values and barometric pressure.
Phase III
The tail MAC was re-determined after laparoscopic surgery in duplicate using the same methods from Phase I. Phase III was designed to evaluate the influence of laparoscopic surgery during MAC determinations.
To compare the MAC determinations between phase I, II and III, a repeated measures analysis of MAC (anova) followed by a Bonferroni test was used. The frequency of distribution and confidence interval for each MAC determination was calculated and depicted. The analysis was performed using the software graphpad prism (version 4.00 for Windows, GraphPad Software, CA, USA).
At the end of the study, bilateral ovariectomy was performed laparoscopically in all dogs. The incision sites were closed with 3-0 nylon and all dogs recovered from anesthesia without complications. By the end of that day, all dogs had normal attitude, playing behavior, locomotion, appetite and thirst. No pain or discomfort was observed at any time. The skin sutures were removed 10 days after surgery and all dogs were adopted within the local community.
Results
Group 1


Stimulus – response curve. The stimulus – response curve for sevoflurane MAC when different stimulation forces were applied to the right ovary. The mean ± SD of sevoflurane MAC was measured using the end-tidal sevoflurane concentration. The stimulation force was recorded using a force transducer. # indicates MAC values that were different when compared to 1.96 N. The remaining MAC values were not different between them (p > 0.05).
Above, the 3-parameter logistic growth curve formula in which yij is the sevoflurane requirement (%) for subject i at measurement time point j. si is the random subject effect and εij is the overall error. Xij is the log (traction force) for subject i at measurement time point j. The parameter c denotes the plateau of the growth curve, a denotes the intercept parameter and b the slope parameter.
MAC using forces below 1.96 N were not determined during the stimulus – response curve because the dogs started moving spontaneously at these low sevoflurane concentrations. In this group of dogs, we tested the response to ovarian stimulation over time. At the beginning of the stimulus – response curve the MAC for 3.92 N was 2.33 ± 0.34%. At the end of the study after 4–5 hours of anesthesia and at least 30 stimulation tests the MAC for the same force (3.92 N) was 2.28 ± 0.30%, which was not different from the original MAC (p = 0.77). The results indicate that the model did not become hypo-responsive or hyper-responsive throughout the study.
Group 2
Phase I
In nine dogs, the tail MAC obtained at the beginning of the study and before laparoscopy surgery was 1.86 ± 0.28%, which is slightly lower than the dog tail MAC using sevoflurane published elsewhere (Kazama & Ikeda 1988 [2.36 ± 0.46%]; Scheller et al. 1990 [2.1 ± 0.23%]; Galloway et al. 2004 [2.13 ± 0.10%]).
Phase II
To test the model consistency and repeatability, we chose 6.61 N of force as the model standard. This force is considered supra-maximal such that a stronger stimulus should not influence the MAC value significantly. This force of 6.61 N did not cause any macroscopic tissue damage. Tissue damage was observed only when traction forces were above 15 N when the ovary or ovarian ligament started to tear.
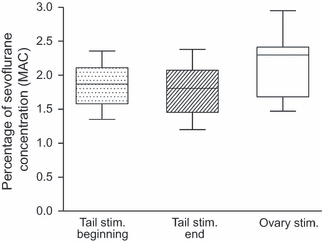
The predicted MAC using the three dogs from the stimulus – response curve for 6.61 N was 2.42% (confidence interval was 1.26 to 3.06%). The measured ovarian MAC in the nine dogs was 2.16 ± 0.46%, which is not different to the predicted value (p = 0.52). This is a sign of consistency between dog populations.
Descriptive statistics and box plot graphs indicated that the variability, distribution, confidence interval and confidence limits were comparable between ovary and tail MAC. However, the ovary MAC was consistently higher than the average tail MAC (Fig. 3 and Table 1). The ovary MAC was 0.41 ± 0.24% higher when compared to the tail MAC in 8 of the 9 dogs (p < 0.01). In the remaining dog, the ovary and tail MACs were similar.

Tail and ovary MAC. Box plot graph indicating and comparing the descriptive statistics between the ovary and tail MAC. The median, 25% and 75% percentile and minimum and maximum values are depicted.
| Tail MAC beginning of study | Tail MAC end of study | Ovary MAC | |
|---|---|---|---|
| Lower 95% CI of Mean | 1.6 | 1.47 | 1.8 |
| Upper 95% CI of Mean | 2.11 | 2.06 | 2.52 |
- MAC, minimum alveolar concentration.
Phase III
The tail MAC was determined again to characterize the influence of laparoscopic surgery and time on MAC determination. The tail MAC from Phase III was 1.77 ± 0.38%. The tail MAC from Phase I and III using the same dogs were not different (p > 0.05) showing no influence from laparoscopy surgery on MAC determination.
Discussion
Based on our observations, stimulation of the ovary and ovarian ligament in dogs is an adequate and repeatable means of producing visceral stimulation to determine MAC. The idea was to create a model to study visceral and ovarian pain. The response observed during ovarian stimulation in this model was similar to the clinical response observed during visceral traction in anesthetized dogs.
The principal for MAC determination is the average anesthetic concentration required to cause immobility in 50% of the subjects exposed to a supramaximal painful/noxious stimulus (Eger et al. 2003). Thus, MAC is not considered the best method to assess analgesia but rather is the anesthetic requirement to prevent the response to a painful/noxious challenge. However, all potent and common analgesic drugs used in medicine decrease the MAC in dogs and humans (Murphy & Hug 1982; McEwan et al. 1993; Kelly et al. 1994; Eger et al. 2003; Machado et al. 2006; Ko et al. 2009). Thus, MAC determination can be used to test the response of different drugs during a painful/noxious stimulus. If a particular drug reduces the MAC, then further studies are required to determine the true analgesic effect of the drug in awake patients. The advantages of MAC determination during nociceptive assessment are: it provides a controlled environment decreasing variability; subjects are anesthetized preventing the emotional response to nociceptive stimulation; it is a well accepted method and has clinical applicability.
Visceral models to study female reproductive tract pain are sparse (Ness & Gebhart 1990). Vaginal and uterine nociceptive pathways have been studied but to our knowledge no model has been developed to study ovarian pain (Cervero 1994; Berkley 2005). One in two women may suffer reproductive tract pain at least once in their life (Okusnya et al. 2009). On the other hand, intra-abdominal surgeries in veterinary medicine such as spay surgeries stimulate the ovary causing undesired autonomic responses (Fox et al. 1994; Brennan 1999; Looney et al. 2008; Wagner et al. 2008). Thus ovarian pain should be better addressed to institute adequate treatments.
The model was consistent and repeatable within each animal and between animals during MAC determinations. The ovarian stimulation period consisted of at least 4 hours with multiple stimulations. No desensitization or hyperalgesia was observed at any point.
The model is comparable to standard MAC studies performed in the dog. MAC studies have been performed during skin incision, tail or toe clamp and electrical stimulation (Valverde et al. 2003). A consideration from the study is that all the dogs tested were young and roughly of the same size (20–30 kg). We do not know if age or size will influence the response.
Additional advantages from the model are that female dogs will get spayed at the end of the study and the model is not terminal. The dogs can then be offered for adoption. The only obvious disadvantage from the model is the need for the laparoscopic equipment and technique and the potential for intra-abdominal infection.
In conclusion, the ovary and ovarian ligament stimulation model appears to be an adequate and repeatable means of producing visceral stimulation to determine MAC in dogs. The model may provide a humane mechanism to study the effectiveness of analgesics for acute ovarian pain.


