Integration of CO2 flux and remotely-sensed data for primary production and ecosystem respiration analyses in the Northern Great Plains: potential for quantitative spatial extrapolation
ABSTRACT
Aim Extrapolation of tower CO2 fluxes will be greatly facilitated if robust relationships between flux components and remotely sensed factors are established. Long-term measurements at five Northern Great Plains locations were used to obtain relationships between CO2 fluxes and photosynthetically active radiation (Q), other on-site factors, and Normalized Difference Vegetation Index (NDVI) from the SPOT VEGETATION data set.
Location CO2 flux data from the following stations and years were analysed: Lethbridge, Alberta 1998–2001; Fort Peck, MT 2000, 2002; Miles City, MT 2000–01; Mandan, ND 1999–2001; and Cheyenne, WY 1997–98.
Results Analyses based on light-response functions allowed partitioning net CO2 flux (F) into gross primary productivity (Pg) and ecosystem respiration (Re). Weekly averages of daytime respiration, γday, estimated from light responses were closely correlated with weekly averages of measured night-time respiration, γnight (R2 0.64 to 0.95). Daytime respiration tended to be higher than night-time respiration, and regressions of γday on γnight for all sites were different from 1 : 1 relationships. Over 13 site-years, gross primary production varied from 459 to 2491 g CO2 m−2 year−1, ecosystem respiration from 996 to 1881 g CO2 m−2 year−1, and net ecosystem exchange from −537 (source) to +610 g CO2 m−2 year−1 (sink). Maximum daily ecological light-use efficiencies, ɛd,max = Pg/Q, were in the range 0.014 to 0.032 mol CO2 (mol incident quanta)−1.
Main conclusions Ten-day average Pg was significantly more highly correlated with NDVI than 10-day average daytime flux, Pd (R2 = 0.46 to 0.77 for Pg-NDVI and 0.05 to 0.58 for Pd-NDVI relationships). Ten-day average Re was also positively correlated with NDVI, with R2 values from 0.57 to 0.77. Patterns of the relationships of Pg and Re with NDVI and other factors indicate possibilities for establishing multivariate functions allowing scaling-up local fluxes to larger areas using GIS data, temporal NDVI, and other factors.
INTRODUCTION
The increasing concentrations of atmospheric CO2 require a better understanding of ecosystem fluxes, factors that determine the magnitudes of fluxes, the potential for mitigation, and the feedbacks of ecosystems on climate. During the 1990s the attention of CO2 flux studies was directed toward establishing and expanding flux tower networks and developing methodology. More recently, quantitative biogeochemistry of terrestrial carbon cycling has entered a new phase with higher quality instrumentation and the addition of new sites. These advances and the accumulated data now allow comparative analyses, modelling, synthesis, and scaling-up of local flux measurements (Falge et al., 2002; Gilmanov et al., 2003a,b; Turner et al., 2003a; Gilmanov et al., 2004). The concept of ecoregions is providing a natural framework of data integration, modelling, and scaling-up (Gilmanov et al., 2003b) that needs to be integrated with the top-down approaches of atmospheric models. The Northern Great Plains of North America represents a group of ecoregions where adequate CO2 flux data are being secured to allow first attempts at regional generalizations, modelling, extrapolations, and spatial scaling-up.
Though substantial areas of the Northern Great Plains are used for crop production, significant parts of this province remain unploughed and are used as rangelands. Quantification of the parameters for carbon cycle in Northern Plains grasslands is an essential part of the general task to evaluate the carbon budget of North America (Sobecki et al., 2001; Wofsy & Harriss, 2002). Many of the early methods for studying carbon budgets of grazing lands can be traced back to the International Biological Program (Coupland, 1979; Breymeyer & Van Dyne, 1981) with its emphasis on both net primary production and field photosynthesis based on measurements from towers and chambers. Presently, improved technology allows tower-based systems to secure continuous long-term measurements of carbon fluxes at the ecosystem scale (Baldocchi et al., 1988; Dugas, 1993; Dugas et al., 1997) and under reasonably natural conditions. Nevertheless, these are still point measurements with limited fetch areas. Quantitative extrapolations and scaling-up of these tower measurements are now urgently needed for carbon cycle research. Achieving these quantitative regional estimates will require the integration of remote sensing, geographical information systems, and mathematical modelling (Hall et al., 1995; Running et al., 1999; Cias et al., 2001; Wylie et al., 2002; Dolman et al., 2003; Körner, 2003a, 2003b; Potter et al., 2003; Todorovski et al., 2003; Xiao et al., 2004).
Two major topics are considered in this paper. First, based on analysis of long-term CO2 flux measurements at five stations in the region, we establish quantitative characteristics of the carbon cycle (gross primary production, ecosystem respiration, net ecosystem exchange, and radiation use efficiency). Second, we examine relationships among the CO2 exchanges, the remotely-sensed Normalized Difference Vegetation Index (NDVI), and other environmental factors. Such relationships will be used to scale-up tower measurements to obtain regional-scale estimates of the carbon budget of Northern Great Plains grasslands. This phenomenologically-based method of upscaling will allow us to estimate regional fluxes more accurately, to identify and map sources and sinks of carbon in spatial and temporal space, and to monitor their changes in relation to modifications of climate and management.
MATERIALS AND METHODS
Grasslands of the Northern Great Plains of North America (Fig. 1) are principally found within the 42nd (North-western Glaciated Plains), 43rd (North-western Great Plains), and 25th (northern part of the Western High Plains) Omernick ecoregions (Omernik, 1987; McMahon et al., 2001). These grasslands, described by the loose term ‘mixed grasslands’, possess both C3 and C4 species thereby exploiting both warm summer periods and cooler spring and fall seasons (Tieszen et al., 1997). Their productivity, however, may still be limited by the length of the growing season, which is interrupted by a long winter ‘dormant season’ when air temperature may drop below −20 °C and soil may cool below −10 °C. On the other hand, high summer precipitation and its efficient use due to lower temperatures and longer daylight periods allow northern grasslands to achieve productivity rates comparable to mixed prairies of the Southern Great Plains, which have longer growing seasons.
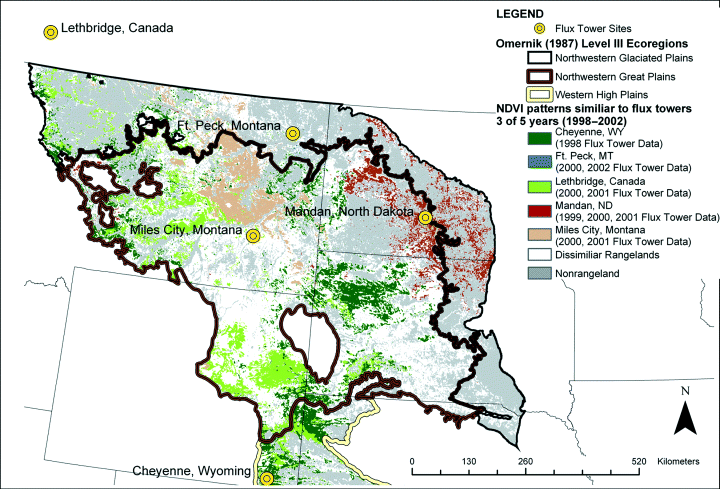
Grassland areas with seasonal NDVI patterns similar to those at flux towers for the locations and years used in this study (1998–2001). Representativeness of the tower sites, defined on the basis of Euclidian distance in the multidimensional ecological space with monthly NDVI values as coordinates, was estimated as: Cheyenne — 13%; Fort Peck — 1%; Lethbridge — 10%; Mandan — 6%; Miles City — 7%.
Since the mid-1990s, continuous measurements of CO2 exchange have been conducted at five stations within the Northern Great Plains region: Mandan, ND, Miles City, MT, and Cheyenne, WY, belong to the USDA–ARS Agriflux Network (Svejcar et al., 1997), while towers at Lethbridge, Alberta, Canada, and Poplar (Fort Peck Indian Reservation), MT, belong to Ameriflux network (Baldocchi, 2003). Measurements at the Mandan, Miles City, and Cheyenne sites were obtained using the Bowen ratio — energy balance (BREB) technique (Dugas, 1993; Dugas et al., 1999). Measurements at Lethbridge and Fort Peck sites are based on the eddy covariance principle and follow the Ameriflux protocol (Baldocchi, 2003). Table 1 summarizes principal ecological characteristics of the sites; site-specific features of tower operation, data processing and gap filling are available (LeCain et al., 2000; Frank & Dugas, 2001; Meyers, 2001; Flanagan et al., 2002; Frank, 2002; Meyers, 2003; Haferkamp & MacNeil, 2004).
| Site, ecosystem | Latitude, Longitude | Elevation, m | Precipitation, mm | Mean January/July temperature, °C | Dominant plant species | Leaf area index (max) | Soil |
|---|---|---|---|---|---|---|---|
| Lethbridge, northern mixed/ shortgrass prairie | 49°42′ N 112°56′ W | 960 | 378 | −8.6/18.0 | Agropyron dasystachyum (Hook.) Scrib., Pascopyronsmithii Rydb., Tragopogon dubius Scop. | 0.9 | Orthic dark-brown chernozem, clay-loam |
| Fort Peck, northern mixed prairie | 48°18′ N 105°06′ W | 634 | 310 | −11.9/18.0 | Agropyron dasystachyum (Hook.) Scrib., Pascopyron smithii Rydb., Stipa spp.; Bouteloua gracilis (H.B.K.) Lag. | 0.4 | Sandy loam |
| Miles City, northern mixed prairie | 46°18′ N 105°58′ W | 719 | 343 | −8.7/23.5 | Pascopyron smithii (Rydb.), Bouteloua gracilis (H.B.K.) Lag., Stipa comata Trin. and Rupr., Carex spp. | 0.27 | Eapa, fine-loamy, mixed-frigid Aridic Agriborolls |
| Mandan, Mixed prairie | 46°46′ N 100°55′ W | 518 | 404 | −12.2/21.2 | Bouteloua gracilis (H.B.K.) Lag., Stipa comata Trin and Rupr., Stipa viridula Trin., Carex spp., Pascopyrum smithii (Rybd) Löve, Poa pratensis L. | 0.48 | Werner-Sen-Chama complex, loam, silt-loam and silty clay loam; Entic and Typic Haploborolls |
| Cheyenne, Mixed prairie | 41°11′ N 104°54′ W | 1910 | 397 | −2.5/17.5 | Pascopyrum smithii (Rydb.), Stipa comata (Trin and Rupr.), Bouteloua gracilis ((H.B.K.) Lag.) | 0.79 | Ascaloln sandy loam; mixed, mesic, Aridic Argiustoll |
Modelling
Temporal dynamics of CO2 in the air between the soil and the CO2 sensor (in non-forest ecosystems usually located between 1.5 and 4 m above the ground) are the result of the interactions of processes summarized in Fig. 2. Let AirCO2(t) be the total amount of CO2 between the soil surface and the sensor; Pg the rate of gross photosynthesis; Re rate of total ecosystem respiration; and F, the CO2 flux from atmosphere to ecosystem (when F > 0), or from ecosystem to atmosphere (when F < 0) at the sensor level. Total ecosystem respiration (Re) is the sum of autotrophic and heterotrophic respiration (Ra and Rh), which in turn include above- and below-ground components. The conservation equation for the amount of CO2 between the soil surface and the sensor (AirCO2) becomes:
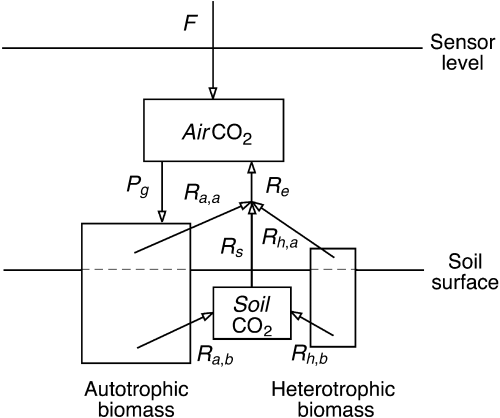
Box-flow diagram of the processes of CO2 dynamics in the air between the soil surface and the flux sensor: AirCO2— amount of CO2 in the air between the sensor and the soil surface; F— CO2 flux rate measured by the sensor (ecophysiological sign convention: F is positive when CO2 goes from atmosphere to ecosystem; negative in the opposite direction); Pg— gross primary productivity; Ra,a— above-ground autotrophic respiration; Rh,a— above-ground heterotrophic respiration; Ra,b– below-ground autotrophic respiration; Rh,b— below-ground heterotrophic respiration; SoilCO2— amount of CO2 in the soil air; Rs = Ra,b + Rh,b–dSoilCO2/dt— soil respiration; Re = Ra,a + Rh,a + Rs = Ra,a + Ra,b + Rh,a + Rh,b–dSoilCO2/dt— total ecosystem respiration.
 (1)
(1)From this it immediately follows that the flux of CO2 from the atmosphere to ecosystem, F, measured by the sensor, is equal to the difference between gross productivity and ecosystem respiration plus the storage term:
 (2)
(2)In BREB towers, where CO2 flux is measured at approximately 1.5 m height, determination of the storage term is not included in the measurement protocol, and the flux F is approximated as:
 (3)
(3)In some eddy covariance systems, measurements of the storage term are included (Flanagan et al., 2002), while in other cases the storage term is neglected, and approximation (3) is used similarly to BREB systems (Meyers, 2001). In the following consideration, the term F is assumed to include the storage correction, when available, otherwise approximation (3) will be used.
Because processes controlling CO2 exchange during daytime (when photon flux density Q > 0) and night-time (Q = 0) are different, for modelling purposes it is convenient to introduce two additional variables, daytime flux, P:
 (4)
(4)and daytime ecosystem respiration, Rd. The major equations for subsequent analysis may be formulated as:
 (5)
(5)Radiation use efficiencies
In the context of ecosystem-scale analysis, it is important to distinguish between physiological and ecological light-use efficiencies. Physiological coefficient of light-use efficiency of the gross primary productivity, ɛphys, is defined as the ratio of gross photosynthetic assimilation, Pg, to absorbed photosynthetically active radiation, Qa (Larcher, 1995):
 (6)
(6)It is the most direct indicator of radiation use efficiency at the level of individual plants. Nevertheless, determination of ɛphys at the ecosystem scale is rather complicated because it is difficult to measure all necessary radiation components in the plant canopy. Although approaches to estimate Qa through both direct and indirect measurements are currently under development (Monteith, 1994; Asner et al., 1998; Sinclair & Muchow, 1999; Asner et al., 2003), serious difficulties of precise estimation of absorbed radiation and, consequently, of ɛphys remain (e.g. Demetriades-Shah et al., 1992, 1994).
As an alternative to ɛphys, ecological radiation use efficiency, ɛecol, is defined as a ratio of gross productivity to total incoming photosynthetically active radiation (Odum, 1959; Cooper, 1970; Austin et al., 1978; Colinvaux, 1993; Wofsy et al., 1993):
 (7)
(7)In contrast to ɛphys, ɛecol depends not only on physiological plant properties but also on such ecosystem-scale characteristics as above-ground green biomass, leaf area index, etc. For example, a sparse stand with certain physiological light-use efficiency ɛphys will have lower ecological efficiency ɛecol than a more dense stand with the same value of ɛphys. Following Wofsy et al. (1993) who described ɛecol as a ‘well defined property of the ecosystem’, in this paper, we will use ecological efficiency to compare light-use efficiency in different ecosystems (later in this paper ecological efficiency will be denoted by ɛ without a subscript).
Light-response functions and their parameterization
The daytime CO2 flux, P, may be influenced by a variety of factors, however, photosynthetically active radiation, Q, is usually the dominant driver. Our experience, based on the analysis of thousands of daily data sets for different ecosystem types shows that only in special circumstances (drought, extreme heat or cold, nutrient deficiency, pests and disease, etc.) do other factors assume the leading role in determining daytime CO2 exchange. To describe the general relationship of the daytime flux, P, to photosynthetically active radiation, Q, and, if necessary, its other factors-predictors, {Xi}, we use the concept of the ecosystem-scale light-response function:
 (8)
(8)where {ai, i = 1, … , p} are numerical parameters. We have found that of the great variety of light-response relationships P(Q, …) available in the literature, the nonrectangular hyperbolic function (Prioul & Chartier, 1977):
 (9)
(9)and its soil temperature (Ts) dependent modification describing the hysteresis of the radiation-flux relationship:
 (10)
(10)are especially convenient tools to describe patterns of light-response of ecosystem-scale fluxes at the 20–30 min time step during non-rainy days (Gilmanov, 2001; Gilmanov et al., 2003a, 2003b, 2004). Interpretation of parameters in equations 9 and 10 are well known: α is the initial slope of the light response curve, β is its plateau parameter, equal to the maximum rate of gross photosynthesis, γ is the respiration term, and θ is the curvature parameter (0 ≤ θ ≤ 1), modifying the shape of light-response curve from hyperbolic at θ = 0 to linear at θ = 1. The coefficient κ in the exponential term of equation 10 describes the strength of the hysteresis of the light-response curve.
Parameters α, β, γ, θ, and κ of equations 9 and 10 that provide the best fit for daytime fluxes were identified using the ‘Global Optimization’ package of the Mathematica® system (Loehle Enterprises, 2001). Examination of seasonal dynamics showed that parameters α, β, γ, and, to a lesser extent, θ, have distinct seasonal patterns, α(t), β(t), γ(t), and θ(t), which can be used for gap-filling purposes.
Estimating Rd from daytime flux measurements
Following Marshall & Biscoe (1980), we estimated daytime ecosystem respiration, Rd, using the γ parameter of the light-response function (9) or  (10). Comparing daytime respiration estimates thus obtained with directly measured night-time fluxes (Gilmanov et al., 2003a, 2003b, 2004) demonstrated that light-curve derived estimates of γ are in fair agreement with values measured by tower during night (Rn). Combining Rd estimates with measured Rn values results in 24 h ecosystem respiration values Re = Rd + Rn. Integration of P(t) from sunrise to sunset for every calendar day j gives daytime production, Pd(j), which combined with daytime respiration integral, Rd(j) leads to estimation of daily gross primary production, Pg(j):
 (11)
(11)While the classical rectangular light-response model P(Q) = αQβ/(αQ + β) − γ typically overestimates daytime respiration, Rd, due to its inability to describe the curvature of the P(Q) relationship, estimates from non-rectangular hyperbolic eqn. (10) may also lead to overestimation of Rd because (especially under drought stress) a decrease of P corresponding to the lower branch of the hysteresis loop may in fact be caused not only by an increase in respiration rate due to higher temperature (described by the term  ) but also to a decrease in the rate of photosynthetic accumulation, e.g. as the result of stomatal regulation.
Annual CO2 budgets
Finally, plotting the curves of daily integrals of Pg, Pd, and F on the same graph provides complete characterization of the seasonal dynamics of ecosystem CO2 exchange (see Fig. 7a–d below). Note that the area between the Pg and F curves is equal to total ecosystem respiration, Re, while areas between Pg and Pd and Pd and F correspond to daytime and night-time respiration totals, respectively.
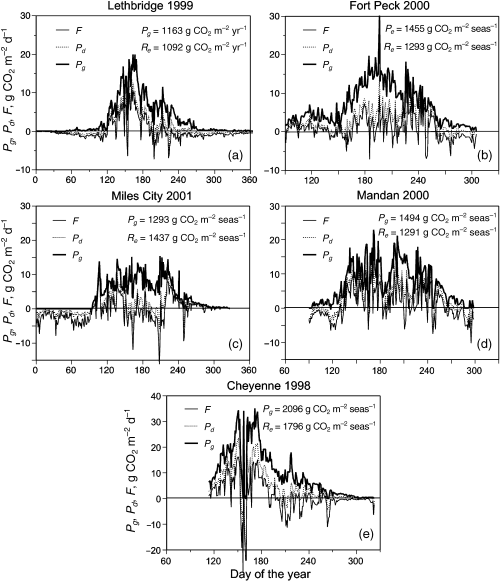
Seasonal dynamics of gross primary productivity Pg, daytime productivity Pd, and net ecosystem CO2 exchange F of the Northern Great Plains grasslands for selected years: (a) Lethbridge 1999; (b) Fort Peck (2000); (c) Miles City 2001; (d) Mandan 2000; (e) Cheyenne (1998). The area between the Pg and F curves represent total ecosystem respiration (Re = Pg– F); area between Pg and Pd is daytime respiration (Rd = Pg–Pd); and area between Pd and F is nighttime respiration (Rn = Pd–F).
Flux–NDVI relationship
During the three-decade long history of studies, considerable progress has been made in understanding the relationships among the extensive (e.g. biomass, leaf area, moisture content) and intensive (e.g. photosynthesis, evapotranspiration, respiration, net primary productivity, net CO2 exchange) characteristics of terrestrial ecosystems, on the one side, and various remotely sensed variables (indices), on the other side. Compared to early studies relating satellite spectral variables to biomass of various ecosystem types (Tucker et al., 1983; Prince & Tucker, 1986), contemporary researchers are using remotely sensed indices to differentiate a wide array of biophysical properties of vegetation surfaces in terms of quality and quantity of biomass, its phenological status, moisture content, and productivity characteristics. Correlative and functional relationships were established between vegetation indices and fluxes of energy, water, and carbon dioxide in green canopies of different communities (Bartlett et al., 1990; Gamon et al., 1995; Veroustraete et al., 1996; Frank & Karn, 2003; Xiao et al., 2004). Normalized difference vegetation index (NDVI) is defined as (Rouse et al., 1973):
 (12)
(12)where Rnir and Rred are reflectances in the near-infrared and red spectral bands, respectively. Yoder & Waring (1994) and Gamon et al. (1995) identified NDVI as quantifying potential photosynthetic activity or an indicator or physiological change at the canopy level. NDVI became the vegetation index most widely used in the context of ecosystem studies because it was shown to be closely related to biomass (Wylie et al., 2002; Boelman et al., 2003), biomass moisture (Chladil & Numez, 1995), leaf area index (Seen et al., 1995; Gower et al., 1999), absorbtion of photosynthetically active radiation (Hall et al., 1995; Gower et al., 1999), trends of photosynthesis and transpiration (Running & Nemani, 1988; Slayback et al., 2003), respiration (Boelman et al., 2003; Wylie et al., 2003) and CO2 uptake (Frank & Karn, 2003; Wylie et al., 2004). On the other hand, NDVI has been shown to be sensitive to view angle effects (Epiphanio & Huete, 1995), standing dead or litter biomass (Huete & Jackson, 1987), saturation at high LAI (Gao et al., 2000), and soil and atmospheric effects. The Soil Adjusted Vegetation Indices (SAVI) and other SAVI related indices attempt to minimize soil background effects while the Enhanced Vegetation index (EVI) attempts to minimize both atmospheric and soil effects (Huete et al., 1997). However, SAVI was found to be more sensitive to view angle than NDVI (Epiphanio & Huete, 1995). Broge & Leblanc (2001) found NDVI to outperform SAVI on low or moderate levels of LAI, which are more typical for arid and semiarid rangelands. Purevdorj et al. (1998) found both a SAVI index and NDVI to track rangeland vegetation cover the best over a wide range of grass densities and Seen et al. (1995) found NDVI to track LAI well when atmospheric effects were minimized. Similarly, according to unpublished data by Gallo et al. (2004), comparison of MODIS EVI and NDVI at 4347 random US grassland locations, shows a strong linear relationship between the two indices with no increased scatter in NDVI at low index values where soil background effects should be important, and a larger dynamic range of NDVI over EVI. Given the historical NDVI data sets on record and because each index has its own weaknesses, we used NDVI in this study.
Until recently attempts to model the dynamics of the principal components of the ecosystem CO2 exchange on geographical scales (gross primary production, ecosystem respiration, soil respiration, net primary production, net ecosystem production, etc.) were based largely on net primary production estimates (mostly represented by above-ground production, ANPP), soil respiration, and, since the mid-1990s, net ecosystem CO2 exchange, F, provided by flux tower networks. Because F is the difference of two large and oppositely directed components, gross photosynthetic assimilation and ecosystem respiration (F = Pg – Re), it was found difficult to establish relationships between F and remotely-sensed factors and to use net flux data sets to differentiate among various models. Based on the analysis of AVHRR–NDVI data, Box et al. (1989) found little consistent relationship across different vegetation types, between NDVI and net biospheric CO2 flux. Contemporary literature is abundant with empirical models representing gross primary productivity using the radiation-use efficiency approach when Pg is expressed as a product of Pg,max and factor modifiers representing the ‘effects’ of radiation f1(Q) or absorbed radiation f1a(Qa), air (or soil) temperature f2(T), relative air humidity or other moisture factor f3(M) and, possibly, other factors: Pg = Pg,max * f1(Q) * f2(T) * f3(M) * … (e.g. Gilmanov, 1977; Prince & Goward, 1995; Ruimy et al., 1996; Running et al., 1999; Tian et al., 1999; Ciais et al., 2001; Medlyn et al., 2003; Veroustraete et al., 2004). Such models may have limited robustness given high correlations among radiation input, temperature, and humidity; and Choudhury (2001) has reasonably cautioned about possible regional biases. Their apparent ability to generate ‘reasonable’Pg values and maps may be explained by the fact that typically (with few exceptions: Aber et al., 1996; Reich et al., 1999) they were validated only against ANPP data (with monthly or biweekly time step) or at best against net flux {F = Pg – Re} data sets leaving wide room for calibration of model parameters. Nevertheless, even most recent models of this type occasionally demonstrate errors as high as several hundreds of per cent when compared with the tower flux measurements (Veroustraerte et al., 2004). In contrast, in those rare cases when Pg data were available for validation, multiplicative radiation-use efficiency models show poor agreement with tower flux-based Pg curves (e.g. Ruimy et al., 1996; Turner et al., 2003b).
Our experience with analysis and modelling of the net CO2 flux data sets from a number of CO2 flux towers in grasslands and shrublands (Wylie et al., 2003; Gilmanov et al., 2004; Wylie et al., 2004) has also demonstrated rather weak relationships between F and spectral vegetation indices (e.g. NDVI), contrary to the earlier opinion by Bartlett et al. (1990). We found that daytime CO2 flux integrals (Pd) are more closely correlated with NDVI, than 24-h F integrals (Wylie et al., 2003). With the emergence of the methods for estimation of daytime ecosystem respiration based on daytime flux measurements using light response function analysis allowing net CO2 flux partitioning into Pg and Re components (Gilmanov, 2001; Suyker & Verma, 2001; Falge et al., 2002; Gilmanov et al., 2004; Xu & Baldocchi, 2004), the first long-term data sets of Pg and Re values became available. Analysis of these data sets in relation to vegetation indices revealed significantly higher correlations between Pg and NDVI than between Pd and NDVI (the latter, in its turn, is more highly correlated with NDVI than 24-h net CO2 flux integral) (Wylie et al., 2003; Gilmanov et al., 2004).
To examine relationships between ecosystem-scale CO2 exchange and remotely-sensed NDVI we used data from the SPOT VEGETATION dataset integrated over 10-day time steps. More specifically, SPOT VEGETATION NDVI data were represented by temporally smoothed (Swets et al., 1999) 10-day maximum value composite NDVI values (http://www.vgt.vito.be/). To match this level of aggregation, corresponding 10-day statistics for Q, Pg, Pd, Re and other variables (temperature, precipitation, moisture, etc.) were calculated. Analysis of the relationships of gross primary productivity and ecosystem respiration to NDVI and other environmental factors indicates that combining NDVI with other factors may further improve predictive power of models for Pg and Re compared to models based only on NDVI. Formally speaking, we are looking for models in the form:
 (13)
(13) (14)
(14)where {Xi, i = 1, … , n} are additional predictors for photosynthesis, {Yj, j = 1, … , m} denote additional predictors for ecosystem respiration, fP(NDVI, X1, X2, … , Xn) and fR(NDVI, Y1, Y2, … , Ym) are multivariate functions to be identified, and eP and eR are random error terms with certain stochastic characteristics.
It should be emphasized that within the framework of a ‘black box’ approach when only external driving factors (e.g. meteorological variables) are allowed as members of the sets {Xi} and {Yj}, the chances of finding models (13) and (14) with acceptable predictive power might not be very high. Nevertheless, these chances are improved by switching to the ‘grey box’ models, when the input data sets {Xi} and {Yj} are allowed to include variables characterizing internal state of the ecosystem such as green biomass (leaf area index), soil water content, soil temperature, stage of phenological development, etc., as well as their remotely-sensed surrogates such as NDVI.
RESULTS AND DISCUSSION
Light-response functions
Light response of daytime CO2 fluxes can be fit by the non-rectangular hyperbolae (9), as illustrated by Fig. 3, for various sites characterizing days with favourable conditions (e.g. no moisture stress) and high photosynthesis. On days with substantial drought stress, a hysteresis loop is observed on the light-response curves, so that the morning branch of the P(Q) curve lies higher than the evening branch (Fig. 4a,b,c,d,e left). In such cases, daytime flux dynamics are better described by the light-response function P(Q, Ts) depending not only on photosynthetically active radiation (Q) but also on soil temperature (Ts).
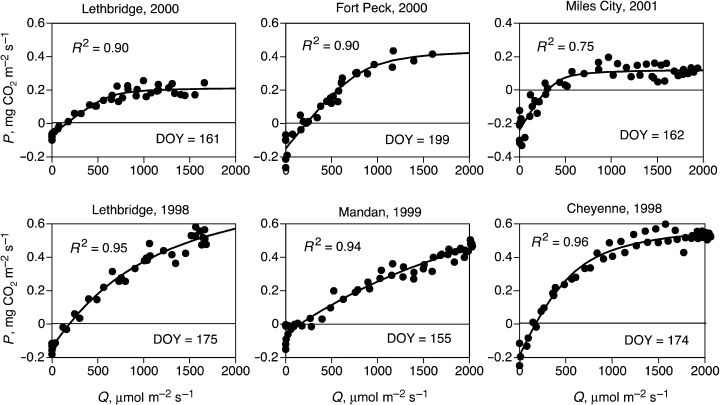
Light-response curves for days with high productivity at several sites fit with a nonrectangular hyperbolic model (9). The Lethbridge site was dry in 2000 and wet in 1998.
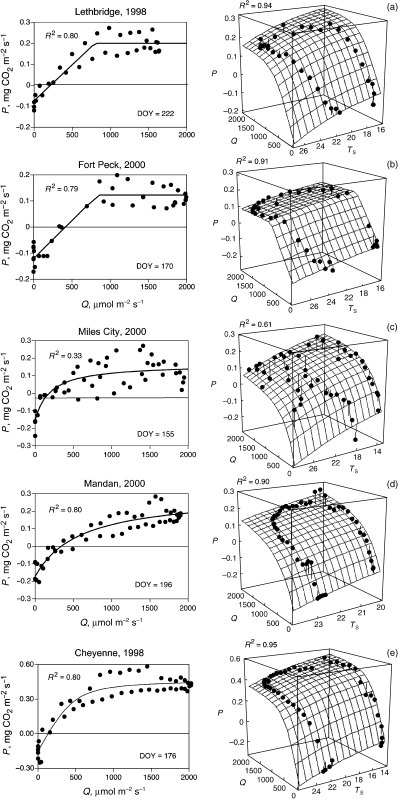
Bivariate light-response functions P(Q, Ts) (right) provide a better fit of the observed pattern of diurnal CO2 exchange for days with hysteresis on the {Q, P} plots than monovariate non-rectangular hyperbolae P(Q) (left): (a) Lethbridge (1998), day 222; (b) Fort Peck (2000), day 170; (c) Miles City 2000, day 155; (d) Mandan 2000, day 196; and (e) Cheyenne (1998), day 176.
The parameters of light-response functions exhibited seasonal patterns of variation at all sites (Fig. 5). These patterns are characterized by the maximum values of the apparent quantum yield, α; the maximum photosynthetic rates, β; and the daytime ecosystem respiration values, γ, occurring at the peak of the season (June–July). This pattern, however, is complicated by the fluctuations reflecting weather peculiarities during portions of some seasons. Maximum weekly average values for all three parameters were observed for the most productive Cheyenne site: αmax,wk = 1.50 g CO2 (mol quanta)−1 = 0.034 mol CO2 (mol quanta)−1; βmax,wk = 1.25 mg CO2 m−2 s−1, and γmax,wk = 0.275 mg CO2 m−2 s−1. Parameters α, β and γ established in this study for Northern Great Plains grasslands are definitely lower than those determined by Luo et al. (2000) for the sunflower culture under mesocosm conditions. They do lie, however, between the values established for sagebrush steppe in the US Intermountain West (Gilmanov et al., 2003a) and true steppe in Kazakhstan (Gilmanov et al., 2004) at the lower end and the values for mixed prairie, pasture, tallgrass prairie and the winter wheat crop in Oklahoma (Gilmanov et al., 2003b) at the upper end.
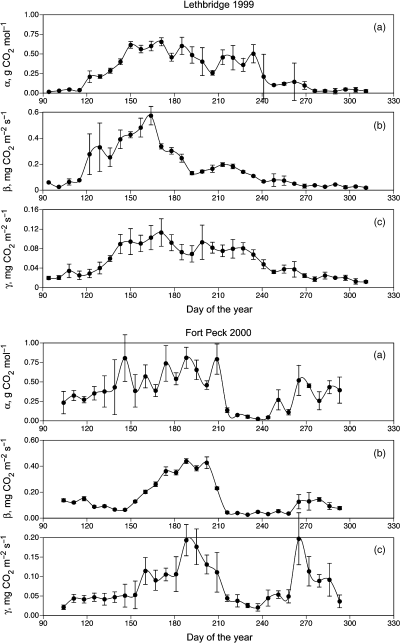
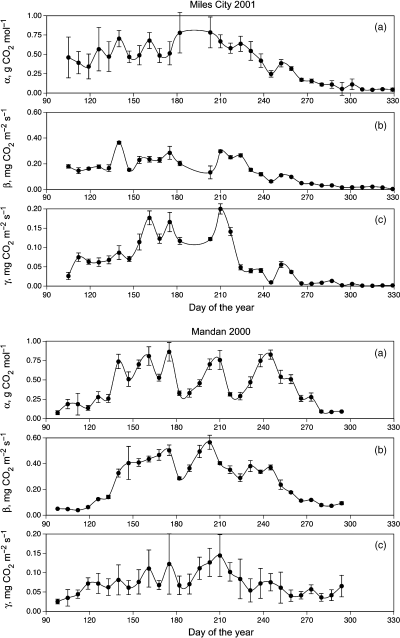
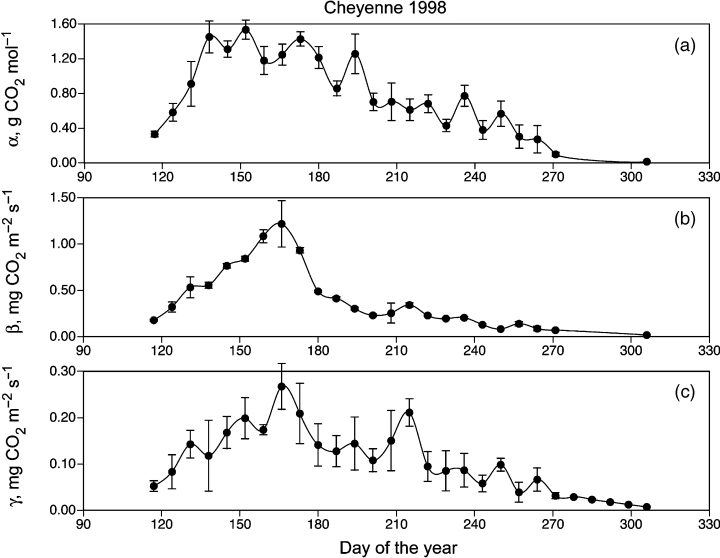
Seasonal dynamics of the light-response parameters obtained by fitting nonrectangular hyperbolic equations 9 or 10 to data from selected sites and years: a — quantum yield, α; b — maximum gross photosynthesis, β; and c — average daytime respiration, γ. Dots represent 7-day means of parameters; error bars show standard deviations of parameter values within the 7-day bins.
We evaluated our light-response estimates of daytime respiration, γday, by comparing them with directly measured night-time respiration rates, γnight (Fig. 6). In all five cases, close linear relationships between γday and γnight were observed (Table 2) with R2 coefficients from 0.64 (Mandan) to as high as 0.95 (Lethbridge). On all the five graphs, more points occur above the 1 : 1 line than below it, indicating that on average, estimated daytime respiration γday is higher than the measured night-time respiration γnight. To test the hypothesis that deviation of the regression line from the 1 : 1 diagonal is due to random errors only, ellipses describing the 99% critical zones for this hypothesis in the parametric space {b0, b1} were constructed. At all sites, points (b0, b1) describing observed regressions γday = b0 + b1γnight lie outside these ellipses, demonstrating that the regressions are different from the 1 : 1 relationships.
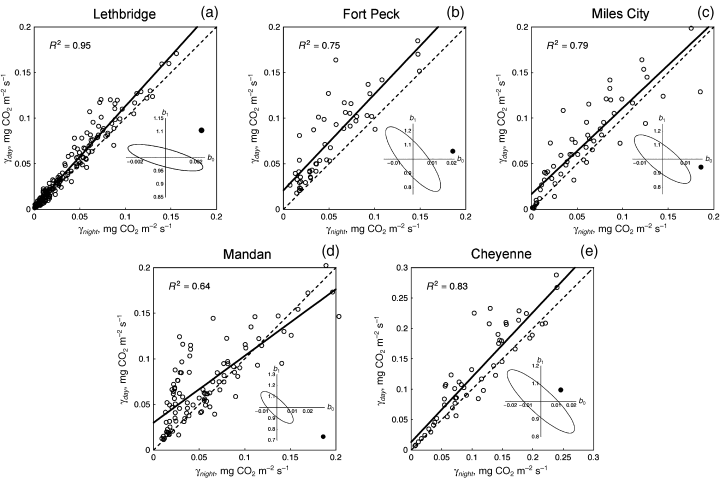
Weekly average daytime respiration, γday, at various study sites estimated from light-function analysis plotted against weekly average night-time respiration γnight directly obtained from measurements. Characteristics of regressions, γday = b0 + b1γnight, are presented in Table 2. Ellipses in the lower-right parts of the graphs describe the 99% critical zones in the parameter space {b0, b1} for the hypothesis that the deviation of the regression line (solid line) from the 1 : 1 diagonal (dashed line) is due to random errors only; the solid dot represents observed parameter pairs (b0, b1).
| Site, ecosystem (n = number of data points) | Adjusted R2 | Coefficient | Estimate (standard error) | Student's t-statistic | P-value |
|---|---|---|---|---|---|
| Lethbridge, northern mixed/shortgrass prairie (n = 186) | 0.95 | b 0 | 0.0024 (0.0009) | 2.508 | 0.01301 |
| b 1 | 1.1045 (0.0194) | 56.893 | 0.00000 | ||
| Fort Peck, northern mixed prairie (n = 52) | 0.75 | b 0 | 0.0207 (0.0054) | 3.862 | 0.00032 |
| b 1 | 1.0555 (0.0856) | 12.335 | 0.00000 | ||
| Miles City, northern mixed prairie (n = 58) | 0.79 | b 0 | 0.0167 (0.0046) | 3.618 | 0.00064 |
| b 1 | 0.9430 (0.0651) | 14.477 | 0.00000 | ||
| Mandan, mixed prairie (n = 99) | 0.64 | b 0 | 0.0301 (0.0040) | 7.477 | 0.00000 |
| b 1 | 0.7316 (0.0554) | 13.210 | 0.00000 | ||
| Cheyenne, mixed prairie (n = 52) | 0.83 | b 0 | 0.0130 (0.0082) | 1.5813 | 0.12013 |
| b 1 | 1.0649 (0.0668) | 15.941 | 0.00000 |
Our observation that γday > γnight is in agreement with the results by Grahammer et al. (1991) who, using chamber measurements in tallgrass prairie in Kansas, estimated average rates of daytime and night-time soil respiration during summer as γsoil,day = 0.12 g CO2 m−2 s−1 and γsoil,night = 0.10 g CO2 m−2 s−1. We propose that γday > γnight respiration even though some experimental data suggest that respiration of green leaves may be inhibited by light (Villar et al., 1994, 1995). Gifford's (2003) review demonstrated that leaf mitochondrial respiration was unaffected by light (Loreto et al., 1999, 2001a, 2001b). It is presently well established that respiration of below-ground plant parts, soil micro-organisms, and fauna increases with soil temperature, as described by the exponential term in eqn. (10) (e.g. Krogh, 1914; Rabinowich, 1956; Howard, 1971; Lloyd & Taylor, 1994; Kirschbaum, 1995; Tjoelker et al., 2001; Burton et al., 2002). In addition, a number of studies using radiocarbon pulse labelling have demonstrated rapid connection of production of photosynthates and root respiration and exudation (Megonigal et al., 1999; Kuzyakov, 2002; Lu et al., 2002). For example, Kuzyakov & Domanski (2002) have found the isotopic label in soil micro-organisms and exudates within the first hours after pulse labelling of ryegrass, with maxima of microbial and exudates 14C observed approximately 4 h after isotopic labelling. Our working hypothesis is that increased levels of below-ground plant and heterotrophic soil (especially, rhyzosphere) respiration during daytime, associated with increasing soil temperature and the production and translocation of photosynthates is greater than the inhibition of leaf respiration by light (if the latter is taking place at all), resulting in a higher rate of ecosystem respiration during the day than at night.
Seasonal/annual CO2 budgets
Seasonal curves of Pg, Pd, and F for the five sites for selected years are shown in Fig. 7. Table 3 summarizes the estimates of seasonal (annual) flux integrals for all available sites and years. These estimates are in reasonable agreement with numbers for gross primary production and ecosystem respiration of non-forest ecosystems available in the literature (cf. Gilmanov et al., 2003a,b; Suyker et al., 2003; Xu & Baldocchi, 2004). Similar to southern prairies (Suyker et al., 2003) and Mediterranean grasslands (Xu & Baldocchi, 2004), the Northern Great Plains grasslands exhibit substantial variability of CO2 exchange, and may switch from being significant carbon sinks during years with favourable precipitation to significant sources of carbon in water stress years (Table 3).
| Site | Year | Period days | P g g CO2 m−2 | R e g CO2 m−2 | NEE g CO2 m−2 | PCPN mm | PAR mol m−2 |
|---|---|---|---|---|---|---|---|
| Lethbridge | 1998 | 161–365 | 1565 | 1090 | 475 | 471 | (5590) |
| 1999 | 1–365 | 1163 | 1092 | 71 | 251 | 9910 | |
| 2000 | 1–366 | 1049 | 1121 | −72 | 201 | 10372 | |
| 2001 | 1–365 | 1123 | 1064 | 59 | 153 | 10571 | |
| Fort Peck | 2000 | 91–305 | 1455 | 1293 | 162 | 320 | 10614 |
| 2002 | 138–302 | 459 | 996 | −537 | 260 | 10732 | |
| Miles City | 2000 | 118–307 | 913 | 1130 | −217 | (174) | (9505) |
| 2001 | 1–327 | 1239 | 1437 | −198 | (381) | (10340) | |
| Mandan | 1999 | 84–328 | 2340 | 1762 | 578 | (470) | (9008) |
| 2000 | 90–299 | 1494 | 1291 | 203 | (346) | (7938) | |
| 2001 | 1–365 | 1730 | 1610 | 120 | 468 | 10060 | |
| Cheyenne | 1997 | 116–268 | 2491 | 1881 | 610 | (377) | (7628) |
| 1998 | 114–323 | 2096 | 1796 | 300 | 367 | (8307) |
Radiation use efficiencies
As an integral characteristic of the plant production process, the daily coefficient of ecological radiation use efficiency, ɛ = Pg/Q, demonstrates significant seasonal and year-to-year variability. (Fig. 8). The moving weekly average of ɛ has more regular dynamics (solid line of Fig. 8), but, contrary to the anticipated unimodal pattern (Lethbridge 1998; Cheyenne 1998), in certain years it displays several distinct maxima (e.g. Lethbridge 2000; Fort Peck 2000; Miles City 2000–01; Mandan 1999–2001; Cheyenne 1998). The range of maximum daily light-use efficiencies in our study (0.014 to 0.032 mol CO2 mol quanta−1) is close to the same range from literature data (0.015 to 0.041 mol CO2 mol quanta−1) (Table 4). The same is true for the range of maximum weekly light use efficiencies: our interval between 0.008 and 0.019 mol CO2 mol quanta−1 practically lies within the interval 0.009 to 0.028 mol CO2 mol quanta−1 of published data, which also include more productive grasslands. Our intervals for the average seasonal radiation use efficiency ɛseas = Pg,seas/Qseas (0.0033 to 0.0057 mol CO2 mol quanta−1) and the average annual radiation use efficiency ɛyear = Pyear/Qyear (0.0025 to 0.0053) are less than the available literature data (0.0057 to 0.0173 and 0.0038 to 0.0091 mol CO2 mol quanta−1, respectively), which is also in agreement with the position of the Northern Great Plains grasslands in the productivity gradient of the literature data (Table 4).
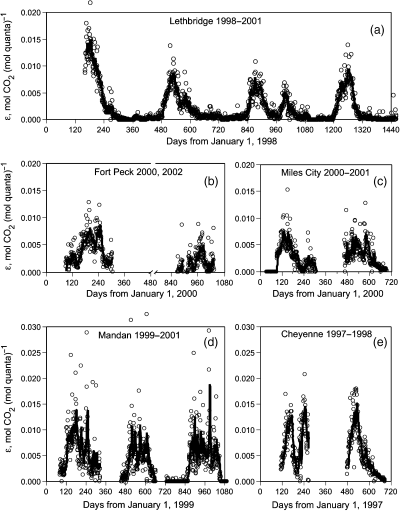
Ecological radiation use efficiency  at the five Northern Great Plains sites: (a) Lethbridge (1998–2001); (b) Fort Peck (2000) (2002); (c) Miles City (2000–01); (d) Mandan (1999–2001); (e) Cheyenne 1997–98. Circles — data for original days; solid line — seven day moving average.
| Site, ecosystem (years) | ɛmax,day | ɛmax,week | ɛgrseas | ɛyear | Data source |
|---|---|---|---|---|---|
| Lethbridge, Alberta, mixed/shortgrass prairie (1998–2001) | 0.022 | 0.011 | 0.0025 | This study | |
| Matador, Sascatchewan, northern mixed prairie | 0.0108 | Coupland & Van Dyne (1979) | |||
| Fort Peck, Montana, northern mixed prairie (2000) | 0.014 | 0.009 | 0.0041 | 0.0031 | This study |
| Miles City, Montana, northern mixed prairie (2001) | 0.015 | 0.008 | 0.0033 | 0.0026 | This study |
| Shortandy, Kazakhstan, true steppe (1998–2001) | 0.024 | 0.014 | Gilmanov et al. (2004 ) | ||
| Pawnee, Colorado, shortgrass steppe | 0.015 | 0.009 | 0.0057 | 0.038 | Brown & Trlica (1977a; 1977b) |
| Mandan, North Dakota, mixed prairie (2001) | 0.032 | 0.019 | 0.0055 | 0.0039 | This study |
| Cheyenne, Wyoming, mixed prairie (1998) | 0.022 | 0.015 | 0.0057 | This study | |
| Woodward, Oklahoma, mixed prairie | 0.019 | 0.014 | 0.0072 | 0.0053 | Gilmanov et al. (2003b ) |
| Little Washita, Oklahoma, pasture in tall/mixed prairie (1997) | 0.024 | 0.017 | 0.0059 | 0.0044 | Gilmanov et al. (2003b ) |
| Osage, Oklahoma, tallgrass prairie | 0.0077 | 0.0051 | Risser et al. (1981) | ||
| Konza, Kansas, tallgrass prairie | 0.0235 | Turner et al. (2003a ) | |||
| Shidler, Oklahoma, tallgrass prairie (1997) | 0.031 | 0.026 | 0.0141 | 0.0091 | Gilmanov et al. (2003b ) |
| South-west Amazonia, Brazil, tropical pasture | 0.0173 | Grace et al. (1998) | |||
| AGRO, Illinois, corn field | 0.039 | Turner et al. (2003a ) | |||
| Ponca City, Oklahoma, winter wheat (1997) | 0.041 | 0.028 | 0.0121 | Gilmanov et al. (2003b ) | |
Flux–NDVI relationships
Statistical analysis of the relationships among the 10-day averages Pg, Pd, and Re as dependent variables, and the 10-day Normalized Difference Vegetation Index (NDVI) composites and other factors reveals complex interrelationships. First, the correlation between the average 10-day gross primary productivity (Pg) and the 10-day composite NDVI is significantly higher than the correlation between the average 10-day daytime CO2 flux totals (Pd) and the 10-day composite NDVI. As illustrated in the second and third columns of Table 5, correlation coefficients r(Pg, NDVI) vary from 0.68 to 0.88, while coefficients r(Pd, NDVI) lie in the range 0.21 to 0.73. In all cases r(Pg, NDVI) > r(Pd, NDVI). To test the significance of this inequality, we used the test for comparison of correlation coefficients suggested by Steiger (1980), which is also applicable for correlated variables (note high correlations r(Pg, Pd) between corresponding Pg and Pd values in column 4, Table 5). Results presented in Table 5 show that for all sites the observed t-value, tobs, is considerably higher than the 5% value of the Student's criterion with (n− 3) degrees of freedom tcrit(0.95; n− 3). In fact, P-values for all sites (last column) are less than 0.1%, indicating significance of the observation that Pg is more highly correlated with NDVI than Pd.
| Site, ecosystem (n = number of data points) | r(Pg, NDVI) | r(Pd, NDVI) | r(Pg, Pd) | t crit (0.95; n – 3) | t obs | P-value(tobs, n – 3) |
|---|---|---|---|---|---|---|
| Lethbridge, northern mixed shortgrass prairie (n = 129) | 0.8061 | 0.6703 | 0.9487 | 1.657 | 9.305 | 2.22 10−16 |
| Fort Peck, northern mixed prairie (n = 34) | 0.6786 | 0.2143 | 0.8020 | 1.696 | 8.448 | 7.63 10−10 |
| Miles City, northern mixed prairie (n = 43) | 0.8768 | 0.4441 | 0.7159 | 1.684 | 8.756 | 3.85 10−11 |
| Mandan, mixed prairie (n = 68) | 0.8528 | 0.7291 | 0.9334 | 1.669 | 5.593 | 2.39 10−7 |
| Cheyenne, mixed prairie (n = 36) | 0.7890 | 0.6702 | 0.9512 | 1.692 | 3.920 | 0.00021 |
The important practical implication for scaling-up algorithms is that gross primary productivity, Pg, derived from daytime flux measurements using light-response analysis is a more appropriate variable than total net daytime flux, Pd. These findings are in agreement with observations of higher Pg–NDVI correlations compared with Pd–NDVI correlations in a true steppe ecosystem in northern Kazakhstan (Gilmanov et al., 2004; Wylie et al., 2004).
Ten-day average total ecosystem respiration (Re) was also closely correlated with NDVI composites, with r-values varying from 0.75 to 0.88 (Table 6). This is not surprising, because a substantial part of total ecosystem respiration is represented by plant biomass respiration which is directly related to green above-ground biomass and, consequently, to NDVI (cf. Gifford, 2003). However, Re is also related to such environmental factors as precipitation, soil temperature, and soil water content. We have used available data sets to identify phenomenological models linking Re to NDVI and other environmental drivers.
| Site, ecosystem (n = number of data points) | Correlation coefficient r | P-value | Intercept b0 | Slope b1 |
|---|---|---|---|---|
| Lethbridge, northern mixed shortgrass prairie (n = 128) | 0.876 | < 0.001 | −1.554 | 20.142 |
| Fort Peck, northern mixed prairie (n = 34) | 0.880 | < 0.001 | −2.374 | 24.218 |
| Miles City, northern mixed prairie (n = 41) | 0.765 | < 0.001 | −7.990 | 52.345 |
| Mandan, mixed prairie (n = 79) | 0.752 | < 0.001 | 0.556 | 11.595 |
| Cheyenne, mixed prairie (n = 36) | 0.795 | < 0.001 | −5.830 | 38.522 |
In spite of significant correlation, there is a scatter in both the Pg–NDVI and the Re–NDVI relationships. Part of this scatter is probably due to totally random effects. On the other hand, there are, obviously, other factors, e.g. photosynthetically active radiation, precipitation, soil water content, and soil temperature, that affect production and respiration of the grassland ecosystem, in addition to NDVI. For instance, at the Mandan site, a linear function of NDVI explains 53% of the variability in 10-day gross primary productivity and has a standard error SE = 3.15 g CO2 m−2 d−1. Including photosynthetically active radiation, Q, provides improvement of the model. Figure 9 shows the response surface of the gross photosynthesis of the mixed prairie at Mandan to photosynthetic radiation, Q, and NDVI, described by the model:
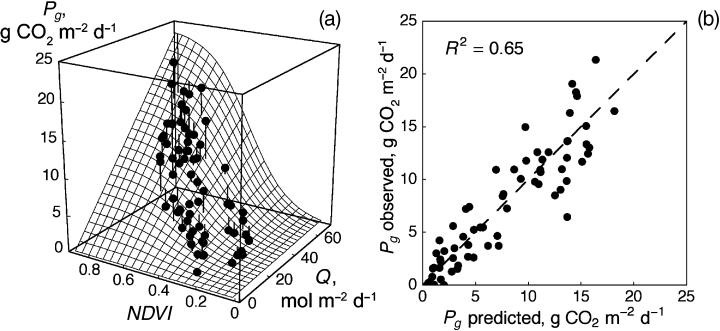
(a) Response function Pg(Q, NDVI) describing relationship of the 10-day average gross primary productivity of the mixed prairie at Mandan (1999–2001 data) to 10-day average daily photon flux totals (Q, mol quanta m−2 d−1) and 10-day NDVI composites (NDVI) described by equation 15 with parameters presented in Table 7, and (b) the scatter plot of the observed vs. predicted Pg values. The dashed line shows the 1 : 1 diagonal.
 (15)
(15)where eP denotes the residual error term. With estimated parameters ϕ = 0.342 g CO2 (mol quanta)−1, λ = 3.954, and µ = 8.759, the model, obtained using nonlinear regression fitted to a 10-day aggregated Mandan (1999–2001) data set, is characterized by the corrected R-squared value  = 0.65 and the standard error SE = 2.67 g CO2 m−2 d−1. In addition to visual evaluation of the model fit by comparing the data points with the surface on Fig. 9a, direct comparison is provided in Fig. 9b by the scatter plot of the observed and predicted values with the 1 : 1 diagonal.
Further improvement of the description of gross primary productivity is achieved by modification of the model (15) to include bell-shaped dependence on soil water content Ws, resulting in the model:
 (16)
(16)With parameters ϕ = 0.3844 g CO2 (mol quanta)−1, λ = 3.886 (dimensionless), and µ = 8.169 (NDVI units)−1, ξ = 4.588 (dimensionless), and θ = 0.407 m3 m−3, the model is characterized by  = 0.68 and SE = 2.61 g CO2 m−2 d−1. A scatter diagram of the observed vs. predicted Pg values for model (16) is presented in Fig. 10. Compared to model (15), this model has somewhat higher
  and lower SE, though for practical applications the simpler model (15) explains a sufficient part of the Pg variability to be acceptable.
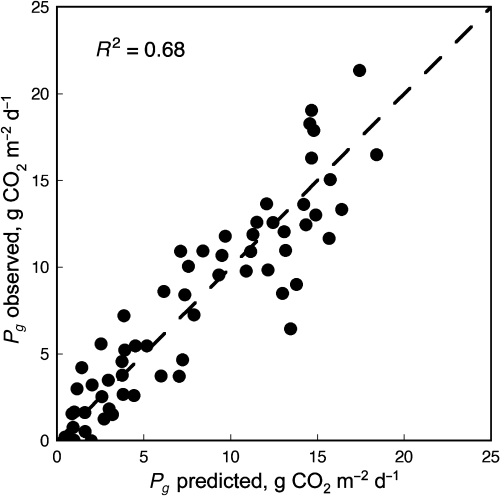
Scatter plot of observed Pg values for the Mandan site against estimates predicted by model (15) relating Pg to photosynthetically active radiation, Q, NDVI, and topsoil moisture, Ws. The dashed line shows the 1 : 1 diagonal.
Because the empirical models (15) and (16) combine information on the phenomenology of relationships of grassland Pg with photosynthetically active radiation, NDVI, and soil water (where available), we estimated their parameters for all Northern Great Prairie sites (Table 7). For all three sites for which soil water data were available (Lethbridge, Mandan, and Cheyenne), model (16) provided the best fit, with  values above 60%. For the Fort Peck northern mixed prairie and the Miles City mixed prairie, where Ws data were not available, model (15) performed well, with combined effect of radiation and NDVI explaining 60% and 64% of the variation of 10-day average gross primary productivity, respectively. It should be noted that the top-soil water variable, Ws, used in this analysis, does not provide complete characterization of the water availability and its effect on ecosystem productivity. Apparently, data on water content in the whole rooting zone, Wr, when available, might further improve the predictive power of phenomenological models Pg = f(Q, NDVI, Wr, … ).
| Site, ecosystem (n = number of data points) | ϕ | λ | µ | ξ | θ | R 2 |  |
SE |
|---|---|---|---|---|---|---|---|---|
| Lethbridge, northern mixed shortgrass prairie (n = 77) | 0.577 | 6.78 | 29.08 | 38.89 | 0.364 | 0.92 | 0.85 | 1.79 |
| Fort Peck, northern mixed prairie* (n = 31) | 0.383 | 2.85 | 6.81 | 0 | 0 | 0.78 | 0.60 | 2.19 |
| Miles City, northern mixed prairie (n = 44) | 0.202 | 8.59 | 37.42 | 0 | 0 | 0.80 | 0.64 | 1.65 |
| Mandan, mixed prairie (n = 64) | 0.384 | 3.89 | 8.01 | 4.60 | 0.406 | 0.82 | 0.68 | 2.61 |
| Cheyenne, mixed prairie (n = 36) | 0.543 | 5.15 | 15.05 | 32.21 | 0.200 | 0.73 | 0.67 | 4.13 |
From previous studies of the phenomenology of ecosystem respiration, it is known that Re is directly related to the amount of the autotrophic and heterotrophic biomass and, consequently, leaf area index (LAI) and NDVI (Monsi & Saeki, 1953; McCree, 1970; Bunce, 1989; Norman et al., 1992; Polley et al., 1992; Hanan et al., 1997; Amthor & Baldocchi, 2001; Gifford, 2003). On the other hand, the metabolic activity of plant, microbial, and animal biomass is controlled by environmental drivers such as temperature, moisture, etc. While detailed characterization of the interaction of these extensive and intensive factors in determining dynamics of ecosystem respiration may apparently be implemented only in rather comprehensive simulation models, analysis of our data revealed statistically significant phenomenological relationships between Re and other factors at the 10-day time scale. As we have seen in Table 6, linear functions of NDVI alone explain more than 50% of the variability of ecosystem respiration of northern Great Plains rangelands at the 10-day scale. Multivariate linear regression analysis has indicated that atmospheric precipitation, PCPN, and radiation, Q, complement NDVI most effectively, so that linear functions of these variables explain 63 to 87% of the dispersion of 10-day Re values with SE values from 1.17 to 3.60 g CO2 m−2 d−1.
To investigate the effect of nonlinearity of the relationship between biomass and NDVI, and consequently, between Re and NDVI (cf. Turner et al., 1999; Wylie et al., 2002), we used a nonlinear (with respect to NDVI) model:
 (17)
(17)where λ, µ, υ, ρ, and ψ are empirical parameters, ρ = Re(0, 0, 0)(1 + eλ). Parameters of this model, estimated for all the sites, are listed in Table 8. As an illustration, Fig. 11 shows the response surface Re(NDVI, PCPN) and the scatter diagram of observed vs. predicted Re values for the Fort Peck site. For all sites except Lethbridge, the model (17) provided better fit for ecosystem respiration data, demonstrating R2 values from 0.70 to 0.89 and SE values from 1.22 to 3.36 g CO2 m−2 d−1.
| Site, ecosystem (n = number of data points) | ρ | λ | µ | ν | ψ | R 2 |  |
SE |
|---|---|---|---|---|---|---|---|---|
| Lethbridge, northern mixed shortgrass prairie* (n = 125) | 4.757 | 6.534 | 23.84 | 0.068 | 0.051 | 0.83 | 0.68 | 1.47 |
| Fort Peck, northern mixed prairie (n = 34) | 61.84 | 4.069 | 4.457 | 0.057 | 0 | 0.89 | 0.79 | 1.22 |
| Miles City, northern mixed prairie (n = 36) | 10.11 | 5.696 | 21.39 | 0.075 | 0 | 0.74 | 0.55 | 1.97 |
| Mandan, mixed prairie (n = 60) | 1049.5 | 6.982 | 3.198 | 0.017 | 0 | 0.72 | 0.51 | 1.89 |
| Cheyenne, mixed prairie (n = 36) | 13.85 | 7.01 | 21.51 | 0.022 | 0 | 0.70 | 0.49 | 3.36 |
- * At the Lethbridge site, linear regression Re = −2.16 + 12.12NDVI + 0.058PCPN + 0.77Q is characterized by R2 = 0.86, SE = 1.17 g CO2 m−2 d−1, F3,121 = 246.37 and P < 0.00001.
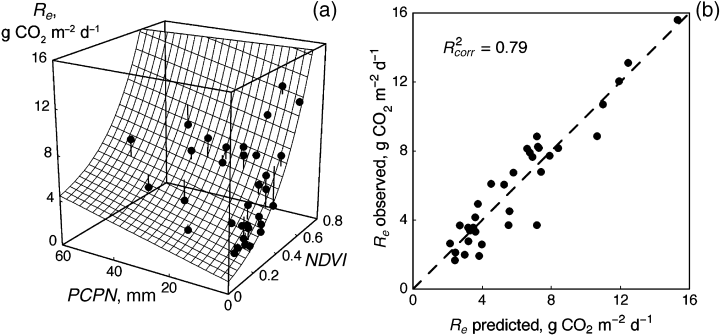
(a) Response function Re(NDVI, PCPN) describing relationship of the 10-day average total ecosystem respiration of the northern mixed prairie at Fort Peck (2000, 2002 data) to 10-day NDVI composite (NDVI values) and 10-day precipitation totals (PCPN, mm) described by equation 17 with parameters presented in Table 8, and (b) the scatter plot of the observed vs. predicted Re values. The dashed line shows the 1 : 1 diagonal.
Previous studies of the phenomenology of ecosystem respiration have demonstrated bell-shaped dependences on temperature (which below 25 °C is reasonably approximated by the exponential or Q10-type function) combined with saturated or bell-shaped relationships to soil water (Flanagan & Bunnell, 1976; Singh & Gupta, 1977; Davidson et al., 1998; Davidson et al., 2000; Mielnick & Dugas, 2000; Frank et al., 2002). We have found that the simple model combining exponential response to soil temperature, Ts, with bell-shaped response to soil water, Ws:
 (18)
(18)provides a satisfactory description of the Re(Ts,Ws) relationships for all the sites when both Ts and Ws data available. Compared to the linear and logistic models, model (17) provides poorer fit to data (R2 from 0.19 to 0.77 and SE from 1.58 to 4.56 g CO2 m−2 d−1). Nevertheless, it allows us to estimate the exponential temperature coefficient, κ, which provides quantitative characterization of the partial response of ecosystem respiration to temperature. The average of κ-value for all five sites, 0.063 (°C)−1 (range 0.037 to
0.082 (°C)−1), is close to the value  = 0.069 (°C)−1 correspond
ing to the standard physiological value of Q10 = 2. It should be noted here that higher Q10 values often reported in the literature, as a rule do not reflect the partial temperature response in the strict sense because of difficulties maintaining unchanged levels of other factors.
Overall, NDVI-based models provided considerably better fit to the respiration data than the temperature-based model (18). The fact that NDVI-based models did not include temperature as a significant additional predictor, and the temperature-based models in most cases did not include NDVI, may be explained by high positive correlation r(Ts, NDVI) between soil temperature and NDVI in the 10-day data (Table 9). Only at the Miles City and Cheyenne sites characterized by lower r(Ts, NDVI) values (0.50 and 0.65, respectively), did the inclusion of NDVI as an additional predictor increase the fit.
| Site | Lethbridge | Fort Peck | Miles City | Mandan | Cheyenne |
|---|---|---|---|---|---|
| r(Ts, NDVI) | 0.73 | 0.92 | 0.50 | 0.93 | 0.65 |
Recently, Körner (2003a, 2003b) expressed serious concerns regarding approaches to scaling-up of the results of the eddy covariance tower flux measurements in forests. One of his points — the need to generalize plot-based fluxes only to the areas with similar dynamic parameters of carbon cycling — is also applicable to non-forest ecosystems, including grasslands. Because NDVI characterizes structural and functional ecosystem properties, we think that the application of NDVI-based models (13)–(14) derived from tower sites has the potential for robust extrapolation. GIS layers of NDVI and other relevant predictors {Xi}, {Yj} for the pixels with similar temporal patterns and magnitudes of NDVI as the flux towers and within ecologically similar ecoregions (Fig. 1) can spatially constrain the empirically based method of upscaling tower CO2 fluxes. This approach may be considered as complementary to the dynamic simulation approach including running a SVAT or biogeochemical simulation models driven by meteorological, topographic, and remotely sensed data in every pixel (or subsets of pixels) of the map (e.g. Nouvellon et al., 2001; Liu et al., 2002).
An important distinction of our model relative to the constructions based on the radiation-use efficiency approach sensu Monteith (e.g. Running et al., 1999; Veroustraete et al., 2002) is that our functions Pg( … ) and Re( … ) are directly derived from on-site and satellite measurements and do not include a priori assumptions about the values and seasonal patterns of radiation-use efficiency coefficients. According to Nouvellon et al. (2000) these assumptions may lead to large estimation errors.
The most straightforward application of the multivariate functions Pg( … ) and Re( … ) is for scaling-up of CO2 fluxes at ecologically similar locations within the ecoregion and the year of measurements. Portability of these phenomenological models across the years requires additional testing with larger data sets. However, the results for the Lethbridge data set, that includes 4 years of observations with R2 values sufficiently high for both photosynthesis and respiration (Tables 7 and 8), provide encouragement and stimulate additional research.
CONCLUSIONS
Partitioning of the net CO2 fluxes from the BREB and eddy covariance towers on the Northern Great Plains resulted in daytime respiration estimates closely correlated with and consistently higher than measured night-time respiration rates. Estimates of gross primary production of Northern Great Plains ecosystems based on these daytime respiration values are in agreement with existing GPP estimates for other ecosystems in the climatic gradient from shortgrass to tallgrass prairies. Significant positive correlations of daytime flux totals (Pd), daily gross primary productivity (Pg), and ecosystem respiration (Re) with NDVI were established, correlation coefficients r(Pg, NDVI) being significantly higher than r(Pd, NDVI). Our analysis demonstrated that the phenomenological models Pg = fP(NDVI, X1, X2, … , Xn) and Re = fR(NDVI, Y1, Y2, … , Ym) can be used to describe relationships of gross primary productivity and ecosystem respiration to NDVI and other environmental predictors. Sites with more representative data sets (longer periods of observation and a wide range of factors — Lethbridge, Mandan) produce models with higher R2 and lower standard errors. Parameterization of these models with data sets from Northern Great Plains flux sites that will become available in the future, and their application to areas with similar ecological conditions, may provide opportunities to scale-up local tower CO2 flux measurements to larger geographical units using GIS data on the spatial distribution of vegetation indices and other environmental factors. Taking into account the paramount importance of gross primary productivity (Pg) as a functional ecosystem-scale characteristic, we strongly recommend partitioning of the flux tower data sets of net CO2 fluxes using light-response function analysis to provide measurement-based data sets of Pg and Re values required for both greater mechanistic understanding and for modelling of the carbon cycle.
ACKNOWLEDGEMENTS
This study was made possible in part by the Science Applications International Corporation (SAIC) under the US Geological Survey (USGS) contract 03CRCN0001, Global Livestock Collaborative Research Support Program (GL/CRSP) funded by USAID (PCE-G-00-98-00036-00), and the Collaborative CO2 Flux Scaling Project funded through GL/CRSP, USDA's Agricultural Research Service (USDA-ARS) Headquarters and National Program Staff, USDA-ARS Agriflux participants, and USGS Earth Surface Dynamics program. The authors thank Bradley Reed (EROS Data Center) for assistance with NDVI data, David Turner (Oregon State University, Corvallis) for additional information on light use efficiency in tallgrass prairie and corn field sites, Norman Bliss (EROS Data Center) for judicious and insightful editing, and Ruth Anne Doyle (EROS Data Center) for help with GIS and mapping.
REFERENCES
| BIOSKETCHES |
|---|
| Tagir G. Gilmanov is a faculty member at the Department of Biology and Microbiology, South Dakota State University. His research focuses on post-processing CO2 flux tower measurements including partitioning of the net CO2 exchange into gross primary productivity and ecosystem respiration, modelling their relationships to on-site and remotely sensed factors, and scaling-up CO2 fluxes from towers to landscapes and ecoregions. In his studies, he integrates methods of instrumental field measurements, phenomenological and mechanistic mathematical modelling, GIS and remote sensing. |
| Larry L. Tieszen is Deputy Manager of the International Program at the USGS/EROS Data Center where he develops research and development activities in support of global and international activities. His research as an academic emphasized photosynthesis in C3 and C4 grasses, grassland ecology, and biogeochemistry. He developed applications that used natural abundances of 13C to quantitatively trace carbon through ecosystems and diets. These techniques made substantial contributions to ecology, archaeology, and related fields. He now integrates remote sensing approaches with carbon biogeochemistry in climate mitigation research. |
| Bruce K. Wylie is a SAIC research scientist at the USGS EROS Data Center. His scientific research has focused on remotely sensed rangeland biophysical parameters and the scaling up of flux tower observations to the regional level. His research has focused on the African Sahel, Central Asia, and North America. |
| Lawrence B. Flanagan is a professor in the Department of Biological Sciences, University of Lethbridge, Canada. He studies interactions between ecosystems and the atmosphere and how these interactions are affected by environmental change. |
| Albert B. Frank is scientist with the USDA, Agricultural Research Service, Mandan, ND. His research focuses on relationships between management practices, plant processes, and site productivity on carbon dynamics in grasslands. |
| Marshall R. Haferkamp is a rangeland scientist with USDA-ARS, Fort Keogh Livestock and Range Research Laboratory, Miles City, MT. The emphasis of his research is on soil-plant-environment-herbivore interactions on native rangelands and seeded pastures. He focuses on measuring livestock production utilizing seeded forages in combination with native rangeland and determining the role of Northern Great Plains rangelands in regulating atmospheric CO2. |
| Tilden P. Meyers is research meteorologist at the Atmospheric Turbulence and Diffusion Division of NOAA's Air Resources Laboratory in Oak Ridge, Tennessee. His research is focused on using measurements of land surface processes including the air-surface exchange of water, carbon dioxide and other trace gases to improve the representation of these processes in both regional and global scale models. |
| Jack A. Morgan is the Research Leader of the Rangeland Resources Research Unit in the USDA Agricultural Research Service, stationed in Fort Collins, CO. He studies the ecological responses of primarily native grasslands to global climate change and to domestic livestock grazing, with an emphasis on soil/plant water relations, fluxes of CO2 and water vapour, and C and N cycling. |


