A three-dimensional tissue culture model for the study of attach and efface lesion formation by enteropathogenic and enterohaemorrhagic Escherichia coli
Summary
We sought to develop a practical and representative model to study the interactions of enteropathogenic and enterohaemorrhagic Escherichia coli (EPEC and EHEC, respectively) with human intestinal tissue. For this purpose, human intestinal epithelial HCT-8 cells were cultured under low-shear microgravity conditions in a rotating cell culture system. After 10 days, layered cell aggregates, or ‘organoids’, developed. Three lines of evidence indicated that these organoids exhibited traits characteristic of normal tissue. First, the organoids expressed normal intestinal tissue markers in patterns that suggested greater cellular differentiation in the organoids than conventionally grown monolayers. Second, the organoids produced higher levels of intestinally expressed disaccharidases and alkaline phosphatase on a cell basis than did conventionally cultured monolayers. Third, HCT-8 organoid tissue developed microvilli and desmosomes characteristic of normal tissue, as revealed by electron microscopy. Because the low-shear microgravity condition is proposed by modelling studies to more closely approximate conditions in the intestinal microvilli, we also tested the impact of microgravity of bacterial growth and virulence gene expression. No influence on growth rates was observed but intimin expression by EHEC was elevated during culture in microgravity as compared with normal gravity. That the responses of HCT-8 organoids to infection with wild-type EPEC or EHEC under microgravitational conditions approximated infection of normal tissue was demonstrated by the classical appearance of the resultant attaching and effacing lesions. We concluded that the low shear microgravity environment promoted growth of intestinal cell organoids with greater differentiation than was seen in HCT-8 cells maintained in conventional tissue culture and provided a reduced gravity environment for study of bacterial–host cell interactions.
Introduction
For many human-specific pathogens no representative small animal model is available. Human tissue explants grown in in vitro organ cultures (IVOC) provide a complex multicellular environment for the study of host–pathogen interactions. Unfortunately, these culture systems are available only to facilities equipped to collect and rapidly convey biopsy materials to the research laboratory. In addition, IVOC studies are limited to bacterial–host interactions that occur during the short lifespan of the organ biopsy material. Conversely, human cell lines have an indefinite lifespan and have been used extensively for the study of host–pathogen interactions. However, these lines may exhibit aberrant properties attributable to immortalization and artificial, two-dimensional growth conditions (Freshney, 2000).
Studies conducted during space flight by the United States National Aeronautics and Space Agency showed that cell lines grown in suspension culture in low shear microgravity tend to aggregate and exhibit morphologies more typical of native tissues (Unsworth and Lelkes, 1998; Hammond and Hammond, 2001). The low shear microgravity environment is also thought to be representative of in vivo conditions in sites such as the uterus or within the brush border microvilli, as predicted by mathematical modelling (Guo et al., 2000; Stock and Vacanti, 2001). To simulate low shear microgravity conditions in the laboratory, rotating wall vessels (RWVs) were developed (R. P. Schwarz and D. A. Wolf, Patent no. 5.026.650, 1991) (Hammond and Hammond, 2001). These sterile cylindrical chambers are rotated on a specialized motorized stand within an incubator at a velocity that allows the cells to float freely in suspension culture. Turbulence and sheer forces are minimized by completely filling the chamber with growth medium through an injection portal that also allows the removal of air bubbles. Gas exchange is provided through a gas-permeable silicon rubber membrane. Extracellular matrix material such as collagen beads or sheets can also be added to the bioreactor to support cell aggregation. The liquid medium in the RWV can be refreshed without disturbing the tissue aggregates or ‘organoids’, such that growth can be supported for several weeks.
Since their development, RWVs, or other commercially available rotating cell culture systems (RCCS) (Synthecon, Houston, TX), have been used to culture many eukaryotic cell types including continuous and primary cell lines, tissue explants and co-cultures of different cell types to form complex tissue assemblies (Unsworth and Lelkes, 1998; Nickerson and Ott, 2004). Bacterial growth is also influenced by growth in microgravity (Nickerson et al., 2003; 2004). Microarray analysis shows that Salmonella enterica serovar Typhimurium grown in microgravity express different subsets of genes than those grown in a normal gravitational field (Wilson et al., 2002a,b).
To date, human intestinal Int-407 cells and A549 lung epithelial cells grown in microgravity and have been used as tissue models of infection with S. enterica serovar Typhimurium and Pseudomonas aeruginosa infections respectively. (Nickerson et al., 2001; Carterson et al., 2005). In those studies, the tissue was propagated in microgravity, but the bacterial challenge was conducted in normal gravity. In this study, we sought to establish a three-dimensional intestinal cell model to evaluate the interactions of prototypic strains of the Enterohaemorraghic Escherichia coli (EHEC) and Enteropathogenic Escherichia coli (EPEC) with the apical borders of such cells under conditions of microgravity. Both of these pathogens produce the outer membrane protein intimin that mediates the tight adherence of the organisms to the intestinal epithelium (Jerse et al., 1990; Donnenberg et al., 1993). As a consequence of the interaction between intimin and its bacterial receptor Tir (for Translocated intimin receptor), a chain of events is initiated that involves additional products of the Locus of Attachment and Effacement (LEE). These tissue changes include loss of brush border microvilli, cytoskelatal rearrangements and pedestal formation at the site of bacterial attachment (Moon et al., 1983).
To establish our organoid model of intestinal cells, we selected the human HCT-8 cell line that was derived from enterocytes at the junction of the large and small bowel (Tompkins et al., 1974). Our reasons for this choice were twofold. First, we had previously shown intimin-based adherence of the large bowel pathogen EHEC O157:H7 to this cell line (McKee and O’Brien, 1995), in contrast to the colonic line T84 (Mills and O’Brien, 2000). Second, we speculated that because of the origin of the HCT-8 cells they would also provide a suitable environment for the small bowel pathogen EPEC. Here we report the cultivation in microgravity bioreactors of HCT-8 human ileo-cecal cells and the characterization of the resultant organoids as compared with cells in monolayer and normal human tissue. We also describe the impact of microgravity on growth and virulence gene expression of EPEC and EHEC as well as the interactions of EPEC and EHEC strains with the organoids.
Results
Characteristics of cell aggregates grown in microgravity
HCT-8 cells were cultured under microgravity in RCCS vessels with small pieces of acellular collagen-rich porcine small intestinal submucosa (SIS) to serve as a bioscaffold. Tissue aggregates harvested after 10 days were roughly spherical and measured 5–6 mm in diameter. Each organoid was comprised of approximately 1.5 × 10⁵ viable cells, as enumerated microscopically in the presence of trypan blue dye following trypsinization. Tissue cross-sections revealed multiple layers of cells attached to the scaffold (Fig. 1A and B). At 100× magnification (Fig. 1C), six to eight compact layers of cells were evident. The cells of the outermost layer were uniform in size and columnar while the underlying cells were more cuboidal (Fig. 1C).

Histology of a 10-day-old HCT-8 organoid. A. With haematoxylin and eosin stain, tissue stains purple and scaffold is pink (10×). B. With Mason's trichrome stain, tissue is deep red and scaffold is blue (40×). C. A higher magnification with Mason's trichrome stain shows different morphologies of HCT-8 layers (100×).
To verify that cells cultured in microgravity expressed characteristics typical of normal epithelial cells, HCT-8 organoids and cells grown in monolayers were stained with anti-human cytokeratin AE1/AE3, a cocktail of monoclonal antibodies against human cytokeratins of stratified squamous epithelia of internal organs (Tseng et al., 1982) (Fig. 2). These antibodies are typically used to identify hyper-proliferative tissue of epithelial origin and to characterize cultured epithelial cells. The pattern and intensity of cytokeratin staining in normal human intestinal tissue (Fig. 2A and B) were not appreciably different from that seen in HCT-8 organoids (Fig. 2C) or in HCT-8 monolayers (Fig. 2D). However, differences in cell morphology were apparent; the HCT-8 cells grown in monolayers appeared larger, flatter and less uniform than organoid cells or native tissue.
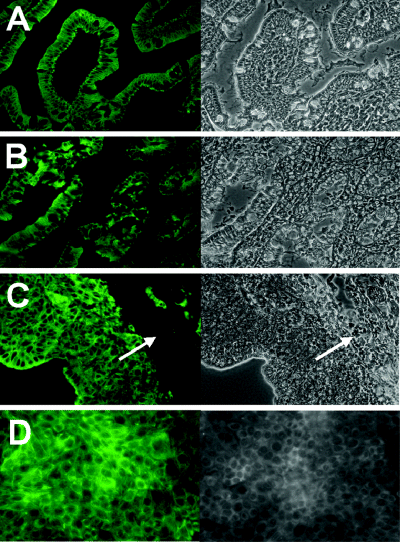
Immunofluorescent staining for cytokeratins AE1/AE3 and corresponding phase contrast images (40×) in (A) normal human colon (B) normal human small intestine (C) HCT-8 organoid and (D) HCT-8 monolayers. The bioscaffold (arrows in C) is visible by phase contrast but does not stain with the anti-cytokeratin antibody.
Because our goal with the HCT-8 organoid model was to study bacterial–host cell surface interactions, we wanted to further compare the surface area of organoid cells available for such interactions with that found in native and two-dimensionally grown tissue. We postulated that the observed differences in cellular morphology described above indicated that organoid-grown HCT-8 cells present a smaller proportion of their cell surface to the medium, analogous to the cell surface presented by native tissue to the lumen of the gut. To address this question, the size of trypsin-detached cells from organoids or from HCT-8 cells grown in monolayers was determined by flow cytometry through comparison with standard-sized particles (Fig. 3A). The organoid-grown cells varied very little in size and measured approximately 2 µm in diameter while the monolayer-grown cells exhibited a broader range of sizes from 2 to greater than 4.3 µm in diameter. To compare cell shape, we measured the cell peripheries from cross-sections of organoids, normal human intestinal tissue, and monolayer-grown HCT-8 cells and estimated the surface-exposed proportion of each cell type as depicted schematically in Fig. 3B. In normal and organoid tissue, 10–13% of the cell perimeter appeared to be at the tissue surface, while 23–37% of the perimeter of cells from monolayers appeared to be at the surface. From these data we concluded that organoid-grown HCT-8 cells present a more representative surface area for bacterial cell interactions than do two-dimensionally grown HCT-8 cells.
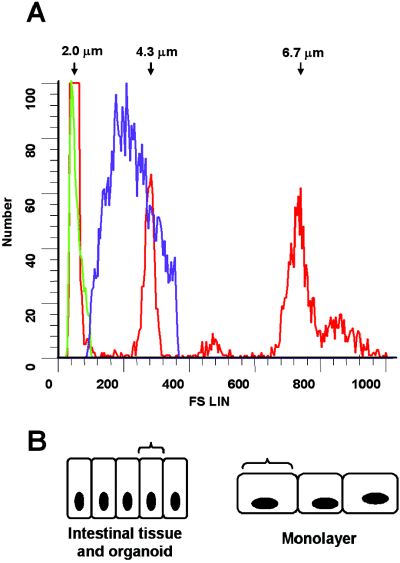
A. Size comparison by flow-cytometry of HCT-8 cells grown in organoids or monolayers. The red line represents peaks for standard sized beads (2, 4.3 and 5 µm), the green line represents HCT-8 cells from organoids, and the purple line represents the HCT-8 cells grown in monolayers. Cells grown as organoids tend to be smaller in diameter and to have less variation in size than cells grown as monolayers. B. The diagram depicts differences in cells shapes determined from cross-sections of HCT-8 organoids or monolayers. The brackets show the relative proportion of exposed surface for normal and organoid tissue contrasted with monolayer-derived cells.
Cellular markers of differentiation in HCT-8 organoids
A property of epithelial tissue is the assembly of a permeability barrier characterized by the development of tight junctions between cells. E-cadherin is one of the crucial elements of tight junctions in epithelial tissue (Takeichi, 1991). To evaluate tight junction formation, organoid tissue and conventionally grown HCT-8 cells were stained with anti-E-cadherin. We observed by immunofluorescence that, like E-cadherin in normal intestinal tissue (Fig. 4A, 1). E-cadherin in the HCT-8 organoids was concentrated at the periphery of cells and stained with the same intensity of fluorescence (Fig. 4A, 2). The appearance of E-cadherin in similarly stained monolayers of HCT-8 cells (Fig. 4A, 3) was less intense at the cellular junctions and more diffuse throughout the cytoplasm.
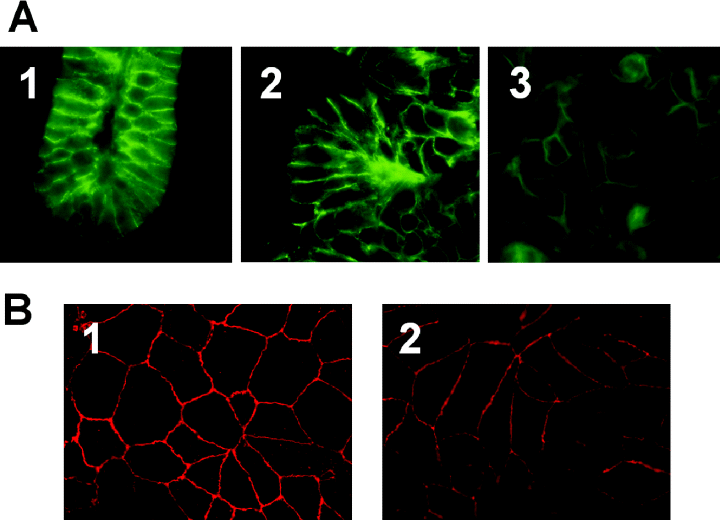
Cell junction characteristics in organoids and monolayers. A. Sections of paraffin-imbedded tissue stained with anti-E-cadherin. (1) normal human colon, (2) HCT-8 organoid and (3) HCT-8 monolayer. B. Fresh paraformaldehyde-fixed tissue stained with anti-ZO-1. (1) HCT-8 organoid and (2)HCT-8 monolayer (fresh human intestinal tissue was not available). HCT-8 organoids stained more uniformly for junctional markers than did the monolayers.
Organoid tissue and two-dimensional HCT-8 cells were tested for another marker of tight junction formation, the transmembrane protein component of the zona occludens, ZO-1 (Stevenson et al., 1986). Anti-ZO-1 antibody reacted strongly with the cellular junctions of the HCT-8 cells grown in the three-dimensional model (Fig. 4B, 1) and less consistently or uniformly at the junctions of HCT-8 cells grown in monolayers (Fig. 4B, 2). Similarly, fluorescent antibody detection of symplekin, another polypeptide present in the tight junctions of polarized epithelia and certain endothelia (Keon et al., 1996; Hofmann et al., 2002), revealed intense peripheral staining typical of tight junctions in organoid tissues that is typical of normal intestinal tissue, while HCT-8 cells grown in two-dimensional culture showed diffuse distribution of symplekin (data not shown). Findings from these three fluorescent antibody stains correlated well and strongly suggested the formation of intact and well defined tight junctions in the organoid tissues.
Villin is a cytoskeletal protein of the intestinal epithelial microvilli (Gröne et al., 1986). As such, villin is expressed predominantly on the apical surface of normal gut epithelial tissue (Robine et al., 1985). The distribution of villin served as a marker to determine whether maturation of the organoid resulted in the formation of a brush border typical of native tissue. We used anti-villin monoclonal antibody to follow the expression of villin in organoids harvested at different stages of growth (Fig. 5A, days 2–10). In organoid tissue harvested between 2 and 4 days of culture, villin stained with similar intensity to villin staining in HCT-8 monolayer-grown cells (Fig. 5B). However, as the cell aggregates continued to develop, villin staining became more pronounced at the cell surface than in the cytoplasm of underlying cells (see arrows, Fig. 5A). The apical localization of villin as the organoid tissue developed was consistent with villin staining in normal human small intestine (see arrow, Fig. 5C). HeLa cells, used as a negative control, showed no fluorescence when stained with anti-villin antibody (data not shown).
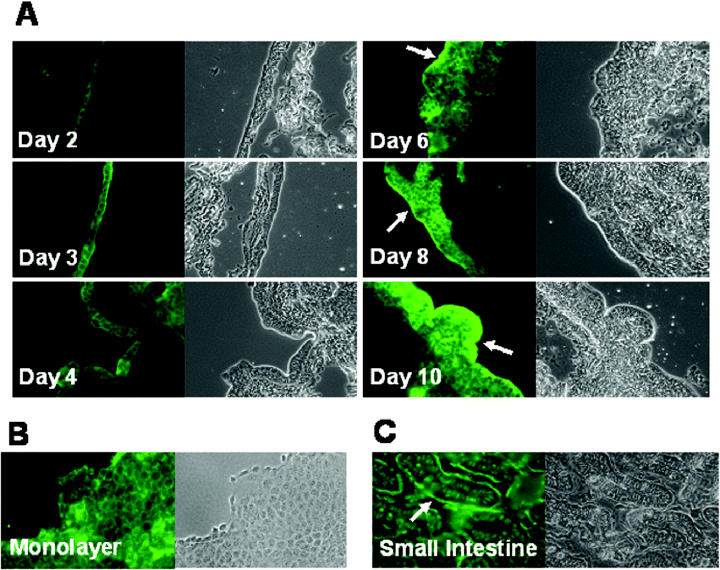
Detection of villin by fluorescence microscopy. A. HCT-8 organoids harvested on days 2, 3, 4, 6, 8 and 10, are shown stained with mouse anti-villin (green) and with phase contrast (40×). Villin accumulated at tissue periphery over time (see arrows). B. In HCT-8 monolayers, villin distribution appeared diffuse. C. In normal intestine, villin localized at tissue periphery (arrow). The bioscaffold did not stain with anti-villin antibody.
Electron microscopic examination of the organoid tissue sections (Fig. 6) showed the presence of microvillus-like structures on the surface cell layer of the organoids (Fig. 6A). Additionally, the formation of structures that resembled desmosomes was evident (Fig. 6B). These findings support the observations by immunofluorescence of villin localization at the apical tissue surface and of tight junction marker proteins at the cell peripheries.
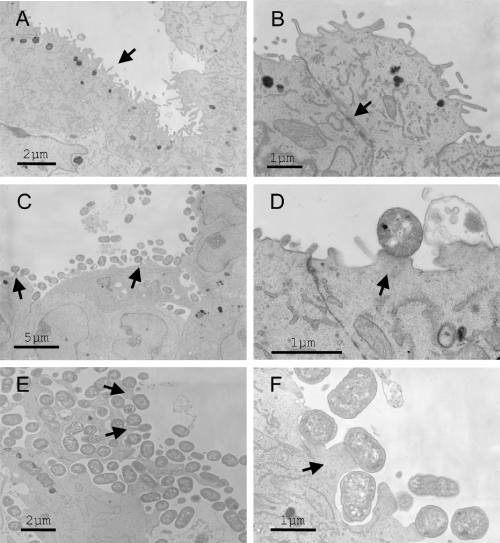
Electron microscopy of HCT-8 organoid sections. Bars indicate relative sizes in µm. A. Uninfected organoid tissue surface with microvilli (arrow). B. Higher magnification of tissue junctions with evidence of desmosomes (arrow). C. HCT-8 organoid infected with EPEC strain E2348/69 showed loss of microvilli and pedestal formation (arrows indicate pedestals). D. Greater detail of pedestals with adherent EPEC. E. HCT-8 organoid infected with EHEC strain 86-24 also showed pedestal formation and effacement (arrow). F. Greater detail of apical border of the EHEC-infected tissue and pedestal formation (arrow).
Enzyme markers of tissue differentiation in HCT-8 organoids
Disaccharidases in the intestinal mucosa play an important role in carbohydrate digestion. Homogenates of human intestinal mucosa obtained from biopsies show strong α-glycosidase activity attributable to a mixture of enzymes, the majority of which demonstrate maltase activity (Dahlqvist, 1962). Alkaline phosphatase production is also a characteristic of mature, differentiated intestinal tissue. We measured α-glycosidase activity and alkaline phosphatase activity in equivalent numbers of trypsin-released HCT-8 cells from organoids and monolayers. Clarified homogenates of cells were incubated with maltose then the disaccharidase cleavage product, glucose, was detected enzymatically and measured according to a standard concentration curve. Maltase activity, as assessed by the concentration of glucose released from organoid-derived cells, was 1.75-fold greater than that seen with monolayer-derived cells (P ≤ 0.001) (Fig. 7A). Alkaline phosphatase activity in clarified cellular homogenates was determined spectrophotometrically through the use of a chromogenic substrate, p-nitrophenyl phosphate (PNPP). The organoid-derived cells showed significantly more alkaline phosphatase activity than did the monolayer-derived cells (P ≤ 0.006) (Fig. 7B).
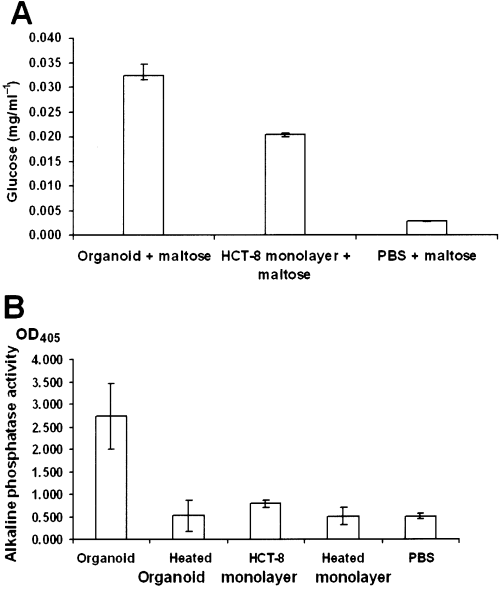
Activity of intestinal enzymes normalized for 1.5 × 10⁵ cells. A. The activity of disaccharidases was measured by production of glucose as a result of the breakdown of maltose. Values represent the average for three experiments and the bars indicate the 95% confidence intervals of the means. B. The reaction of alkaline phosphatase with the substrate p-nitrophenyl phosphate (PNPP) resulted in a yellow product that was measured by absorbance at 405 nm. Values represent the average of three experiments and bars indicate the 95% confidence intervals of the means. Heating of the cell lysates at 90°C/1 h completely inactivated the activity of alkaline phosphatase.
Organoid infection
Prior to challenge of the organoids with bacteria, we compared growth rates of wild-type EPEC strain E2348/69 and EHEC strain 86-24 (Levine et al., 1985; Griffin et al., 1988) in RCCS vessels under normal and microgravity. No gravity-associated difference was observed in their growth rates (Fig. 8A). Intimin expression in normal and reduced gravity was also measured for each strain on a cell count basis (Fig. 8B). There was no apparent difference in intimin levels expressed under normal or microgravity for EPEC (Fig. 8B, columns 1 and 2); however, the EHEC strain showed markedly elevated intimin expression in microgravity (Fig. 8B, columns 3 and 4). Shiga toxin type 2 expression by 86-24 and bundle-forming pili (BFP) expression by EPEC strain E2348/69 and its intimin-negative mutant CVD206 (Donnenberg and Kaper, 1991)were unaffected by growth in microgravity (data not shown).
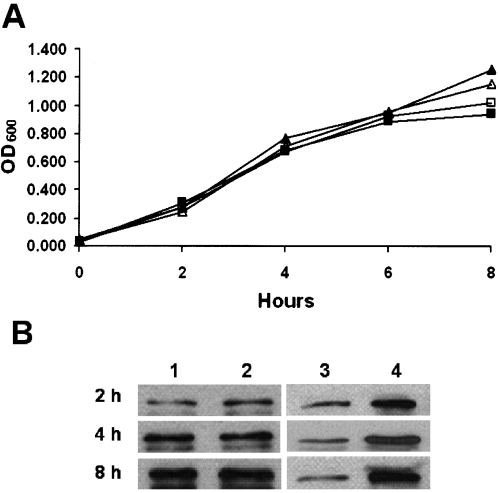
EPEC and EHEC growth under different gravitational conditions. A. The growth over time (expressed as optical density at 600 nm) of EPEC strain 2348/69 grown under normal gravity (▴) and microgravity (Δ), and EHEC strain 86-24 under normal gravity (□) and microgravity (▪). B. Intimin production over time in EPEC grown in normal gravity (column 1) and in microgravity (column 2) and EHEC grown in normal gravity (column 3) and microgravity (column 4) determined by Western blot analysis from broth cultures normalized by OD600 (± 0.01–0.02 OD600).
The HCT-8 organoids were infected with strain EPEC strain E2348/69, EPEC intimin-deficient mutant CVD206 and EHEC strain 86-24. After 6 h of infection of the organoid within the RCCS, adherent wild-type strains of EPEC (Fig. 9A–C) and EHEC (Fig. 9C–E) were detectable on the surface of the organoids. In contrast, the EPEC intimin-negative mutant did not adhere to the organoid (not shown). By electron microscopy, cellular pedestals characteristic of attach and efface lesions were seen underneath the wild-type EPEC (Fig. 6C and D) and EHEC (Fig. 6E and F).

Sections of HCT-8 organoids with adherent bacteria. Tissue sections were stained with rabbit anti-O-specific antisera and counterstained with Alexa fluor 488 donkey anti-rabbit IgG. The sequence shows the green fluorescent field, the phase contrast, and merged images. (A–C) EPEC stained with anti-O127 antiserum, and (D–F) EHEC was stained with anti-O157 antiserum (100×).
Discussion
HCT-8 cells rapidly formed three-dimensional structures in a low shear microgravity culture and expressed cytokeratin tissue markers as expected for this epithelial cell line. The size and surface area of the apical organoid cells appeared more typical of normal intestinal epithelium that did HCT-8 cells grown in monolayers. Several investigators have shown that certain tissue markers are better represented in three-dimensional aggregates formed under microgravitational conditions than in the same tissue types grown in two-dimensional cultures (Nickerson et al., 2001; Carterson et al., 2005). We also observed this to be true for E-cadherin, ZO-1, symplekin and villin expression in HCT-8 organoids. In addition, expression of disaccharidases and alkaline phosphatase was significantly greater in the organoid-grown HCT-8 cells compared with cells two-dimensional tissue culture. From these observations we concluded that the organoid tissue was more representative of, and somewhat more differentiated, than HCT-8 cells cultured in monolayers.
The organoids were mature and ready for bacterial challenge within 10 days. We considered this development time to be brief compared with two-dimensional cultures of polarized Caco-2 cells that can take 30 days to establish. In contrast to polarized Caco-2 cells that grow in a single layer, the HCT-8 organoid cells formed multilayered structures. As such, the interface between the single layer of gut epithelial cells and the mesenchymal layer was not recapitulated in the organoid model. Nonetheless, the morphology of the assembled cells varied according to their positions within the aggregate, with the surface layer of cells most resembling normal gut epithelium. Similarly, villin expression was concentrated at the tissue surface compared to that seen in underlying cells. This differential expression of villin is also seen in vivo where epithelial cells express increasingly more villin as they mature and move to the tips of the villi (Maunoury et al., 1992). We postulated that the cells at the surface of the organoid received signals for differentiation from the low-shear microgravity fluid environment and thus provided a suitable model for bacterial interactions at the lumenal surface of gut tissue.
Once the growth conditions for HCT-8 organoids were established and the resultant tissue aggregates were characterized, the organoids were challenged with EHEC and EPEC. Unlike earlier studies in which three-dimensional cell aggregates were infected with bacteria in culture dishes, the HCT-8 organoid infections were conducted in microgravity within the RCCS. Others have observed differential gene expression in Salmonella grown under microgravity, and we observed here that intimin production in EHEC strain 86-24 was increased in microgravity. Therefore, we felt that microgravity may have an influence on intimin-mediated bacterial and host interactions. In both EHEC and EPEC infection, we observed the characteristic intimin-mediated pedestal formation of HCT-8 cells with tightly adherent bacteria. The extent of A/E lesion formation appeared comparable for both EPEC and EHEC. The tissue disturbance seen by electron microscopy during EHEC infection was somewhat greater than that seen with EPEC infection, a finding that we speculated could be due to the production of Shiga toxin type 2 and haemolysin by the EHEC strain we tested.
The EPEC mutant CVD 206 that expresses BFP but lacks intimin did not appear to bind the organoid surface at all. This observation challenges one model for the mechanism of EPEC adherence to the intestinal border in which BFP mediate initial binding and then intimin provides the close attachment that results in cytoskeletal rearrangement (Donnenberg and Kaper, 1992). In that theory, intimin serves to mediate EPEC binding only after other adherence factors such as BFP mediate cell surface association. Our findings are more consistent with the model of Hicks et al. drawn from studies of EPEC infection in IVOC. Those data suggest that both initial binding and A/E lesion formation are intimin-dependent (Hicks et al., 1998). We envision additional experiments in the HCT-8 organoid model to assess the contributions of factors such as BFP and EspA filaments (secreted translocator proteins) on adherence and A/E lesion formation.
Culture of HCT-8 cells in low shear microgravity provided an efficient and relatively inexpensive method for the generation of well-differentiated three-dimensional tissues. The resultant organoids were readily infected, sectioned, stained and evaluated by standard histological procedures. We observed differences in both eukaryotic and bacterial growth characteristics during growth in simulated microgravity compared with two-dimensional culture conditions. Under microgravitational conditions, that are thought to be representative of the environment within the epithelial brush border, we observed the formation of classic A/E lesions upon infection with EHEC and EPEC. Although no one in vitro model provides all the features of in vivo infection, we conclude that the organoid model provides another useful and representative tissue culture for the study of bacterial–host interactions.
Experimental procedures
Cell culture
Human ileo-cecal colorectal adenocarcinoma – HCT-8 cells (ATCC, Manassas, MD) were cultured in 75 cm2 vented flasks using Eagle's minimal essential medium (EMEM) (Cambrex, Walkersville, MD) supplemented with 10% fecal calf serum (Atlantic Biological), 2 mM l-glutamine (Cambrex), penicillin/streptomycin (Cambrex) and gentamicin (80 µg ml−1). The cells were grown in a CO2 incubator at 37°C and were passed by enzymatic dissociation using trypsin-EDTA (Gibco, Carlsbad, CA).
Preparation of organoids
The low shear microgravity environment was provided by the rotary cell culture system (RCCS) (Synthecon, Houston, TX). Hydrated cell culture sheets of small intestine submucosa (Cook Bioteck, West Lafayette, IN) were aseptically cut in small squares (3 × 3 mm) inside a Petri dish that contained sterile phosphate-buffered saline (PBS). The squares were transferred to a 50 ml RCCS disposable vessel filled with the cell culture medium. A total of 107 HCT-8 cells were added to the vessel and a 3 ml syringe was attached to one of the vessel's ports for removal of bubbles. The vessel was sealed and attached to the RCCS inside the CO2 incubator. The initial rotation of the vessel was set at 13 r.p.m. As the cell aggregates grew in size, the rotational speed was increased to compensate for increased sedimentation rates. The media was changed 3 days after initial inoculation of cells and every 4 days after that.
Histology
Organoid samples were taken from the RCCS after 10 days of growth and fixed for 30 min in 5% formalin (Fisher Scientific, Pittsburgh, PA) then stored in PBS at 4°C. The tissue-like structures were gently transferred with forceps to cassettes for preparation of paraffin blocks. Slides for structural analysis were prepared and stained with haematoxylin and eosin and Mason trichrome stains by the Histology Department of the Uniformed Services University. Some slides were left unstained for further immunohistochemistry analysis.
Immunohistochemistry
The tissue-specific antibodies used included mouse anti-villin (Chemicon International, Temecula, CA), mouse anti-E-cadherin (Zymed Laboratories, South San Francisco, CA), rabbit anti-ZO-1 (Zymed Laboratories), mouse anti-human cytokeratin AE1/AE3 (DAKO Corporation, Carpinteria, CA) and rabbit antisymplekin (Zymed Laboratories). The secondary antibodies used were Alexa fluor 488 donkey anti-mouse IgG, Alexa fluor 488 donkey anti-rabbit IgG and Alexa fluor 594 goat anti-rabbit IgG (Molecular Probes, Eugene, OR). Unstained slides of organoids and controls of normal human adult tissue sections of the digestive system (Novagen, Madison, WI) were immuno-stained for cell-type-specific markers as controls. The slides were washed for 5 min in Histo-Clear (National Diagnostics, Atlanta, GA), 2 min in 95% ethanol and 2 min in 75% ethanol to remove the paraffin, and finally rehydrated in PBS for 30 min. The slides were then boiled for 10 min in Antigen Plus Buffer, pH 10 (Novagen), and blocked for 30 min with a 1% bovine serum albumin (BSA, Sigma, St. Louis, MO) solution in PBS. The primary antibodies were diluted in blocking solution as recommended by the manufacturers and applied to the slides for 1 h at room temperature. The slides were washed with PBS then secondary antibodies were diluted 1:200 in blocking solution and applied to the slides for 30 min in the dark at room temperature. Slides were washed with PBS and mounted with cover glasses using Fluoromount-G (Southern Biotechnologies, Birmingham, AL). For detection of ZO-1 the organoids were fixed in 4% paraformaldehyde (Electon Microscopy Sciences, Hatfield, PA) for 30 min and the tissue was treated with primary and secondary antibodies in microcentrifuge tubes. The tissue was then dissected into 1 mm slices, placed on slides, and mounted with Fluoromount-G and glass cover slip. For the monolayers, cells were cultured in 8 well slides (Nalge Nunc International, Naperville, IL) and fixed with 5% formalin or 4% paraformaldehyde for 30 min. The slides were washed with PBS prior to treatment with primary and secondary antibodies.
Flow cytometry
For the comparison of the size of the HCT-8 cells grown in monolayers versus under microgravitational conditions, the monolayers and organoids were disassociated using a 0.25% solution of trypsin (Cambrex). The cells were washed and fixed in 3% formalin (Fisher Scientific) prior to scanning with an EPICS XL-MCL flow cytometer. Size calibration standard beads (Flow Cytometry Standards, San Juan, PR) were used as reference for diameter sizes.
Intestinal enzyme assays
To detect the presence and activity of alkaline phosphatase the substrate PNPP (Zymed Laboratories) was used according to the manufacturer's instructions, with some modifications. Briefly, homogenates of individual organoids and HCT-8 cells from monolayers were made in 100 µl of PBS and were pelleted by centrifugation for 2 min at 10 000 r.p.m. A 100 µl sample of each clarified lysate was added to 100 µl of a working solution provided by the manufacturer and incubated at 37°C. After 20 min, the optical density of the mixture at 405 nm was determined. Enzyme activity was destroyed by heating lysates at 90°C for 1 h.
The Glucose C2-Autokit Glucose (Wako Chemical USA, Richmond, VA) was used to determine disaccharidase activity. Homogenates of organoids and HCT-8 cells were prepared as described above. Fifty µl of the homogenates were added to 50 µl of substrate (maltose 28 mM) and the mixtures were incubated at 37°C for 30 min. After incubation, 25 µl of each mixture was transferred into individual wells of a 96-well plate. A known concentration of glucose solution was used to create a glucose standard curve. The mixtures were then overlaid with 200 µl of reaction solution from the kit and incubated at 37°C, and after 5 min the optical density at 550 nm was determined. The glucose concentrations were verified with the Amplex Red Glucose Oxidase Assay kit (Molecular Probes, Eugene, OR) according to manufacturer's instructions.
Intimin, Stx2 and bundlin expression in normal and microgravity
Overnight Luria–Bertani (LB) cultures of EHEC strain 86-24 and EPEC strain 2348/69 were diluted 1:50 to a final volume of 10 ml and grown without HCT-8 cells in an RCCS under either normal gravity or microgravity. As above for organoid cultures, microgravity was achieved with the RCCS axis of rotation perpendicular to the gravity vector while normal gravity was achieved with the axis of rotation parallel to the gravity vector. Samples from each growth condition were collected at 0, 2, 4 and 8 h and optical density at 600 nm was determined. One such sample was used for serial dilution and determination of the colony-forming units (cfu) per millilitre. Another such sample was standardized to the same optical density (± 0.01–0.02 OD600), sonicated, and clarified by centrifugation. The samples were subjected to sodium dodecyl sulphate polyacrilamide gel electrophoresis (SDS-PAGE), proteins were transferred onto nitrocellulose membranes, and intimin was detected by Enhanced Chemiluminescence (ECL) Western blot (Amersham, Little Chalfont, UK). Goat polyclonal anti-intimin diluted 1:2000 was used as primary antibody and horseradish peroxidase-labelled rabbit anti-goat serum (Bio-Rad, Hercules, CA) was used as the secondary antibody. For EHEC a third sample was sonicated, clarified by centrifugation, and tested for Shiga-toxin production by Vero cell assay (Gentry and Dalrymple, 1980).
To determine whether BFP expression was influenced by growth at microgravity, cultures of E2348/69 and its intimin mutant CVD206 were grown as above in normal or microgravity. Samples taken at 3 and 6 h were prepared for Western blot as above. Bundlin was detected by ECL Western blot with rabbit anti-BfpA antibody diluted 1:1000 (graciously provided by M. Donnenberg) and horseradish peroxidase-labelled goat anti-rabbit secondary antibody.
Infection of the organoids with EPEC and EHEC
EPEC strains E2348/69 and CVD206, and EHEC strain 86-24 were grown overnight in a static culture at 37°C in LB broth (Becton Dickinson, Sparks, MD). Groups of three organoids were placed in Petri dishes and washed with sterile PBS to remove residual of antibiotic then they were transferred to 10 ml RCCS vessels that contained adherence assay medium without antibiotic (50 ml EMEM + 0.5 ml l-glutamine + 2.7 ml sodium bicarbonate + 1.7 ml of a 30% stock of mannose) (Gansheroff et al., 1999). A 0.1 ml sample of each bacterial strain that had been cultured overnight in LB broth (approximately 1 × 10⁸ cells) was added to the RCCS vessels containing the organoids. The vessels were sealed and placed in the bioreactor at the speed of 14 r.p.m. After 6 h of infection, the organoids were removed from the vessels, washed in PBS, and fixed in 5% formalin overnight. After fixation they were transferred to cassettes to prepare paraffin blocks. Sections were cut from the blocks and slides for microscopy were made, deparaffinized, and stained with E. coli antiserum O127 (Universidade de Santiago de Compostela – LREC, Lugo, Spain) and E. coli antiserum O157 (DIFCO Laboratories, Detroit, MI) as primary antibodies and Alexa fluor 488 donkey anti-rabbit IgG (Molecular Probes) as the secondary antibody.
Electron microscopy
Uninfected and infected organoids were prepared for electron microscopy. Samples were fixed in a mixture of 2% paraformaldehyde and 2% glutaraldehyde in 0.1 M cacodylate buffer with 2% sucrose at room temperature. After 1 h, the tissue was dissected into smaller pieces and placed in fresh fixative for another hour. After fixation, sections were washed three times in 0.1 M cacodylate buffer and post fixed in 1% OsO4 in 0.1 M cacodylate buffer with 1% K3Fe(CN)6 and 1% sucrose to improve membrane contrast at pH 7.4. After fixation, sections were washed again and processed in Araldite plastic embedding (Goping et al., 1992; Goping et al., 1995). Semi-thin sections were cut from araldite blocks with a glass knife on a Reicles ultramicrotome and stained with toluidine blue. Ultra-thin sections (70–80 nm) were obtained from the same araldite blocks with a Diatome diamond knife and collected on copper hexagonal grids. Sections were stained with uranyl acetate (30 min) and lead citrate (5 min), examined in a CM 100 Philips/FEI electron microscope at a beam voltage of 80 hK, and photomicrographs of sections taken.
Acknowledgements
We extend thanks to Susan Pletcher for her expert assistance in tissue processing, mounting and staining, and to Stephen Darnell for reference database management. These studies were funded by a Public Health Service grant from the National Institutes of Health (2 RO1 AI20148-22). The contents of this report are solely the responsibility of the authors and do not necessarily represent official views of the United States Department of the Navy and the Department of Defense.


